data analytics Archives - Page 3 of 12 - DexLab Analytics | Big Data Hadoop SAS R Analytics Predictive Modeling & Excel VBA

Bayes’ Theorem: A Brief Explanation

Bayes’ Theorem: A Brief Explanation

(This is in continuation of the previous blog, which was published on 22nd April, 2019 – www.dexlabanalytics.com/blog/a-beginners-guide-to-learning-data-science-fundamentals )

In this blog, we’ll try to get a hands-on understanding of the Bayes’ Theorem. While doing so, hopefully we’ll be able to grasp a basic understanding of concepts such as Prior odds ratio, Likelihood ratio and Posterior odds ratio.

Arguably, a lot of classification problems have their root in Bayes’ Theorem. Reverend T. Bayes came up with this superior logical function, which mathematically deducts the probability of an event occurring from a larger set by “flipping” the conditional probabilities.


Consider,  E1, E2, E3,……..En to be a partition a larger set “S” and now define an Event – A, such that A is a subset of S.

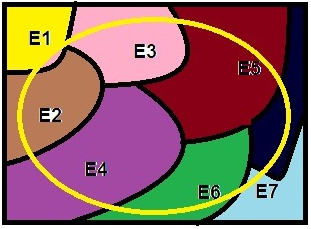
Let the square be the larger set “S” containing mutually exclusive events Ei’s.  Now, let the yellow ring passing through all Ei’s be an event – A.

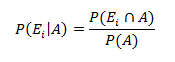
Using conditional probabilities, we know,

Also, the relationship:

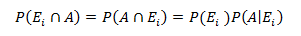
Law of total probability states:

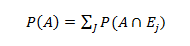
Rearranging the values of  &  gives us the Bayes Theorem:

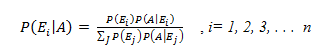
The values of  are also known as prior probabilities, the event A is some event, which is known to have occurred and the conditional probability   is known as the posterior probability.

Now that, you’ve got the maths behind it, it’s time to visualise its practical application. Bayesian thinking is a method of applying Bayes’ Theorem into a practical scenario to make sound judgements.

The next blog will be dedicated to Bayesian Thinking and its principles.

For now, imagine, there have been news headlines about builders snooping around houses they work in. You’ve got a builder in to work on something in your house. There is room for all sorts of bias to influence you into believing that the builder in your house is also an opportunistic thief.

However, if you were to apply Bayesian thinking, you can deduce that only a small fraction of the population are builders and of that population, a very tiny proportion is opportunistic thieves. Therefore, the probability of the builder in your house being an opportunistic thief is actually a product of the two proportions, which is indeed very-very small.

Technically speaking, we call the resulting posterior odds ratio as a product of prior odds ratio and likelihood ratio. More on applying Bayesian Thinking coming up in the next blog.

In the meantime try this exercise and leave your comments below in the comments section.

2

In the above example on “snooping builders”, what are your:

  • Ei’s
  • Event – A
  • “S”

About the Author: Nish Lau Bakshi is a professional data scientist with an actuarial background and a passion to use the power of statistics to tackle various pressing, daily life problems.

About the Institute: DexLab Analytics is a premier data analyst training institute in Gurgaon specializing in an enriching array of in-demand skill training courses for interested candidates. Skilled industry consultants craft state-of-the-art big data courses and excellent placement assistance ensures job guarantee.

For more from the tech series, stay tuned!


Interested in a career in Data Analyst?

To learn more about Data Analyst with Advanced excel course – Enrol Now.
To learn more about Data Analyst with R Course – Enrol Now.
To learn more about Big Data Course – Enrol Now.

To learn more about Machine Learning Using Python and Spark – Enrol Now.
To learn more about Data Analyst with SAS Course – Enrol Now.
To learn more about Data Analyst with Apache Spark Course – Enrol Now.
To learn more about Data Analyst with Market Risk Analytics and Modelling Course – Enrol Now.

General Python Guide 2019: Learning Data Analytics with Python

General Python Guide 2019: Learning Data Analytics with Python

Python and data analytics are possibly three of the most commonly heard words these days. In today’s burgeoning tech scene, being skillful in these two subjects can prove very profitable. Over the years, we have seen the importance of Python education in the field of data science skyrocketing.

So here we present a general guide to help start off your Python learning:

Reasons to Choose Python:

  • Popularity

With over 40% data scientists preferring Python, it is clearly one of the most widely used tools in data analysis. It has risen in popularity above SAS and SQL, only lagging behind R.

  • General Purpose Language

There might be many other great tools in the market for analyzing data, like SAS and R, but Python is the only trustworthy general-purpose language valid across a number of application domains.

2

Step 1: Setup Python Environment

Setting up Python environment is uncomplicated, but a primary step. Downloading the free Anaconda Python package is recommended. Besides core Python language, it includes all the essential libraries, such as Pandas, SciPy, NumPy and IPython, and graphical installer also. Post installation, a package containing several programs is launched, most important one being iPython also known as Jupyter notebook. After launching the notebook, the terminal opens and a notebook is started in the browser. This browser works as the coding platform and there’s no need for internet connection even.

Step 2: Knowing Python Fundamentals

Getting familiar with the basics of Python can happen online. Active participation in free online courses, where video tutorials, practice exercises are plentiful, can help you grasp the fundamentals quickly. However, if you are seeking expert guidance, you must explore our Python data science courses.

Step 3: Know Key Python Packages used for Data Analysis

Since it is a general purpose language, Python’s utility stretches beyond data science. But there are plentiful Python libraries useful in data functionalities.

Numpy – essential for scientific computing

Matplotib – handy for visualization and plotting

Pandas – used in data operations

Skikit-learn – library meant to help with data mining and machine learning activities

StatsModels – applied for statistical analysis and modeling

Scipy-SciPy – the Numpy extension of Python; it is a set of math functions and algorithms

Theano – package defining multi-dimensional arrays.

Step 4: Load Sample Data for Practice

Working with sample datasets is a great way of getting familiar with a programming language. Through this kind of practice, candidates can try out different methods, apply novel techniques and also pinpoint areas of strength and in need of improvement.

Python library StatModels contains preloaded datasets for practice. Users can also download dataset from CSV files or other sources on web.

Step 5: Data Operations

Data administration is a key skill that helps extract information from raw data. Majority of times, we get access to crude data that cannot be analyzed straightaway; it needs to be manipulated before analyzing. Python has several tools for formatting, manipulating and cleaning data before it is examined.

Step 6: Efficient Data Visualization

Visuals are very valuable for investigative data analysis and also explaining results lucidly. The common Python library used for visualization is Matplotlib.

Step 7: Data Analytics

Formatting data and designing graphs and plots are important in data analysis. But the foundation of analytics is in statistical modeling, data mining and machine learning algorithms. Having libraries like StatsModels and Scikit-learn, Python provides all necessary tools essential for performing core analyzing functions.

Concluding

As mentioned before, the key to learning data analytics with Python is practicing with imported data sets. So without delay, start experimenting with old operations and new techniques on data sets.

For more useful blogs on data science, follow DexLab Analytics – we help you stay updated with all the latest happenings in the data world! Also, check our excellent Python courses in Delhi NCR.


Interested in a career in Data Analyst?

To learn more about Data Analyst with Advanced excel course – Enrol Now.
To learn more about Data Analyst with R Course – Enrol Now.
To learn more about Big Data Course – Enrol Now.

To learn more about Machine Learning Using Python and Spark – Enrol Now.
To learn more about Data Analyst with SAS Course – Enrol Now.
To learn more about Data Analyst with Apache Spark Course – Enrol Now.
To learn more about Data Analyst with Market Risk Analytics and Modelling Course – Enrol Now.

Databricks Supports Apache Spark 2.4 and Adds ML Runtime

Databricks Supports Apache Spark 2.4 and Adds ML Runtime

Databricks recently embraced the Apache Spark 2.4, a latest version. They are integrating it into their platform of analytics. Also, the company is on its way to unveil another runtime feature that would simplify the intricacies of deep learning.

Needless to say, Databricks is one of the most powerful supporters of version 2.4 of Spark, the notable stream processing framework.  The latest upgraded version features improvement in the performance of machine learning framework running on Spark as well as distributed deep learning. It also includes modifications that would instantly address dependency issues related to deep learning tasks.

Project Hydrogen is an ambitious initiative; it’s under this tag the Spark upgrades were fused and introduced as a new scheduling mode, known as ‘barrier execution’. It encourages developers to embed training in lieu of distributed deep learning posed as an Apache Spark workload.

In context to above, Reynold Xin, a staunch Spark contributor and co-founder at Databricks said, “This is the largest change to Spark’s scheduler since the inception of the project.” He further mentioned that the upgrades will actually help reduce the complexities of machine learning structures and ensure high efficacy.

The latest runtime detail categorized HorovodRunner is developed to rationalize scaling and streamlining of distributed deep learning workloads. It is performed from a single machine to huge clusters. Previously, drifting from single-node workloads to huge distributed training on GPU or CPU clusters needed a bunch of full code rewrites – it was exceedingly challenging enough. Undeniably, HorovodRunner reduces training as well as programming time cutting down them from hours to a few minutes. This was claimed by the professionals working at Databricks.

Besides Horovod, Databricks is found to be saying that its platform offers native integration with TensorFlow, Kera and several other machine learning programs coupled with MLib and GraphFrames super machine learning algorithms.

On top of all this, a few weeks back, Databricks associated itself with a versatile cloud data integrator Talend with a sole aim to integrate the cloud service with their own data analytics platform to allow data scientists leverage the cluster computing framework – it would help process large data sets at scale.

About Apache Spark:

Apache Spark is a robust, well-integrated analytics engine efficient in processing large datasets. Crafted for high speed, productivity and generic use, it is considered as one of the most popular projects in motion under Apache software umbrella. It is also one of the most volatile and active open source big data projects.

DexLab Analytics is a top-notch Apache Spark training institute in Gurgaon. It provides top of the line in-demand skill training on a plethora of new-age IT related courses, such as data science, data analytics courses, big data, risk analytics and more.


The blog was sourced from ― www.datanami.com/2018/11/19/databricks-upgrades-spark-support-adds-ml-runtime


Interested in a career in Data Analyst?

To learn more about Data Analyst with Advanced excel course – Enrol Now.
To learn more about Data Analyst with R Course – Enrol Now.
To learn more about Big Data Course – Enrol Now.

To learn more about Machine Learning Using Python and Spark – Enrol Now.
To learn more about Data Analyst with SAS Course – Enrol Now.
To learn more about Data Analyst with Apache Spark Course – Enrol Now.
To learn more about Data Analyst with Market Risk Analytics and Modelling Course – Enrol Now.

Private Banks, Followed by E-commerce and Telecom Industry Shows High Adoption Rates for Data Analytics

Private Banks, Followed by E-commerce and Telecom Industry Shows High Adoption Rates for Data Analytics

Are you looking for a data analyst job? The chances of bagging a job at a private bank are more than that a public bank. The former is more likely to hire you than the latter.

As a matter of fact, data analytics is widely being used in the private banking and e-commerce sectors – according to a report on the state of data analytics in Indian business. The veritable report was released last month by Analytics India Magazine in association with the data science institute INSOFE. Next to banking and ecommerce, telecom and financial service sectors have started to adopt the tools of data analytics on a larger scale, the report mentioned.

The report was prepared focusing on 50 large firms across myriad sectors, namely Maruti Suzuki and Tata Motors in automobiles, ONGC and Reliance Industries under oil-drilling and refineries, Zomato and Paytm under e-commerce tab, and HDFC and the State Bank of India in banking.

2

If you follow the study closely, you will discover that in a nutshell, data analytics and data science boasts of a healthy adoption rate all throughout – 64% large Indian firms has started implementing this wonder tool at their workplaces. As a fact, if a firm is found to have an analytics penetration rate of minimum 0.75% (which means, at least one analytics professional is found out of 133 employees in a company), we can say the company has adopted analytics.

Nevertheless, the rate of adoption was not universal overall. We can see that infrastructure firms have zero adoption rates – this might be due to a lack of resources to power up a robust analytics facility or whatever. Also, steel, power and oil exhibited low adoption rates as well with not even 40% of the surveyed firms crossing the 0.75% bar. On contrary, private banks and telecom industry showed a total 100% adoption rates.

Astonishingly, public sector banks showed a 50% adoption rate- almost half of the rate in the private sector.

The study revealed more and more companies in India are looking forward to data analytics to boost sales and marketing initiatives. The tools of analytics are largely employed in the sales domain, followed by finance and operations.

Apparently, not much of the results were directly comparable with that of the last year’s study. Interestingly, one metric – analytics penetration rate – was measured last year as well, which is nothing but the ratio of analytics-oriented employees to the total. Also, last year, you would have found one out of 59 employees in an average organization, which has now reached one data analyst for every 36 employees.

For detailed information, read the full blog here: qz.com/india/1482919/banks-telcos-e-commerce-firms-hire-most-data-analysts-in-india

If you are interested in following more such interesting blogs and technology-related updates, follow DexLab Analytics, a premium analytics training institute headquartered in Gurgaon, Delhi. Grab a data analyst certification today and join the bandwagon of success.


Interested in a career in Data Analyst?

To learn more about Data Analyst with Advanced excel course – Enrol Now.
To learn more about Data Analyst with R Course – Enrol Now.
To learn more about Big Data Course – Enrol Now.

To learn more about Machine Learning Using Python and Spark – Enrol Now.
To learn more about Data Analyst with SAS Course – Enrol Now.
To learn more about Data Analyst with Apache Spark Course – Enrol Now.
To learn more about Data Analyst with Market Risk Analytics and Modelling Course – Enrol Now.

Data Driven Projects: 3 Questions That You Need to Know

Data Driven Projects: 3 Questions That You Need to Know

Today, data is an asset. It’s a prized possession for companies – it helps derive crucial insights about customers, thus future business operations. It also boosts sales, predicts product development and optimizes delivery chains.

Nevertheless, several recent reports suggest that even though data floats around in abundance, a bulk of data-driven projects fail. In 2017 alone, Gartner highlighted 60% of big data projects fail – so what leads it? Why the availability of data still can’t ensure success of these projects?

2

Right data, do I have it?

It’s best to assume the data which you have is accurate. After all, organizations have been keeping data for years, and now it’s about time they start making sense out of it. The challenge that they come across is that this data might give crucial insights about past operations, but for present scenario, they might not be good enough.

To predict the future outcomes, you need fresh, real-time data. But do you know how to find it? This question leads us to the next sub-head.

Where to find relevant data?

Each and every company does have a database. In fact, many companies have built in data warehouses, which can be transformed into data lakes. With such vast data storehouses, finding data is no more a difficult task, or is it?

Gartner report shared, “Many of these companies have built these data lakes and stored a lot of data in them. But if you ask the companies how successful are you doing predictions on the data lake, you’re going to find lots and lots of struggle they’re having.”

Put simply, too many data storehouses may pose a challenge at times. The approach, ‘one destination for all data in the enterprise’ can be detrimental. Therefore, it’s necessary to look for data outside the data warehouses; third party sources can be helpful or even company’s partner network.

How to combine data together?

Siloed data can be calamitous. Unsurprisingly, data is available in all shapes and is derived from numerous sources – software applications, mobile phones, IoT sensors, social media platforms and lot more – compiling all the data sources and reconciling data to derive meaningful insights can thus be extremely difficult.

However, the problem isn’t about the lack of technology. A wide array of tools and software applications are available in the market that can speed up the process of data integration. The real challenge lies in understanding the crucial role of data integration. After all, funding an AI project is no big deal – but securing a budget to address the problem of data integration efficiently is a real challenge.

In a nutshell, however data sounds all promising, many organizations still don’t know how achieve full potential out of data analytics. They need to strengthen their data foundation, and make sure the data that is collected is accurate and pulled out from a relevant source.

A good data analyst course in Gurgaon can be of help! Several data analytics training institutes offer such in-demand skill training course, DexLab Analytics is one of them. For more information, visit their official site.

The blog has been sourced fromdataconomy.com/2018/10/three-questions-you-need-to-answer-to-succeed-in-data-driven-projects


Interested in a career in Data Analyst?

To learn more about Data Analyst with Advanced excel course – Enrol Now.
To learn more about Data Analyst with R Course – Enrol Now.
To learn more about Big Data Course – Enrol Now.

To learn more about Machine Learning Using Python and Spark – Enrol Now.
To learn more about Data Analyst with SAS Course – Enrol Now.
To learn more about Data Analyst with Apache Spark Course – Enrol Now.
To learn more about Data Analyst with Market Risk Analytics and Modelling Course – Enrol Now.

5 Incredible Techniques to Lift Data Analysis to the Next Level

5 Incredible Techniques to Lift Data Analysis to the Next Level

Today, it’s all about converting data into actionable insights. How much data an organization collects from a plethora of sources is all companies cares of. To understand the intricacies of the business operations and helps team identify future trends, data is the power.

Interestingly, there’s more than one way to analyze data. Depending on your requirement and types of data you need to have, the perfect tool for data analytics will fluctuate. Here, we’ve 5 methods of data analysis that will help you develop more relevant and actionable insights.

DexLab Analytics is a premier data analytics training institute in Noida. It offers cutting edge data analyst courses for data enthusiasts.

2

Difference between Quantitative and Qualitative Data:

What type of data do you have? Quantitative or qualitative? From the name itself you can guess quantitative deal is all about numbers and quantities. The data includes sales numbers, marketing data, including payroll data, revenues and click-through rates, and any form of data that can be counted objectively.

Qualitative data is relatively difficult to pin down; they tend to be more subjective and explanatory. Customer surveys, interview results of employees and data that are more inclined towards quality than quantity are some of the best examples of qualitative data. As a result, the method of analysis is less structured and simple as compared to quantitative techniques.

Measuring Techniques for Quantitative Data:

Regression Analysis

When it comes to making forecasts and predictions and future trend analysis, regression studies are the best bet. The tool of regression measures the relationship between a dependent variable and an independent variable.

Hypothesis Testing

Widely known as ‘T Testing’, this type of analytics method boosts easy comparison of data against the hypothesis and assumptions you’ve made regarding a set of operations. It also allows you to forecast future decisions that might affect your organization.

Monte Carlo Simulation

Touted as one of the most popular techniques to determine the impact of unpredictable variables on a particular factor, Monte Carlo simulations implement probability modeling for smooth prediction of risk and uncertainty. This type of simulation uses random numbers and data to exhibit a series of possible outcomes for any circumstance based on any results. Finance, engineering, logistics and project management are a few industries where this incredible tool is widely used.

Measuring Techniques for Qualitative Data:

Unlike quantitative data, qualitative data analysis calls for more subjective approaches, away from pure statistical analysis and methodologies. Though, you still will be able to extract meaningful information from data by employing different data analysis techniques, subject to your demands.

Here, we’ve two such techniques that focus on qualitative data:

Content Analysis

It works best when working with data, like interview data, user feedback, survey results and more – content analysis is all about deciphering overall themes emerging out of a qualitative data. It helps in parsing textual data to discover common threads focusing on improvement.

Narrative Analysis

Narrative analysis help you understand organizational culture by the way ideas and narratives are communicated within an organization. It works best when planning new marketing campaigns and mulling over changes within corporate culture – it includes what customers think about an organization, how employees feel about their job remuneration and how business operations are perceived.

Agreed or not, there’s no gold standard for data analysis or the best way to perform it. You have to select the method, which you deem fit for your data and requirements, and unravel improved insights and optimize organizational goals.

 
The blog has been sourced fromwww.sisense.com/blog/5-techniques-take-data-analysis-another-level
 

Interested in a career in Data Analyst?

To learn more about Data Analyst with Advanced excel course – Enrol Now.
To learn more about Data Analyst with R Course – Enrol Now.
To learn more about Big Data Course – Enrol Now.

To learn more about Machine Learning Using Python and Spark – Enrol Now.
To learn more about Data Analyst with SAS Course – Enrol Now.
To learn more about Data Analyst with Apache Spark Course – Enrol Now.
To learn more about Data Analyst with Market Risk Analytics and Modelling Course – Enrol Now.

How Data Analytics Should Be Managed In Your Company, and Who Will Lead It?

How Data Analytics Should Be Managed In Your Company, and Who Will Lead It?

In the last couple of years, data management strategies have revolutionized a lot. Previously, the data management used to come under the purview of the IT department, while data analytics was performed based on business requirements. Today, a more centralized approach is being taken uniting the roles of data management and analytics – thanks to the growing prowess of predictive analytics!

Predictive analytics has brought in a significant change – it leverages data and extracts insights to enhance revenue and customer retention. However, many companies are yet to realize the power of predictive analytics. Unfortunately, data is still siloed in IT, and several departments still depend on basic calculations done by Excel.

But, of course, on a positive note, companies are shifting focus and trying to recognize the budding, robust technology. They are adopting predictive analytics and trying to leverage big data analytics. For that, they are appointing skilled data scientists, who possess the required know-how of statistical techniques and are strong on numbers.

2

Strategizing Analytical Campaigns

An enterprise-wide strategy is the key to accomplish analytical goals and how. Remember, the strategy should be encompassing and incorporate needful laws that need to be followed, like GDPR. This signifies effective data analytics strategies begin from the top.

C-suite is a priority for any company, especially which looks forward to defining data and analytics, but each company also require a designated person, who would act as a link between C-suite and the rest of the company. This is the best way to mitigate the wrong decisions and ineffective strategies that are made in silos within the organization.

Chief Data Officers, Chief Analytics Officers and Chief Technology Officers are some of the most popular new age job designations that have come up. Eminent personalities in these fetching positions play influential roles in strategizing and executing a successful corporate-level data analytics plan. The main objective of them is to provide analytical support to the business units, determine the impact of analytical strategies and ascertain and implement innovative analytical prospects.

Defensive Vs Offensive Data Strategy

To begin, defensive strategy deals with compliance with regulations, prevention of theft and fraud detection, while offensive strategy is about supporting business achievements and strategizing ways to enhance profitability, customer retention and revenue generation.

Generally, companies following a defensive data strategy operate across industries that are heavily regulated (for example, pharmaceuticals, automobile, etc.) – no doubt, they need more control on data. Thus, a well-devised data strategy has to ensure complete data security, optimize the process of data extraction and observe regulatory compliance.

On the other hand, offensive strategy requires more tactical implementation of data. Why? Because they perform in a more customer-oriented industry. Here, the analytics have to be more real-time and their numerical value will depend on how quickly they can arrive at decisions. Hence, it becomes a priority to equip the business units with analytical tools along with data. As a result, self-service BI tools turns out to be a fair deal. They are found useful. Some of the most common self-service BI vendors are Tableau and PowerBI. They are very easy to use and deliver the promises of flexibility, efficacy and user value.  

As final remarks, the sole responsibility of managing data analytics within an organization rests on a skilled team of software engineers, data analysts and data scientists. Only together, they would be able to take the charge of building successful analytical campaigns and secure the future of the company.

For R Predictive Modelling Certification, join DexLab Analytics. It’s a premier data science training platform that offers top of the line intensive courses for all data enthusiasts. For more details, visit their homepage.


The blog has been sourced from dataconomy.com/2018/09/who-should-own-data-analytics-in-your-company-and-why


Interested in a career in Data Analyst?

To learn more about Data Analyst with Advanced excel course – Enrol Now.
To learn more about Data Analyst with R Course – Enrol Now.
To learn more about Big Data Course – Enrol Now.

To learn more about Machine Learning Using Python and Spark – Enrol Now.
To learn more about Data Analyst with SAS Course – Enrol Now.
To learn more about Data Analyst with Apache Spark Course – Enrol Now.
To learn more about Data Analyst with Market Risk Analytics and Modelling Course – Enrol Now.

3 Potent IoT Challenges That Keeps Data Scientists Always on Toes

3 Potent IoT Challenges That Keeps Data Scientists Always on Toes

The job responsibility of data scientists is no mean feat. They stay under a lot of pressure. A wide number of stumbling blocks are laid in front of them, which makes it really difficult for them to secure the long-shot business goals and objectives.

As prevention is better than cure – being aware of the challenges always help data scientists plot the shortest and smartest route to success, and we can’t agree more. Brace yourselves! Below, we’ve enumerated some of the challenges data scientists face while getting started with an IoT project:

2

Inferior Data Quality

Messy data is life and soul of data scientists. Irrespective of business scale, the job of every data scientist is to organize data in the correct manner. But, however organizing them may require adequate time as well as hard work.

A fundamental rule – avoid manual data, wherever possible. Intelligent data compilation is the final key to high quality data, which is a prerequisite for favorable company operation. It includes crisp communication, regular anomaly detection, logic determination and well-defined industry standards. Another way to tame your data can be through application integration tools – they are a fabulous way to automate data entry and lessen escalation of typographical errors, individual eccentricities, staggering spellings and more from the data.

Once data is in the right format and quality, data scientists can start slicing off the data they don’t need any more, which takes us to the next step.

For Data Science Certification, drop by DexLab Analytics.

Shedding Out Excessive Data

Though big data is found in abundance, too much of data can also pose a substantial challenge. This is why employing superior data selection techniques and minimizing features are supported, they help eliminate unwanted chaos cutting through what matters the most.

What happens is that when data becomes excessively large, we often end up developing high-end predictive models that fails to deliver productive results. But, on the other hand, if you track the events, giving importance to validation and testing routines, the outcomes will spell perfection. And that’s what we are looking forward to.

Predictive Analytics is the Key

IoT has made predictive analytics a daunting reality. Owing to its critical business significance, predictive analytics is quickly accelerating along the priority ladder of IoT stakeholders. However, take a note, this breed of analytics may not be fruitful in every instance. It’s imperative to begin your analytics endeavor by clearly defining your module’s objective, followed by needed research and valuation.

Next, you need to sync in with subject matter pundits to ascertain which predictions will lead you closer to fulfilling the business objectives. Following to this, you have to be sure that you have all the data required to make prediction. In other cases, you can re-set goals, anytime.

Find the best Data Science Courses in Noida… At DexLab Analytics. Get detailed information on the website.


The blog has been sourced from — www.networkworld.com/article/3305329/internet-of-things/3-iot-challenges-that-keep-data-scientists-up-at-night.html


Interested in a career in Data Analyst?

To learn more about Data Analyst with Advanced excel course – Enrol Now.
To learn more about Data Analyst with R Course – Enrol Now.
To learn more about Big Data Course – Enrol Now.

To learn more about Machine Learning Using Python and Spark – Enrol Now.
To learn more about Data Analyst with SAS Course – Enrol Now.
To learn more about Data Analyst with Apache Spark Course – Enrol Now.
To learn more about Data Analyst with Market Risk Analytics and Modelling Course – Enrol Now.

Cyber Security with Data Analytics: Key to a Successful Future

Cyber Security with Data Analytics: Key to a Successful Future

Cyber security and data analytics are two dominant fields of technology that’s increasingly gaining a lot of importance. While data analytics helps in figuring out whether the latest campaign was successful or not, cyber security ensures all your confidential documents are stored in the cloud under supreme security and surveillance.

Nevertheless, learning them can be quite expensive and time-consuming. Especially so for the bosses, who like forever wonder if these in-demand courses would help their employees imbibe added skills and improved work expertise.

On the contrary, we would say attending data analyst courses in Delhi is not at all like a wager – in fact, in most cases, it turns out to be good bets for the bosses as their employees learn in-demand skills with which they strive for long-term wins for the company, pulling up the company’s fortune and future with them. So, not bad eh?

2

The Pathway to Success

Now, talking about the employment and work opportunities, if you ask which positions would fill up sooner, you’d most certainly hear: data analytics and cyber security. The world is in dire need of skilled data analysts; and trust us, when we say they are difficult to find, but harder to retain! Because mature talent is not an everyday affair, anymore. So, what happens next?

A majority of cybersecurity tool providers are adding ultra-functional data science capabilities to their cybersecurity platforms. This includes factoring behavior-based analytics and responses into antivirus suites, firewalls, and traffic analyzers – which, eventually turns the products and services smarter and effective. Another domain worth noticing is the artificial intelligence, which when fused with data science can augment conventional cybersecurity. Though the technology is still in its nascent stage, soon it’s going to garner attention and develop full-fledged.

Meanwhile, the frameworks of cybersecurity are evolving. This exposes the challenge of securing black-box algorithms – an incredible product of data science program that helps us learn and grow dynamically.

As these analytical models are so highly intricate as well as valuable for the companies, cybersecurity professionals need to be well-versed in all avenues of data science for ascertaining protection to these models, while ensuring integrity at the same time.

Conclusion

Therefore, the convergence of data science and cybersecurity is proved to be one of the trendiest areas of technology industry in the next few years. With regular innovations and technological evolution, be prepared to witness a surge in the demand for data science and cybersecurity professionals before it heads towards a near-term horizon.

So, start preparing yourself now and be ready to hone your skills in elusive cybersecurity practices and AI controls and models to stay ahead of the curve.

DexLab Analytics offers comprehensive data analytics certification courses for freshers as well as intermediates. Pick a particular course, train yourself and dig deeper into the world of analytics.

For more information, visit their official website today.


The blog has been sourced from —

vulcanpost.com/644684/data-analytics-courses-singapore/

tdwi.org/articles/2018/01/16/adv-all-cybersecurity-plus-data-science-future-career-path.aspx
 

Interested in a career in Data Analyst?

To learn more about Data Analyst with Advanced excel course – Enrol Now.
To learn more about Data Analyst with R Course – Enrol Now.
To learn more about Big Data Course – Enrol Now.

To learn more about Machine Learning Using Python and Spark – Enrol Now.
To learn more about Data Analyst with SAS Course – Enrol Now.
To learn more about Data Analyst with Apache Spark Course – Enrol Now.
To learn more about Data Analyst with Market Risk Analytics and Modelling Course – Enrol Now.

Call us to know more