Data Analytics Techniques Archives - DexLab Analytics | Big Data Hadoop SAS R Analytics Predictive Modeling & Excel VBA

Time Series Analysis Part I


A time series is a sequence of numerical data in which each item is associated with a particular instant in time. Many sets of data appear as time series: a monthly sequence of the quantity of goods shipped from a factory, a weekly series of the number of road accidents, daily rainfall amounts, hourly observations made on the yield of a chemical process, and so on. Examples of time series abound in such fields as economics, business, engineering, the natural sciences (especially geophysics and meteorology), and the social sciences.

  • Univariate time series analysis- When we have a single sequence of data observed over time then it is called univariate time series analysis.
  • Multivariate time series analysis – When we have several sets of data for the same sequence of time periods to observe then it is called multivariate time series analysis.

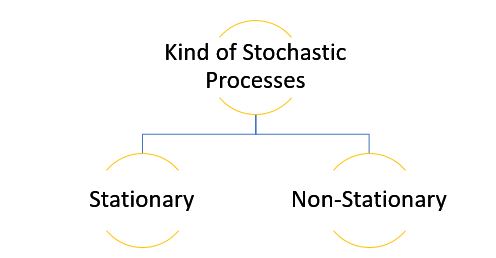
The data used in time series analysis is a random variable (Yt) where t is denoted as time and such a collection of random variables ordered in time is called random or stochastic process.

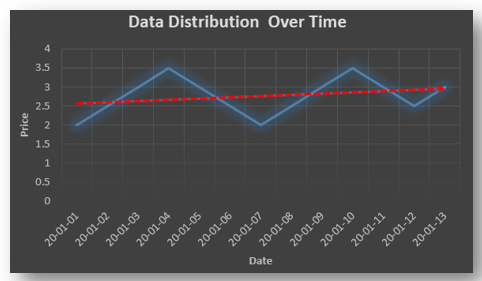
Stationary: A time series is said to be stationary when all the moments of its probability distribution i.e. mean, variance , covariance etc. are invariant over time. It becomes quite easy forecast data in this kind of situation as the hidden patterns are recognizable which make predictions easy.

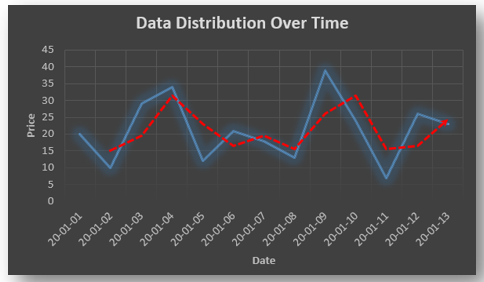
Non-stationary: A non-stationary time series will have a time varying mean or time varying variance or both, which makes it impossible to generalize the time series over other time periods.

Non stationary processes can further be explained with the help of a term called Random walk models. This term or theory usually is used in stock market which assumes that stock prices are independent of each other over time. Now there are two types of random walks:
Random walk with drift : When the observation that is to be predicted at a time ‘t’ is equal to last period’s value plus a constant or a drift (α) and the residual term (ε). It can be written as
Yt= α + Yt-1 + εt
The equation shows that Yt drifts upwards or downwards depending upon α being positive or negative and the mean and the variance also increases over time.
Random walk without drift: The random walk without a drift model observes that the values to be predicted at time ‘t’ is equal to last past period’s value plus a random shock.
Yt= Yt-1 + εt
Consider that the effect in one unit shock then the process started at some time 0 with a value of Y0
When t=1
Y1= Y0 + ε1
When t=2
Y2= Y1+ ε2= Y0 + ε1+ ε2
In general,
Yt= Y0+∑ εt
In this case as t increases the variance increases indefinitely whereas the mean value of Y is equal to its initial or starting value. Therefore the random walk model without drift is a non-stationary process.

So, with that we come to the end of the discussion on the Time Series. Hopefully it helped you understand time Series, for more information you can also watch the video tutorial attached down this blog. DexLab Analytics offers machine learning courses in delhi. To keep on learning more, follow DexLab Analytics blog.


.
What Role Does A Data Scientist Play In A Business Organization?

What Role Does A Data Scientist Play In A Business Organization?

The job of a data scientist is one that is challenging, exciting and crucial to an organization’s success.  So, it’s no surprise that there is a rush to enroll in a Data Science course, to be eligible for the job. But, while you are at it, you also need to have the awareness regarding the job responsibilities usually bestowed upon the data scientists in a business organization and you would be surprised to learn that the responsibilities of a data scientist differs from that of a data analyst or, a data engineer.

So, what is the role and responsibility of a data scientist?  Let’s take a look.

The common idea regarding a data scientist role is that they analyze huge volumes of data in order to find patterns and extract information that would help the organizations to move ahead by developing strategies accordingly. This surface level idea cannot sum up the way a data scientist navigates through the data field. The responsibilities could be broken down into segments and that would help you get the bigger picture.

Data management

The data scientist, post assuming the role, needs to be aware of the goal of the organization in order to proceed. He needs to stay aware of the top trends in the industry to guide his organization, and collect data and also decide which methods are to be used for the purpose. The most crucial part of the job is the developing the knowledge of the problems the business is trying solve and the data available that have relevance and could be used to achieve the goal. He has to collaborate with other departments such as analytics to get the job of extracting information from data.

Data analysis

Another vital responsibility of the data scientist is to assume the analytical role and build models and implement those models to solve issues that are best fit for the purpose. The data scientist has to resort to data mining, text mining techniques. Doing text mining with python course can really put you in an advantageous position when you actually get to handle complex dataset.

Developing strategies

The data scientists need to devote themselves to tasks like data cleaning, applying models, and wade through unstructured datasets to derive actionable insight in order to gauge the customer behavior, market trends. These insights help a business organization to decide its future course of action and also measure a product performance. A Data analyst training institute is the right place to pick up the skills required for performing such nuanced tasks.

Collaborating

Another vital task that a data scientist performs is collaborating with others such as stakeholders and data engineers, data analysts communicating with them in order to share their findings or, discussing certain issues. However, in order to communicate effectively the data scientists need to master the art of data visualization which they could learn while pursuing big data courses in delhi along with deep learning for computer vision course.  The key issue here is to make the presentation simple yet effective enough so that people from any background can understand it.

Data Science Machine Learning Certification

The above mentioned responsibilities of a data scientist just scratch the surface because, a data scientist’s job role cannot be limited by or, defined by a couple of tasks. The data scientist needs to be in synch with the implementation process to understand and analyze further how the data driven insight is shaping strategies and to which effect. Most importantly, they need to evaluate the current data infrastructure of the company and advise regarding future improvement. A data scientist needs to have a keen knowledge of Machine Learning Using Python, to be able to perform the complex tasks their job demands.


.

Data Science: What Are The Challenges?

Data Science: What Are The Challenges?

Big data is certainly is getting a lot of hype and for good reasons. Different sectors ranging from business to healthcare are intent on harnessing the power of data to find solutions to their most imminent problems. Huge investments are being made to build models, but, there are some niggling issues that are not being resolved.

So what are the big challenges the data science industry is facing?

Managing big data

Thanks to the explosion of information now the amount of data being created every year is adding to the already overstocked pile, and, most of the data we are talking about here is unstructured data.  So, handling such a massive amount of raw data that is not even in a particular database is a big challenge that could only be overcome by implementing advanced tools.

Lack of skilled personnel

 One of the biggest challenges the data science industry has to deal with is the shortage of skilled professionals that are well equipped with Data Science training. The companies need somebody with specific training to manage and process the datasets and present them with the insight which they can channelize to develop business strategies. Sending employees to a Data analyst training institute can help companies address the issue and they could also consider making additional efforts for retaining employees by offering them a higher remuneration.

Communication gap

One of the challenges that stand in the way, is the lack of understanding on the part of the data scientists involved in a project. They are in charge of sorting, cleaning, and processing data, but before they take up the responsibility they need to understand what is the goal that they are working towards. When they are working for a business organization they need to know what the set business objective is, before they start looking for patterns and build models.

Data integration

When we are talking about big data, we mean data pouring from various sources. The myriad sources could range from emails, documents, social media, and whatnot. In order to process, all of this data need to be combined, which can be a mammoth task in itself. Despite there being data integration tools available, the problem still persists.  Investment in developing smarter tools is the biggest requirement now.

Data security

Just the way integrating data coming from different sources is a big problem, likewise maintaining data security is another big challenge especially when interconnectivity among data sources exists. This poses a big risk and renders the data vulnerable to hacking. In the light of this problem, procuring permission for utilizing data from a source becomes a big issue. The solution lies in developing advanced machine learning algorithms to keep the hackers at bay.

Data Science Machine Learning Certification

Data validity

Gaining insight from data processing could only be possible when that data is free from any sort of error. However, sometimes data hailing from different sources could show disparity regardless of being about the same subject. Especially in healthcare, for example, patient data when coming from two different sources could often show dissimilarity. This poses a serious challenge and it could be considered an extension of the data integration issue.  Advanced technology coupled with the right policy changes need to be in place to address this issue, otherwise, it would continue to be a roadblock.

The challenges are there, but, recognizing those is as essential as continuing research work to finding solutions. Institutes are investing money in developing data science tools that could smoothen the process by eliminating the hurdles.  Accessing big data courses in delhi, is a good way to build a promising career in the field of data science, because despite there being challenges the field is full big opportunities.


.

A Quick Guide to Data Visualization

A Quick Guide to Data Visualization

The growing significance of big data and the insight it imparts is of utmost significance. Data scientists are working round the clock to process the massive amount of data generated every day. However, unless you have been through Data Science training, it would be impossible for you to grasp even an iota of what is being communicated through data.

The patterns, outliers every single important factor that emerged through decoding must be presented in a coherent format for the untrained eyes. Data visualization enables the researchers to present data findings visually via different techniques and tools to enable people to grasp that information easily.

Why data visualization is so vital?

The complicated nuances of data analysis is not easier for anybody to understand. As we humans are programmed to gravitate towards a visual representation of any information, it makes sense to convey the findings through charts, graphs, or, some other way. This way it takes only a couple of moments for the marketing heads to process what is the trend to watch out for. 

We are used to seeing and processing the information presented through bars and pie charts in company board meetings, people use these conventional models to represent company sales data.

It only makes sense to narrate what the scientists have gathered from analyzing complex raw data sets, via visual techniques to an audience who needs that information to form data-driven decisions for the future.

So what are the different formats and tools of data visualization?

Data visualization can take myriad forms which may vary in the format but, these all have one purpose to serve representing data in an easy to grasp manner. The data scientist must be able to choose the right technique to relate his data discovery which should not only enlighten the audience but, also entertain them.

The popular data visualization formats are as follows

Area Chart
Bubble Cloud/Chart
 Scatter Plot
Funnel Chart
Heat Map
The formats should be adopted in accordance with the information to be communicated

Data scientists also have access to smart visualization tools which are

  • Qlikview
  • Datawrapper
  • Sisense
  • FusionCharts
  • Plotly
  • Looker
  • Tableau

A data scientist must be familiar with the tools available and be able to decide on which suits his line of work better.

What are the advantages of data visualization?

Data visualization is a tricky process while ensuring that the audience does not fall asleep during a presentation, data scientists also need to identify the best visualization techniques, which they can learn during big data training in gurgaon to represent the relationship, comparison or, some other data dynamic.
If and when done right data visualization  has several benefits to offer

Enables efficient analysis of data

In business, efficient data interpretation can help companies understand trends. Data visualization allows them quickly identify and grasp the information regarding company performance hidden in the data and enables them to make necessary changes to the strategy.

Identify connections faster

While representing information regarding the operational issues of an organization,  data visualization technique can be of immense help as it allows to show connections among different data sets with more clarity. Thereby enabling the management to quickly identify the connecting factors. 

Better performance analysis

Using certain visualizing techniques it is easier to present a product or, customer-related data in a multi-dimensional manner. This could provide the marketing team with the insight to understand the obstacles they are facing. Such as the reaction of a certain demographic to a particular product, or, it could also be the demand for certain products in different areas.  They are able to act faster to solve the niggling issues this way.

Adopt the latest trends

 Data processing can quickly identify the emerging trends, and with the help of data visualization techniques, the findings could be quickly represented in an appealing manner to the team. The visual element can immediately communicate which trends are to watch out for and which might no longer work.

Data Science Machine Learning Certification

 Encourages interaction

Visual representation of data allows the strategists to not just look at numbers but, actually understand the story being told through the patterns. It encourages interaction and allows them to delve deeper into the patterns, instead of just merely looking at some numbers and making assumptions.

Data visualization is certainly aiding the businesses to gain an insight that was lost to them earlier. A data scientist needs to be familiar with the sophisticated data visualization tools and must strike a balance between the data and its representation. Identifying what is unimportant and which needs to be communicated as well as finding an engaging visual technique to quickly narrate the story is what makes him an asset for the company.  A premier Data analyst training institute can help hone the skills of an aspiring data scientist through carefully designed courses.


.

Bayesian Thinking & Its Underlying Principles

Bayesian Thinking & Its Underlying Principles

In the previous blog on Bayes’ Theorem, we left off at an interesting junction where we just touched upon the ideas on prior odds ratio, likelihood ratio and the resulting Posterior Odds Ratio. However, we didn’t go into much detail of what it means in real life scenarios and how should we use them.

In this blog, we will introduce the powerful concept of “Bayesian Thinking” and explain why it is so important. Bayesian Thinking is a practical application of the Bayes’ Theorem which can be used as a powerful decision-making tool too!

We’ll consider an example to understand how Bayesian Thinking is used to make sound decisions.

For the sake of simplicity, let’s imagine a management consultation firm hires only two types of employees. Let’s say, IT professionals and business consultants. You come across an employee of this firm, let’s call him Raj. You notice something about Raj instantly. Raj is shy. Now if you were asked to guess which type of employee Raj is what would be your guess?

If your guess is that Raj is an IT guy based on shyness as an attribute, then you have already fallen for one of the inherent cognitive biases. We’ll talk more about it later. But what if it can be proved Raj is actually twice as likely to be a Business Consultant?!

This is where Bayesian Thinking allows us to keep account of priors and likelihood information to predict a posterior probability.

The inherent cognitive bias you fell for is actually called – Base Rate Neglect. Base Rate Neglect occurs when we do not take into account the underlying proportion of a group in the population. Put it simply, what is the proportion of IT professionals to Business consultants in a business management firm? It would be fair to assume for every 1 IT professional, the firm hires 10 business consultants.

Another assumption could be made about shyness as an attribute. It would be fair to assume shyness is more common in IT professionals as compared to business consultants. Let’s assume, 75% of IT professionals are in fact shy corresponding to about 15% of business consultants.

Think of the proportion of employees in the firm as the prior odds. Now, think of the shyness as an attribute as the Likelihood. The figure below demonstrates when we take a product of the two, we get posterior odds.

Plugging in the values shows us that Raj is actually twice as likely to be a Business consultant. This proves to us that by applying Bayesian Thinking we can eliminate bias and make a sound judgment.

Now, it would be unrealistic for you to try drawing a diagram or quantifying assumptions in most of the cases. So, how do we learn to apply Bayesian Thinking without quantifying our assumptions? Turns out we could, if we understood what are the underlying principles of Bayesian Thinking are.

Principles of Bayesian Thinking

Rule 1 – Remember your priors!

As we saw earlier how easy it is to fall for the base rate neglect trap. The underlying proportion in the population is often times neglected and we as human beings have a tendency to just focus on just the attribute. Think of priors as the underlying or the background knowledge which is essentially an additional bit of information in addition to the likelihood. A product of the priors together with likelihood determines the posterior odds/probability.

Rule 2 – Question your existing belief

This is somewhat tricky and counter-intuitive to grasp but question your priors. Present yourself with a hypothesis what if your priors were irrelevant or even wrong? How will that affect your posterior probability? Would the new posterior probability be any different than the existing one if your priors are irrelevant or even wrong?

Rule 3 – Update incrementally

We live in a dynamic world where evidence and attributes are constantly shifting. While it is okay to believe in well-tested priors and likelihoods in the present moment. However, always question does my priors & likelihood still hold true today? In other words, update your beliefs incrementally as new information or evidence surfaces. A good example of this would be the shifting sentiments of the financial markets. What holds true today, may not tomorrow? Hence, the priors and likelihoods must also be incrementally updated.

Conclusion

In conclusion, Bayesian Thinking is a powerful tool to hone your judgment skills. Developing Bayesian Thinking essentially tells us what to believe in and how much confident you are about that belief. It also allows us to shift our existing beliefs in light of new information or as the evidence unfolds. Hopefully, you now have a better understanding of Bayesian Thinking and why is it so important.

On that note, we would like to say DexLab Analytics is a premium data analytics training institute located in the heart of Delhi NCR. We provide intensive training on a plethora of data-centric subjects, including data science, Python and credit risk analytics. Stay tuned for more such interesting blogs and updates!

About the Author: Nish Lau Bakshi is a professional data scientist with an actuarial background and a passion to use the power of statistics to tackle various pressing, daily life problems.


Interested in a career in Data Analyst?

To learn more about Data Analyst with Advanced excel course – Enrol Now.
To learn more about Data Analyst with R Course – Enrol Now.
To learn more about Big Data Course – Enrol Now.

To learn more about Machine Learning Using Python and Spark – Enrol Now.
To learn more about Data Analyst with SAS Course – Enrol Now.
To learn more about Data Analyst with Apache Spark Course – Enrol Now.
To learn more about Data Analyst with Market Risk Analytics and Modelling Course – Enrol Now.

The Almighty Central Limit Theorem

The Almighty Central Limit Theorem

The Central Limit Theorem (CLT) is perhaps one of the most important results in all of the statistics. In this blog, we will take a glance at why CLT is so special and how it works out in practice. Intuitive examples will be used to explain the underlying concepts of CLT.

First, let us take a look at why CLT is so significant. Firstly, CLT affords us the flexibility of not knowing the underlying distribution of any data set provided if the sample is large enough. Secondly, it enables us to make “Large sample inference” about the population parameters such as its mean and standard deviation.

The obvious question anybody would be asking themselves is why it is useful not to know the underlying distribution of a given data set?

To put it simply in real life, often times than not the population size of anything will be unknown. Population size here refers to the entire collection of something, like the exact number of cars in Gurgaon, NCR at any given day. It would be very cumbersome and expensive to get a true estimate of the population size. If the population size is unknown its underlying distribution will be known too and so will be its standard deviation. Here, CLT is used to approximate the underlying unknown distribution to a normal distribution. In a nutshell, we don’t have to worry about knowing the size of the population or its distribution. If the sample sizes are large enough, i.e. – we have a lot of observed data, it takes the shape of a symmetric bell-shaped curve. 

Now let’s talk about what we mean by “Large sample inference”. Imagine slicing up the data into ‘n’ number of samples as below:

Now, each of these samples will have a mean of their own.

Therefore, effectively the mean of each sample is a random variable which follows the below distribution:

Imagine, plotting each of the sample mean on a line plot, and as “n”, i.e. the number of samples goes to infinity or a large number the distribution takes a perfect bell-shaped curve, i.e – it tends to a normal distribution.

Large sample inferences could be drawn about the population from the above distribution of x̅. Say, if you’d like to know the probability that any given sample mean will not exceed quantity or limit.

The Central Limit Theorem has vast application in statistics which makes analyzing very large quantities easy through a large enough sample. Some of these we will meet in the subsequent blogs.

Try this for yourself: Imagine the average number of cars transiting from Gurgaon in any given week is normally distributed with the following parameter . A study was conducted which observed weekly car transition through Gurgaon for 4 weeks. What is the probability that in the 5th week number of cars transiting through Gurgaon will not exceed 113,000?

If you liked this blog, then do please leave a comment or suggestions below.

About the Author: Nish Lau Bakshi is a professional data scientist with an actuarial background and a passion to use the power of statistics to tackle various pressing, daily life problems.

About the Institute: DexLab Analytics is a premier data analytics training institute headquartered in Gurgaon. The expert consultants working here craft the most industry-relevant courses for interested candidates. Our technology-driven classrooms enhance the learning experience.


Interested in a career in Data Analyst?

To learn more about Data Analyst with Advanced excel course – Enrol Now.
To learn more about Data Analyst with R Course – Enrol Now.
To learn more about Big Data Course – Enrol Now.

To learn more about Machine Learning Using Python and Spark – Enrol Now.
To learn more about Data Analyst with SAS Course – Enrol Now.
To learn more about Data Analyst with Apache Spark Course – Enrol Now.
To learn more about Data Analyst with Market Risk Analytics and Modelling Course – Enrol Now.

Data Driven Projects: 3 Questions That You Need to Know

Data Driven Projects: 3 Questions That You Need to Know

Today, data is an asset. It’s a prized possession for companies – it helps derive crucial insights about customers, thus future business operations. It also boosts sales, predicts product development and optimizes delivery chains.

Nevertheless, several recent reports suggest that even though data floats around in abundance, a bulk of data-driven projects fail. In 2017 alone, Gartner highlighted 60% of big data projects fail – so what leads it? Why the availability of data still can’t ensure success of these projects?

2

Right data, do I have it?

It’s best to assume the data which you have is accurate. After all, organizations have been keeping data for years, and now it’s about time they start making sense out of it. The challenge that they come across is that this data might give crucial insights about past operations, but for present scenario, they might not be good enough.

To predict the future outcomes, you need fresh, real-time data. But do you know how to find it? This question leads us to the next sub-head.

Where to find relevant data?

Each and every company does have a database. In fact, many companies have built in data warehouses, which can be transformed into data lakes. With such vast data storehouses, finding data is no more a difficult task, or is it?

Gartner report shared, “Many of these companies have built these data lakes and stored a lot of data in them. But if you ask the companies how successful are you doing predictions on the data lake, you’re going to find lots and lots of struggle they’re having.”

Put simply, too many data storehouses may pose a challenge at times. The approach, ‘one destination for all data in the enterprise’ can be detrimental. Therefore, it’s necessary to look for data outside the data warehouses; third party sources can be helpful or even company’s partner network.

How to combine data together?

Siloed data can be calamitous. Unsurprisingly, data is available in all shapes and is derived from numerous sources – software applications, mobile phones, IoT sensors, social media platforms and lot more – compiling all the data sources and reconciling data to derive meaningful insights can thus be extremely difficult.

However, the problem isn’t about the lack of technology. A wide array of tools and software applications are available in the market that can speed up the process of data integration. The real challenge lies in understanding the crucial role of data integration. After all, funding an AI project is no big deal – but securing a budget to address the problem of data integration efficiently is a real challenge.

In a nutshell, however data sounds all promising, many organizations still don’t know how achieve full potential out of data analytics. They need to strengthen their data foundation, and make sure the data that is collected is accurate and pulled out from a relevant source.

A good data analyst course in Gurgaon can be of help! Several data analytics training institutes offer such in-demand skill training course, DexLab Analytics is one of them. For more information, visit their official site.

The blog has been sourced fromdataconomy.com/2018/10/three-questions-you-need-to-answer-to-succeed-in-data-driven-projects


Interested in a career in Data Analyst?

To learn more about Data Analyst with Advanced excel course – Enrol Now.
To learn more about Data Analyst with R Course – Enrol Now.
To learn more about Big Data Course – Enrol Now.

To learn more about Machine Learning Using Python and Spark – Enrol Now.
To learn more about Data Analyst with SAS Course – Enrol Now.
To learn more about Data Analyst with Apache Spark Course – Enrol Now.
To learn more about Data Analyst with Market Risk Analytics and Modelling Course – Enrol Now.

How Data Analytics Should Be Managed In Your Company, and Who Will Lead It?

How Data Analytics Should Be Managed In Your Company, and Who Will Lead It?

In the last couple of years, data management strategies have revolutionized a lot. Previously, the data management used to come under the purview of the IT department, while data analytics was performed based on business requirements. Today, a more centralized approach is being taken uniting the roles of data management and analytics – thanks to the growing prowess of predictive analytics!

Predictive analytics has brought in a significant change – it leverages data and extracts insights to enhance revenue and customer retention. However, many companies are yet to realize the power of predictive analytics. Unfortunately, data is still siloed in IT, and several departments still depend on basic calculations done by Excel.

But, of course, on a positive note, companies are shifting focus and trying to recognize the budding, robust technology. They are adopting predictive analytics and trying to leverage big data analytics. For that, they are appointing skilled data scientists, who possess the required know-how of statistical techniques and are strong on numbers.

2

Strategizing Analytical Campaigns

An enterprise-wide strategy is the key to accomplish analytical goals and how. Remember, the strategy should be encompassing and incorporate needful laws that need to be followed, like GDPR. This signifies effective data analytics strategies begin from the top.

C-suite is a priority for any company, especially which looks forward to defining data and analytics, but each company also require a designated person, who would act as a link between C-suite and the rest of the company. This is the best way to mitigate the wrong decisions and ineffective strategies that are made in silos within the organization.

Chief Data Officers, Chief Analytics Officers and Chief Technology Officers are some of the most popular new age job designations that have come up. Eminent personalities in these fetching positions play influential roles in strategizing and executing a successful corporate-level data analytics plan. The main objective of them is to provide analytical support to the business units, determine the impact of analytical strategies and ascertain and implement innovative analytical prospects.

Defensive Vs Offensive Data Strategy

To begin, defensive strategy deals with compliance with regulations, prevention of theft and fraud detection, while offensive strategy is about supporting business achievements and strategizing ways to enhance profitability, customer retention and revenue generation.

Generally, companies following a defensive data strategy operate across industries that are heavily regulated (for example, pharmaceuticals, automobile, etc.) – no doubt, they need more control on data. Thus, a well-devised data strategy has to ensure complete data security, optimize the process of data extraction and observe regulatory compliance.

On the other hand, offensive strategy requires more tactical implementation of data. Why? Because they perform in a more customer-oriented industry. Here, the analytics have to be more real-time and their numerical value will depend on how quickly they can arrive at decisions. Hence, it becomes a priority to equip the business units with analytical tools along with data. As a result, self-service BI tools turns out to be a fair deal. They are found useful. Some of the most common self-service BI vendors are Tableau and PowerBI. They are very easy to use and deliver the promises of flexibility, efficacy and user value.  

As final remarks, the sole responsibility of managing data analytics within an organization rests on a skilled team of software engineers, data analysts and data scientists. Only together, they would be able to take the charge of building successful analytical campaigns and secure the future of the company.

For R Predictive Modelling Certification, join DexLab Analytics. It’s a premier data science training platform that offers top of the line intensive courses for all data enthusiasts. For more details, visit their homepage.


The blog has been sourced from dataconomy.com/2018/09/who-should-own-data-analytics-in-your-company-and-why


Interested in a career in Data Analyst?

To learn more about Data Analyst with Advanced excel course – Enrol Now.
To learn more about Data Analyst with R Course – Enrol Now.
To learn more about Big Data Course – Enrol Now.

To learn more about Machine Learning Using Python and Spark – Enrol Now.
To learn more about Data Analyst with SAS Course – Enrol Now.
To learn more about Data Analyst with Apache Spark Course – Enrol Now.
To learn more about Data Analyst with Market Risk Analytics and Modelling Course – Enrol Now.

Top 5 Reasons to Feel Excited about Data Analytics This Year

TOP 5 REASONS TO FEEL EXCITED ABOUT DATA ANALYTICS THIS YEAR

‘Tis the year to be super excited about data analytics! Without further ado, let’s find out why:-

Cloud Infrastructure is Expanding and Fostering Fast-paced Innovations

Considering the recent trends in cloud data and related applications, 2018 is a critical time for cloud analytics. Businesses must steadily transition to a cloud environment and for that a robust and flexible analytics strategy is to be adopted. Through cloud analytics platforms businesses can leverage common data logic and unlock new analytic capabilities to plan, predict, discover, visualize, simulate and manage. In short, what businesses need is a hybrid mode that includes data, analytics and applications spread across multi-cloud and on-premise environments. Research suggests that by employing analytics that are built to work together businesses can increase the total cost of ownership (TCO) by 3-5 times and the return on investment (ROI) can be as high as 171%.

Source: ZDNet

The Power of Machine Learning Unleashed

Machine learning and artificial intelligence have made big progress in the last one year. Hence, automated and AI powered tools are becoming central in decision-making. The rapid growth in automation has profound effect on the way analytics is used. It can be said that machine learning is perking up analytics big time. With the help of automated technologies users can develop contextual insights with ease and uncover patterns from massive volumes of data. And data scientists are harnessing these automated technologies to drive scalable insights for smarter business processes.

Source: Tech Carpenter

The Spreadsheet is Nearing Retirement

The spreadsheet has come a long way since its inception. But, for many businesses it is time to move to better alternatives that are free from some of the inefficiencies and inaccuracies of spreadsheets. For these businesses the solution is shifting to cloud-based models that help connect operational plans to financial plans.

Source: GCN.com

Customer Experience is the Current Competitive Battleground

According to the Harris Interactive study, 88% customers prefer purchasing products or services from a company that offers great customer service over a company that provides the latest innovations. Quality customer experience is crucial for business growth. And for that companies must invest in CEM (customer experience management). CEM technology collects data from varied sources and uses advanced analytics to leverage historical experiences and access data fast. This platform ensures that customers are satisfied, their grievances are addressed and there’s an improvement in sales, profits and brand image.

Source: StoryMiners

Big data Industry to Grow 7 times in 7 years!

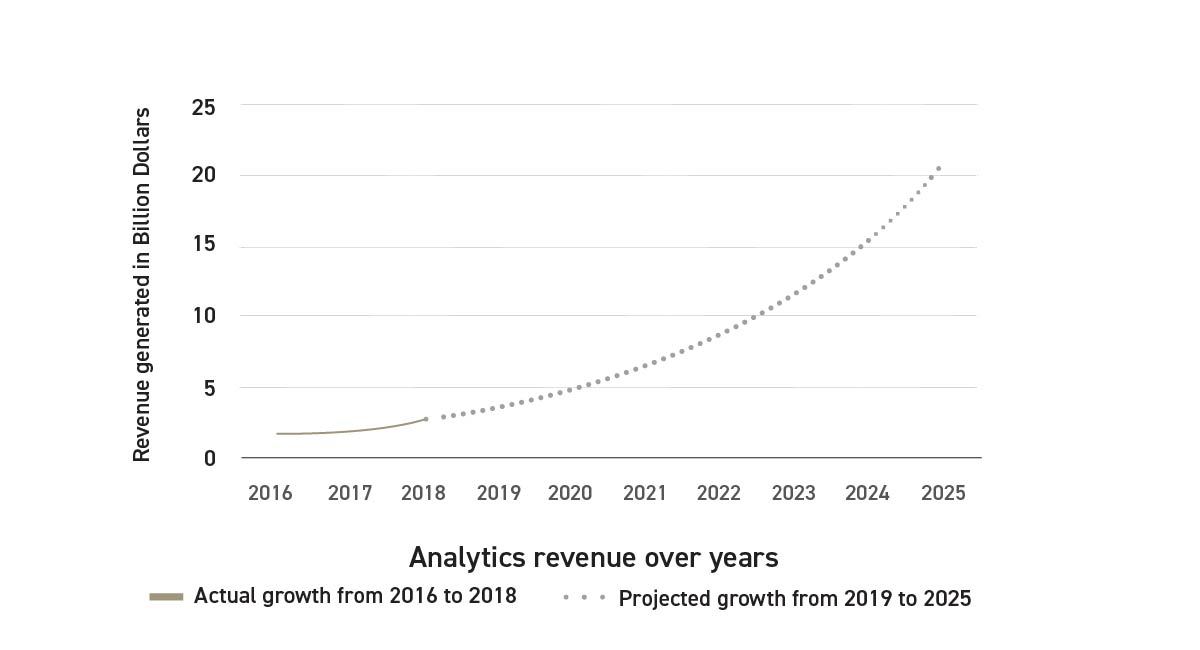
Studies suggest that the big data industry in India is likely to become a 20 billion dollar industry by 2015. It is expected that analytics and data science market will grow by 7 times in the next 7 years. Currently, the analytics and big data industry is worth an estimated $2.71 billion in annual revenues and is growing rapidly at a rate of 33.5% CAGR.

Source: Analytics India

Do you know that this year over 16,000 freshers have been hired in the analytics workforce of India? That’s an increase by 33% from last year’s 12,000! Join the big data bandwagon with a professional certificate from this reputed data analyst training institute in Delhi. One of the unique features of this data analyst course in Gurgaon is that it includes trainers who are industry-experts in this field and hence bring with them excellent domain experience.


References:

digitalistmag.com/cio-knowledge/2018/01/03/top-10-trends-for-analytics-in-2018-05668659

360logica.com/blog/10-reasons-excited-data-analytics-2018

analyticsindiamag.com/analytics-data-science-industry-in-india-study-2018-by-analytixlabs-aim

getcloudcherry.com/blog/competition-customer-experience


Interested in a career in Data Analyst?

To learn more about Data Analyst with Advanced excel course – Enrol Now.
To learn more about Data Analyst with R Course – Enrol Now.
To learn more about Big Data Course – Enrol Now.

To learn more about Machine Learning Using Python and Spark – Enrol Now.
To learn more about Data Analyst with SAS Course – Enrol Now.
To learn more about Data Analyst with Apache Spark Course – Enrol Now.
To learn more about Data Analyst with Market Risk Analytics and Modelling Course – Enrol Now.

Call us to know more