data analytics certification courses Archives - Page 7 of 8 - DexLab Analytics | Big Data Hadoop SAS R Analytics Predictive Modeling & Excel VBA

The role of Big Data Analytics in the World of Media and Entertainment

The role of Big Data Analytics in the World of Media and Entertainment

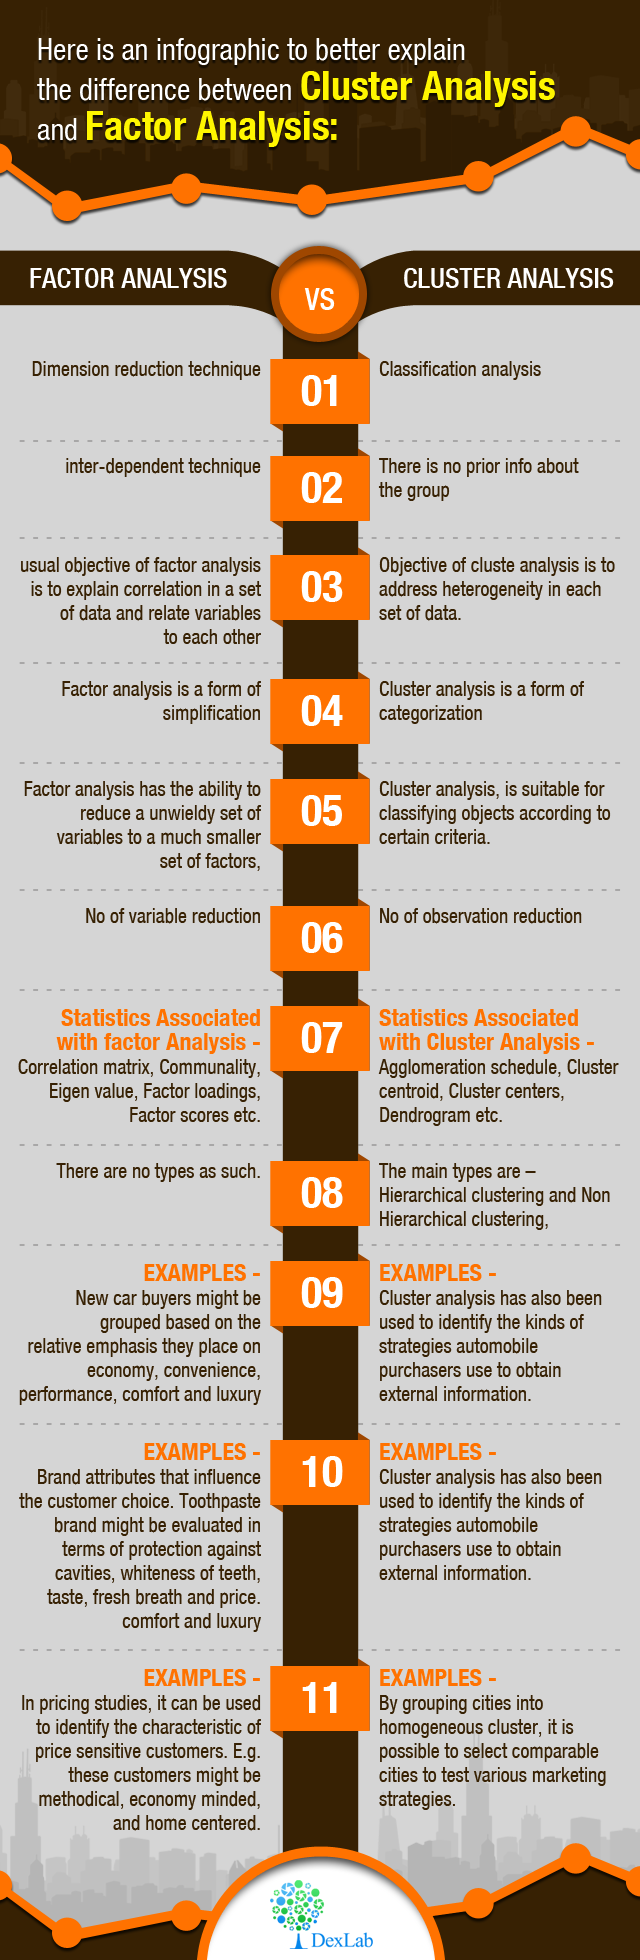
A reverberating revolution is on the go in the media industry. Reason: thorough digitization and data-driven marketing.

A seamless amalgamation between digital and analytical solutions is transforming versatile media platforms across the globe. Not only does it help in curating more personalized content for its niche audiences, but also bolsters newer capabilities, such as master data management for digital assets and improved customer engagement programs.

Is Big Data Big Enough?

Facebook gathers and processes more than 500 TB of data every day.

Google processes 3.5 billion requests every day.

Amazon records 152 million customer purchase data every day.

With the rise of digitization, media and entertainment companies are leveraging big data technology like no other for better customer engagement.

HeroBanner_MediaChoices605771740_789_433_70_s

Here are a few examples showing how media companies are using the power of big data:

In predicting audience preference

Large chunks of data helps in predicting and understanding the demand of audiences – right from the genre of shows and music they like to content selection for a given age group or for different channels.

Better acquisition and retention

Any day, big data help to fathom the reasons why consumers subscribe or unsubscribe a particular channel. It aids companies in developing robust promotional and product strategies to attract and retain more loyal user base. Social media data also lend a helping hand to enhance consumer interest.

Content revenue generation and new product development

With the power of accurate and productive data, media houses incentivize consumer behavior and while doing so, they understand the true market value of the content generated.

best-use-case-is-media-ent

How Media Uses Data Anaytics?

Netflix

Netflix assimilates large chunks of viewership data, with which it performs an in-depth analysis of viewer’s behavior for millions of viewings of shows. The analysts conduct thorough research on the attributes and qualities of data about consumers to know which show is the most popular. This analysis also helps them know how long viewers are watching a program or season or any individual show. Hence, in this way it outbids its competitors and owns rights to showcase blockbuster hits.

Bollywood

Talking about our very own Bollywood, SRK’s Chennai Express used big data and analytics to boost social media presence and digital marketing endeavors. And, no wonder, it smashed the box office records of 2013. It became such a raging success that the IT services company Persistent Systems released a statement saying, “Chennai Express related tweets generated over 1 billion cumulative impressions and the total number of tweets across all hashtags was over 750 thousand over the 90-day campaign period.”

This is a single instance. Many other bigwig producers have time and again collaborated with cutting edge big data analytics firms to better understand consumer trends and drive customer engagement.

ca37e02daa16a8fd68a0eebc491dfb1a

Conclusion

Big Data is a surefire boon for media and entertainment houses; it helps companies to solve crucial questions about consumers, things they like, content they feed in, and shows they treasure. Moreover, it aids in tracking clicks, shares and views across multiple devices and media platforms.

To lead the change, join DexLab Analytics. Their Data analyst course in Delhi NCR is surely worth taking up to fulfill all your divine career aspirations. Check out business analytics course itinerary now.


Interested in a career in Data Analyst?

To learn more about Data Analyst with Advanced excel course – Enrol Now.
To learn more about Data Analyst with R Course – Enrol Now.
To learn more about Big Data Course – Enrol Now.

To learn more about Machine Learning Using Python and Spark – Enrol Now.
To learn more about Data Analyst with SAS Course – Enrol Now.
To learn more about Data Analyst with Apache Spark Course – Enrol Now.
To learn more about Data Analyst with Market Risk Analytics and Modelling Course – Enrol Now.

Big Data, Hadoop and Cloud: The Looming Challenges and How to Peg Them?

Big Data, Hadoop and Cloud: The Looming Challenges and How to Peg Them?

Data is regarded as the “new oil” in the industry – though you can’t fill your car’s gas tank with binary digits, but yes, you can definitely think of driving an autonomous car with data. Self-driven cars are a reality now!

About 10 years ago, with the advent of big data hype, organizations, big and small joined the bandwagon involving data so as not to miss out the ‘next big thing’. The whole thing started with the ‘data land grab’ phase. Next came the delineation phase, in which industry started chalking out clearly big data boundaries and where it has to be applied. After this, we have moved into an efficiency phase – whereby we extract the maximum out of data by merging right expertise with the right technology.

Notwithstanding all the exciting stuffs surrounding big data, many challenges have even come out during the delineation phase and they still continue to cripple company functioning. So, here we will talk about the challenges faced and ways to tackle them…

2

Big Data Challenges

Now, it’s the time for humongous volumes of unstructured data – companies have as a result shifted their focus from traditional big data storage solutions to more agile, cost-efficient open source strategies like Spark and Hadoop. Navigating through a turbulent sea of big data tools is another daunting task in itself, so here we will address the issue of Hadoop challenges only.

Though Hadoop has solved a multitude of data problems, yet its implementation and management is a difficult task, and ends up causing more problems than doing good. Also, scaling Hadoop on premise is a taxing procedure, involving a lot more investment in physical infrastructure – for this, many companies are turning towards cloud-based Hadoop solutions because they are agile and less complicated to use.

Cloud Migration Challenges

Cloud-based solutions help companies maneuver in a more agile manner, while enhancing their data needs. This acts as a robust solution to the issue of adding more on-prem infrastructure over time, but as it’s said, there’s no gain without pain – migrating data analytics to a purely cloud infrastructure has its own cons.

The biggest challenges associated with cloud network are related to reliability, performance, scalability and accessibility of data. Data security also remains a matter of concern – a handful number of recent high-profile data breaches have made us vulnerable, while showing on our face how less protected we are in the digital world.

How To Tackle the Emerging Challenges?

Think beyond today! Companies need to make their headstrong big data solutions future proofed, because no one likes to do the same thing again and again in a time span of two-three years. If you are incorporating steady solutions today, make sure they stay in practice for the coming 5-10 years or so.

As we have mentioned earlier, Hadoop implementation and management is not as easy as it sounds, and gaining access to a deft pool of experts who understands the intricacies of Hadoop has become the need of the hour. This means, make sure you choose the right internal talent pool and work with uber talented experts.

Now, when it comes to ensuring data security over cloud infrastructure, make sure you think beyond the perimeter security, focus on identifying sensitive data, both structured and unstructured and then secure it in a Hadoop lake just the way it’s ingested. This will help you closely monitor cloud data sources and check violations right from the start.

Join DexLab Analytics data analyst certification and stand a chance of making a successful career as a data scientist. After all, enrolling in India’s best data analyst training institute in Delhi NCR will surely help you master the art of data science.


Interested in a career in Data Analyst?

To learn more about Data Analyst with Advanced excel course – Enrol Now.
To learn more about Data Analyst with R Course – Enrol Now.
To learn more about Big Data Course – Enrol Now.

To learn more about Machine Learning Using Python and Spark – Enrol Now.
To learn more about Data Analyst with SAS Course – Enrol Now.
To learn more about Data Analyst with Apache Spark Course – Enrol Now.
To learn more about Data Analyst with Market Risk Analytics and Modelling Course – Enrol Now.

3 Ways to Increase ROI with Data Science

3 Ways to Increase ROI with Data Science

In 2018, companies have decided to invest $3.7 trillion on machine learning and digital transformation so as to embrace a promising return on that sizeable investment for professionals involved in managerial roles. Nevertheless, 31% of the companies using the potent tools of machine learning and data science are not yet tracking their ROI or are in no mood to do so in the near future.

But to be on the side, ROI is very crucial for any business success – if you fail to see the ROI you expect from data science implementation, look into bigger and complex processes at work – and adjust likewise.

2

Take cues from these 3 ways, explained below:

Implementing data science strategy into C-Suite

According to Gartner, by next year 90% of big companies would hire a Chief Data Officer, a promising role that was almost nonexistent a few years ago. Of late, the term C-Suite is gaining a lot of importance – but what does it mean? C-Suite basically gets its name from a series of titles of top level executives who job profile name starts with the letter C, like Chief Executive Officer, Chief Financial Officer, Chief Operating Officer and Chief Information Officer. The recent addition of CDO to the C-Suite has been channelized to develop a holistic strategy towards managing data and unveil new trends and opportunities that the company has been attempted to tab for years.

The core responsibility of a CDO is to address a proper data management strategy and then decode it into simple, implementable steps for business operations. Its prime time to integrate data science into bigger processes of business, and soon company heads are realizing this fact and working towards it.

Your time and resources are valuable, don’t waste them

Before formulating any strategy, CDOs need to ensure the pool of professionals working with data have proper access to the desired data tools and support or not. One common problem that persists is that the data science work that takes place within an organization is done on silo, and therefore remains lost or underutilized. This needs to be worked out.

Also, besides giving special attention on transparency, data science software platforms are working towards standardizing data scientists’ efforts by limiting their resources for a given project, thereby ensuing cost savings. In this era of digitization, once you start managing your data science teams efficiently, half the battle is won then and there.

Stay committed to success

Implementing a sophisticated data science model into production process can be a challenging, lengthy and expensive process. Any kind of big, complicated project will take years to get completed but once they do, you expect to see the ROI you desire from data science but the journey might not be all doodle. It will have its own ups and downs, but if you stay committed and deploy the right tools of technology, better outcome is meant to happen.

In a nutshell, boosting of ROI is crucial for business success but the best way to trigger it would be by getting a bird’s eye view of your data science strategy, which will help in predicting success accurately and thus help taking ROI-supported decisions.

If you are looking for a good data analyst training institute in Delhi NCR, end your search with DexLab Analytics. Their data analyst certification is student-friendly and right on the point.


Interested in a career in Data Analyst?

To learn more about Data Analyst with Advanced excel course – Enrol Now.
To learn more about Data Analyst with R Course – Enrol Now.
To learn more about Big Data Course – Enrol Now.

To learn more about Machine Learning Using Python and Spark – Enrol Now.
To learn more about Data Analyst with SAS Course – Enrol Now.
To learn more about Data Analyst with Apache Spark Course – Enrol Now.
To learn more about Data Analyst with Market Risk Analytics and Modelling Course – Enrol Now.

It’s Time to Upgrade Tableau with Hyper

On 10th January, 2018 Tableau 10.5 was launched!

 
It’s Time to Upgrade Tableau with Hyper
 

Once you upgrade yourself to Tableau’s latest version, you will automatically get access to Hyper, Tableau’s new, licensed data engine technology. Hyper harbors the cutting edge technology to deliver up to 3x enhanced extract creation speed and up to 5x improved query performance.

Continue reading “It’s Time to Upgrade Tableau with Hyper”

Demystifying Tableau Jargons: Interact With Data like Never Before

Demystifying Tableau Jargons: Interact With Data like Never Before

Businesses are flourishing. Managerial data are in abundance. The need for efficient BI softwares is at the pinnacle. Structured BI softwares are nimble and up to the minute. Tableau is one such BI tool, which is not only simple and comprehensible, but also extremely purposeful, enough to fulfil high-end professional commitments. It works just the way you want it to, instruct it in a particular way and wait for the results, without compromising the security of various confidential data.</span

Here in this FAQ blog, we have pulled out some of the top of the line frequently asked queries, regarding Tableau and R Programming. Both are highly functional, user friendly and efficient. Scroll down to grasp the basics and decode the fundamentals of Tableau.

Also read: Most Commonly Asked Tableau Interview Questions

What is Tableau?

Tableau is one of the finest data visualization tools that empower the enterprises to represent the data in the most flawless and explicit manner. It has proved its worth by being at par with its dominant predecessors, who analysed data visually and ruled the market for long.

How Tableau is classified?

Tableau can be classified as follows:

  • Tableau Desktop
  • Tableau Server
  • Tableau Online

What makes Tableau so popular?

With superb visualizations at an affordable price, Tableau is unrivalled. It can easily connect to any database – you don’t have to plug-in and is equipped with a robust memory processing.

Also read: Power BI or Tableau? Which is Better and Why?

Can we use precompiled models, packages, etc. with Tableau and R?

The answer is YES. If you can do it with R, you can easily incorporate it with Tableau. It includes any parallel computing modules, packages, libraries and statistical packages. It also involves commercialized versions of R, including Revolution Analytics.

Also read: How to Connect Oracle BI Server with Tableau

While you integrate Tableau and R, what is the best measure to debug R scripts or discover errors?

This is a vital question. There are mainly two ways. The first way to do this is by using ‘write.csv’ command within the studied field that calls an R script. The second one considers the use of debug version of the unparalleled executable of Rserve (Rserve_d.exe), which is ideal to print out any code that R is performing, and will be called R scripts.

Also read: Are You Trying to Ace Your Tableau Interview?

Can R be used to reshape data?

Yes, R possesses the ability of reshaping data.

Can data be transferred from a relational database to R, using Tableau?

Well, yes. Tableau can transfer data from any given source and run R scripts on that particular data set, irrespective of data type – be it relational database, flat-file, cube or unstructured.

2

What is Tableau Reader?

Tableau Reader is an effective tool to open the .twbx(Tableau packaged Workbook) files. However, keep in mind, it can only open files and cannot develop new connections and workbooks.

What do you mean by Tableau Public?

Tableau Public is a fantastic tool for anyone who wants to share his interesting stories on the web with others. You will gain access to data, develop interactive data visualizations and publish them on your website for others to see. And all of this, without writing a single line of code.

As parting thoughts, if you want to make something promising out of your mundane organisational data or want to make your frantic schedule of data handling and management a bit easier and enjoyable, then surely Tableau certification Gurgaon will work wonders for you! Contact us at DexLab Analytics, the pioneering data science online learning institute. We will be happy to help you.


Interested in a career in Data Analyst?

To learn more about Machine Learning Using Python and Spark – click here.
To learn more about Data Analyst with Advanced excel course – click here.
To learn more about Data Analyst with SAS Course – click here.
To learn more about Data Analyst with R Course – click here.
To learn more about Big Data Course – click here.

Understanding the Difference Between Factor and Cluster Analysis

Understanding the Difference Between Factor and Cluster Analysis

Cluster analysis and factor analysis are two different statistical methods in data analytics which are used heavily in analytical methods of subjects like natural sciences and behavioural sciences. The names of these analytical methods are so because both these methods allow the users to divide the data into either clusters or into factors.

Most newly established data analysts have this common confusion that both these methods are almost similar. But while these two methods may look similar on the surface but they differ in several ways including their applications and objectives.

Difference in objectives between cluster analysis and factor analysis:

One key difference between cluster analysis and factor analysis is the fact that they have distinguished objectives. For factor analysis the usual objective is to explain the correlation with a data set and understand how the variables relate to each other. But on the other hand the objective of cluster analysis is to address the heterogeneity in the individual data sets.

Put in simpler words the spirit of cluster analysis is to help in categorization but that of factor analysis are a form of simplification.

Data Science Machine Learning Certification

Difference is solutions:

This is not an easy section for drawing a line of separation in between cluster and factor analysis. That is because the results or solutions obtainable from both these analysis is subjective to their application. But still one could say that with factor analysis provides in a way the ‘best’ solutions to the researcher. This best solution is in the sense that the researcher can optimize a certain aspect of the solution this is known as orthogonality which offers ease of interpretation for the analysts.

But in case of cluster analysis this is not the case. The reasons behind that being all algorithms which can yield the best solutions for cluster analysis are usually computationally incompetent. Thus, researchers cannot trust this method of cluster analysis as it does not guarantee an optimal solution.

Difference in applications:

Cluster analysis and factor analysis differ in how they are applied to data, especially when it comes to applying them to real data. This is because factor analysis can reduce the unwieldy variables sets and boil them down to a smaller set of factors. This makes it suitable for simplifying otherwise complex models of analysis. Moreover, factor analysis also comes with a sort of confirmatory use researchers can use this method to develop a set of hypotheses based on how the variables in the data set are related.  After that the researcher can run a factor analysis to further confirm these hypotheses.

But cluster analysis on the other hand is suitable only for categorizing objects as per certain predetermined criteria. In cluster analysis a researcher can measure selected aspects of say a group of newly discovered plants and then place these plants into categories of species grouped by employing cluster analysis.

Here is an infographic to better explain the difference between cluster analysis and factor analysis: 


Interested in a career in Data Analyst?

To learn more about Data Analyst with Advanced excel course – Enrol Now.
To learn more about Data Analyst with R Course – Enrol Now.
To learn more about Big Data Course – Enrol Now.

To learn more about Machine Learning Using Python and Spark – Enrol Now.
To learn more about Data Analyst with SAS Course – Enrol Now.
To learn more about Data Analyst with Apache Spark Course – Enrol Now.
To learn more about Data Analyst with Market Risk Analytics and Modelling Course – Enrol Now.

Interesting Statistics of Employment: 5 Figures

Interesting Statistics of Employment: 5 Figures

It is a common sight to see the old and young talking about the job market that is going through a slump, regardless of the time or the economic conditions of the country; this picture usually is accompanied with some “cutting chai” at tea stalls on busy streets or cool cafes at the malls with the slurp of espresso with a tiny straw where the average upper-middle class youth talk about their first-world dreams while breathing progressive third-world air.

But is that really always the case? Data management or statistical analysis as we have established several times before, is sending the job market into hyper-drive, attracting millions of MNCs into the Indian soil and populating the job search portals with millions of opportunities in data.  But dare we only make statements, we are statisticians and we know that numbers do speak louder than simple statements.

So, in keeping with our love for figures and facts backed by data, DexLab Analytics has compiled a list of interesting statistics about the job market and the process of hiring.

#1 Each and every major corporate job position attracts a minimum of 250 applications!

Out of all these applications only 4 to 6 resumes get shortlisted and are called for interviews. Out of these 4 to 6 people only 1 lucky candidate is selected.

#2 Every job seeker takes into account 5 factors before accepting the position at a firm.

They are –

  • The company culture, values and overall work environment
  • Distance, ease of commute, location
  • Prospects of maintaining work/life balance
  • Growth prospects in career and
  • Pay package and compensation.

#3 Almost 94 percent of sales personnel revealed that base salary is the most important determining factor in the compensation package for them.

But 62 percent of sales personnel say that commission is the most important element.

#4 Out of 3 employees at least 2 say that most employers do not do or do not know how to use social media platforms for promoting job openings.

And 3 out of 4 employees also believe that most companies and employers do not know how to promote their brand on social media networks as well.

#5 Social media platforms are used to search for jobs by 79 percent of jobseekers.

This figure rises to 86 percent for younger job seekers who are in their initial 10 years of job search.

To learn more about statistical analysis and for Data analyst certification in Gurgaon drop by our website at DexLab Analytics.


Interested in a career in Data Analyst?

To learn more about Data Analyst with Advanced excel course – Enrol Now.
To learn more about Data Analyst with R Course – Enrol Now.
To learn more about Big Data Course – Enrol Now.

To learn more about Machine Learning Using Python and Spark – Enrol Now.
To learn more about Data Analyst with SAS Course – Enrol Now.
To learn more about Data Analyst with Apache Spark Course – Enrol Now.
To learn more about Data Analyst with Market Risk Analytics and Modelling Course – Enrol Now.

Data analysis resources to keep you updated

Data analysis resources to keep you updated

One should always be proactive about building upon what they already know and have learnt, and with explosion of the web such resources can be obtained fairly easily. The problem is not the availability of resources but the abundance from it. Due to the availability of too many choices it often becomes difficult to gauge if the sources are actually authentic.

2

So, here is a list of books, websites and other resources which we think are authentic:

To stay on top of the latest trends and analyses reports and what’s new in the realm of analytics here are the best latest blogs:

  • FiveThirtyEight: the main man behind this blog is Nate Silver, a data whiz kid, this blog is the place to find out data analysis and visualizations of political, economic and cultural issues. The content in his blogs are usually light-hearted and interactive yet pointed with illustrative examples of data can be used in day-to-day activities.
  • Flowing Data: this is an interesting blog where Dr. Nathan Yau, PhD reveals how the data personnel – like designers, analysts, scientists and statisticians can analyze and visualize data to gather a better understanding of the world around us. It is especially fun to read as Yau offers a funny approach about the regular challenges faced by a data professional in this field. One can also find job recommendations, tutorials and other resources in this blog.
  • Simply statistics: this is another blog that is managed by expert professors each from Ivy League colleges like Johns Hopkins University, Harvard University and the Dana Ferber Cancer Institute. These professors also talk about how data is being used or misused around the world in different industries.
  • Hunch: this blog has been created by John Langford from Microsoft Research, he is the doctor of learning there and his blog talks about machine learning basics of what we know and how we use what we know. This is a good read for those who are new in the field of machine learning and do not yet know how things work in machine learning as it provides an in-depth view of new ideas and events going on in this industry.

To connect to other fellow data scientists and analysts to inquire about questions that may arise while you try the tread the treacherous roads of the data world, these are few communities of data analysts you can follow.

    1. Kaggle competitions: this is a popular community that all data scientists are likely to come across. This is a platform where one can find data prediction competitors. This is a platform where one can search for upcoming competitions in data analysis the website also features a forum where a visitor can ask any question or find a partner for the competition, share resources and ask for support to make a good career in data science.
    2. Metaoptimize: this is a question and answer community for people who are into machine learning, natural language processing, data mining and more. Badges are awarded as per votes on questions are awarded. Thus, making it becomes simpler for the visitors to discover the most popular helpful answers to the questions.
    3. Datatau: this website is best described as hacker news for data scientists and it lives up to this description to the last word. People share career advice with each other; interesting articles are shared amongst the users and then commented upon also the people here share useful information to those new to the world of data analytics.
    4. DexLab Analytics blogs: while DexLab Analytics is one of the leading data analytics training institute in Gurgaon, but they maintain regular blogs about the latest developments in the field of data science and provide India-specific as well global data related news. For students pursuing or aspiring to pursue a career in data science must follow the daily posts from this institute.

In conclusion we would like to add that while there are several resources from where one can obtain valuable information about data analysis. Thus, keeping this list as a starting point you can find several other experts out there to help you learn more about data analytics.


Interested in a career in Data Analyst?

To learn more about Data Analyst with Advanced excel course – Enrol Now.
To learn more about Data Analyst with R Course – Enrol Now.
To learn more about Big Data Course – Enrol Now.

To learn more about Machine Learning Using Python and Spark – Enrol Now.
To learn more about Data Analyst with SAS Course – Enrol Now.
To learn more about Data Analyst with Apache Spark Course – Enrol Now.
To learn more about Data Analyst with Market Risk Analytics and Modelling Course – Enrol Now.

Measuring Why Correlation does not Causation

How about we first examine the thought of the connection and its application in the process of data analysis? Connection analysis is being utilized to distinguish or evaluate the relationship between two quantitative variables. The existence of variables should be between either dependent or free variable. To quantify between the reaction and indicator variable ‘r’ is used, which is the Connection Coefficient. The connection coefficient’s indication shows the affiliation’s bearing. The bearing should be either positive affiliation or negative affiliation. For instance, a connection of r = 0.95 demonstrates an in number, positive relationship between the two variables. Then again, if a relationship r = – 0.3 demonstrates a powerless, negative relationship between the two variables. The size of the relationship coefficient demonstrates the affiliation’s quality. In connection analysis, we can fall upon just four situations of affiliation.

qualitative

Situation 1 – The two variables have an in-number positive connection where r = 0.9

Situation 2 – The two variables have a powerless relationship where r = 0.3

Situation 3 – The two variables do not have any connection where r = 0

Situation 4 – The two variables have an in-number negative connection where r = – 0.9

Utilization of Case Correlation:

Promotion supervisor needs to distinguish the discriminating variable that is influencing the Conversion Rate of a site.

Business administrators need to discover whether the web journal redesign, identified with free arrival of online games, is creating the extra offer of income on the agreed day.

DayVisitors – Free Online Games Release UpdateRevenue
1180001500
2120001200
3150001600
410000900
58000950
6140001300
7120001100
8160001650
9100001050
10200001600

You may utilize excel function CORREL () in order to recognize the connection coefficient to quantify the relationship between the guests and the income. The relationship coefficient r for the aforementioned set of data is 0.90. It demonstrates that there is a solid relationship between the variable guests and income. Another flawless case for an in-number negative relationship is that at whatever point the precipitation diminishes, the horticulture’s yield diminishes. The relationship analysis likewise serves to further develop the analysis in multivariate insights.


Connection does not infer Causation:

This happens as soon as you attempt to discover the relationship between two autonomous variables or between an indigent variable and free variable. Association does not infer Causation implies those occasions that take place to correspond with one another – are not as a matter essentially related in a causal manner. This might be passed on that the variable X does not have an impact on the variable Y. It’s only an occurrence. We need to further accept or make it a theory that X is bringing about the impact on the Y variable. In the aforementioned utilization case, we discovered that the connection coefficient was at 0.89. It just demonstrates that there is a solid relationship between our Y Variable income and the X variable guests. Nonetheless, we don’t have any verification that if there is an expansion in the guests then the income additionally increments. No circumstances and end results is oblique here.

Call us to know more