Data analyst interview Archives - DexLab Analytics | Big Data Hadoop SAS R Analytics Predictive Modeling & Excel VBA

Best Data Science Interview Questions to Get Hired Right Away

Best Data Science Interview Questions to Get Hired Right Away

Data scientists are big data ninjas. They tackle colossal amounts of messy data, and utilize their imposing skills in statistics, mathematics and programming to collect, manage and analyze data. Next, they combine all their analytic abilities – including, industry expertise, encompassing knowledge and skepticism to unravel integral business solutions of meaningful challenges.

But how do you think they become such competent data wranglers? Years of experience or substantial pool of knowledge, or both? In this blog, we have penned down the most important interview data questions on data science – it will only aid you crack tough job interviews but also will test your knowledge about this promising field of study.

2

DexLab Analytics offers incredible Data Science Courses in Delhi. Start learning from the experts!

What do you mean by data science?

Data is a fine blend of statistics, technical expertise and business acumen. Together they are used to analyze datasets and predict the future trend.

Which is more appropriate for text analytics – R or Python?

Python includes a very versatile library, known as Pandas, which helps analysts use advanced level of data analysis tools and data structures. R doesn’t have such a feature. Therefore, Python is the one that’s highly suitable for text analytics.

Explain a Recommender System.

Today, a recommender system is extensively deployed across multiple fields – be it music recommendations, movie preferences, search queries, social tags, research and analysis – the recommender system works on a person’s past to build a model to predict future buying or movie-viewing or reading pattern in the individual.

What are the advantages of R?

  • A wide assortment of tools available for data analysis
  • Perform robust calculations on matrix and array
  • A well-developed yet simple programming language is R
  • It supports an encompassing set of machine learning applications
  • It poses as a middleman between numerous tools, software and datasets
  • Helps in developing ace reproducible analysis
  • Offers a powerful package ecosystem for versatile needs
  • Ideal for solving complex data-oriented challenges

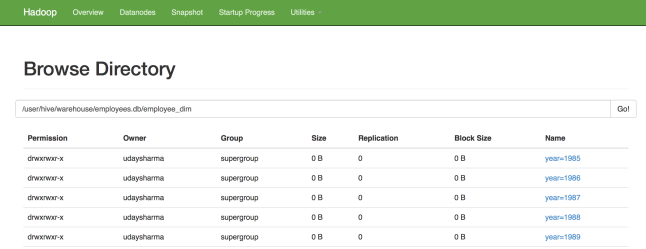
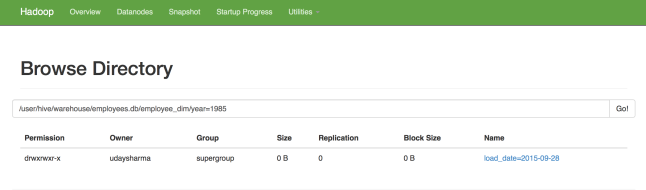
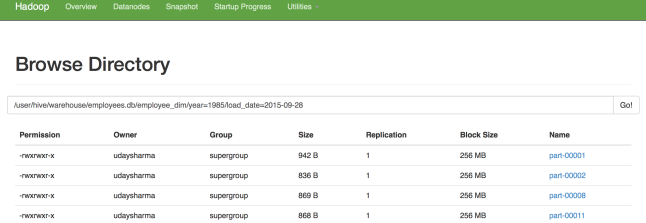
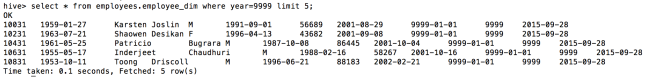
What are the two big components of Big Data Hadoop framework?

HDFS – It is the abbreviated form of Hadoop Distributed File System. It’s the distributed database that functions over Hadoop. It stores and retrieves vast amounts of data in no time.

YARN – Stands for Yet Another Resource Negotiator. It aims to allocate resources dynamically and manage workloads.

How do you define logistic regression?

Logistic regression is nothing but a statistical technique that analyzes a dataset and forecasts significant binary outcomes. The outcome has to be in either zero or one or a yes or no.

How machine learning is used in real-life?

Following are the real-life scenarios where machine learning is used extensively:

  • Robotics
  • Finance
  • Healthcare
  • Social media
  • Ecommerce
  • Search engine
  • Information sharing
  • Medicine

What do you mean by Power Analysis?

Power analysis is best defined as the process of determining sample size required for determining an impact of a given size from a cause coupled with a certain level of assurance. It helps you understand the sample size estimate and in the process aids you in making good statistical judgments.

To get an in-depth understanding on data science, enroll for our intensive Data Science Certification – the course curriculum is industry-standard, backed by guaranteed placement assistance.

The blog has been sourced fromintellipaat.com/interview-question/data-science-interview-questions

Interested in a career in Data Analyst?

To learn more about Data Analyst with Advanced excel course – Enrol Now.
To learn more about Data Analyst with R Course – Enrol Now.
To learn more about Big Data Course – Enrol Now.

To learn more about Machine Learning Using Python and Spark – Enrol Now.
To learn more about Data Analyst with SAS Course – Enrol Now.
To learn more about Data Analyst with Apache Spark Course – Enrol Now.
To learn more about Data Analyst with Market Risk Analytics and Modelling Course – Enrol Now.

Evolving Logistics Scenario: The Tech-driven Future of Logistics Industry

Customer expectations are growing by the day; they are demanding faster and more flexible deliveries at minimum delivery costs. Businesses are being pressurized to customize their manufacturing processes as per customer demands. This is a hard slog for the logistics industry, which has to keep delivering better services but for lower prices.

The logistics industry can only achieve this through ‘digital fitness’. It has to make intelligent use of the global wave of digitization, including data analytics, automation and ‘Physical Internet’. The Physical Internet is an open global logistics system that is transforming the way physical objects are handled, moved, stored and supplied. It aims towards the replacement of current logistical models and making global logistics more efficient and sustainable. The Physical Internet promises better standardization in logistics operations, including shipment sizes, labeling and systems.

The central theme in logistics sector is collaborative working, which enables market leaders to retain dominance.

Now, let us take a look at a few tech-driven domains that will shape the future of logistics.


The future of Logistics Lies in IoT

Internet of Things has been the most innovative technology of the present era. It has the potential to revolutionize the logistics sector. The key benefits of IoT with regard to logistics are:

  • Real-time alerts and notifications
  • Automate processes that gather data from various machines
  • Automate vital operations like inventory management and asset tracking: With the help of IoT, companies can improve tasks like tracking orders, determining what items need to be stocked up and how certain products are performing.
  • Able to function without any human interventions.
  • Logistic companies can provide safer deliveries
  • Enable the regulation of temperature and other environmental factors.

IoT will be advantageous for the entire logistics sector, including fleet and warehouse management, and shipment and delivery of products. IoT can help companies dealing with cargo shipments by improving visibility in the delivery and tracking of cargo.

Warehouse Automation

Warehouse automation is set for a major overhaul. Online shopping is thriving and logistics, especially warehouse operations, need to be more refined and speedy. Warehouse operations of many e-commerce giants are undergoing a robotics makeover. According to reports, the market for logistics robotics, which had generated revenues worth 1.9 billion USD in 2016, is likely to generate sky-high revenues worth 22.4 billion USD this year.

The advancements in robotics include programming robots to pick and pack goods, load and unload cargo and at times deliver goods too. Employing robots speed up the processes of data collection, maintaining records and managing inventories.  Most importantly, robots leave no room for human errors in the processes.


Blockchain Technology in Logistics

The growth of crypto-currencies like Bitcoin has popularized blockchain technology. Blockchain being a type of distributed ledger technology provides secure, traceable and transparent transactions. Blockchain technology employed by logistics firms will improve customer visibility into shipments and help prevent data breaches.

In the present times, logistics is considered the backbone of a stable economy. Thus, for India to emerge as a superpower, the logistics market needs to be developed and integrated with state-of-the-art technologies. Conducive policies and a healthy partnership between private and public sector is crucial to steer India into an era of competent and cost-effective business operations.

In times to come, automation will transform every industry. Don’t be left behind. Get an edge by enrolling for the data science and machine learning certification course at the premier data analyst training institute in DelhiDexlab Analytics.


Interested in a career in Data Analyst?

To learn more about Data Analyst with Advanced excel course – Enrol Now.
To learn more about Data Analyst with R Course – Enrol Now.
To learn more about Big Data Course – Enrol Now.

To learn more about Machine Learning Using Python and Spark – Enrol Now.
To learn more about Data Analyst with SAS Course – Enrol Now.
To learn more about Data Analyst with Apache Spark Course – Enrol Now.
To learn more about Data Analyst with Market Risk Analytics and Modelling Course – Enrol Now.

Watch Out: Top Retail Trends 2018 That Might Redefine Industry Goals

They must change – retailers finally understood this basic but true fact. For years, the retail honchos were averse to change – they preferred everything to be smooth and consistent like they were in previous years.

Watch Out: Top Retail Trends 2018 That Might Redefine Industry Goals

Now, the retail game-play is changing altogether. Today, it’s the customer who defines the entire shopping experience. No longer, storing data in traditional silos is termed as a viable option – the integration of omni-channel trade and tech-inspired merchandizing is the go-to option. Already, several well-funded retailers and global store giants are on their way to exploit the data power – they are adjusting their working mechanisms and resorting to assortment and innovations because that’s the only way to survive and sail away!

Looking ahead, here are some of the biggest retail trends to watch in 2018:

A dramatic evolution in technology

Technological transformation holds a fresh can of possibilities for retailers, but its implementation demands a lot of attention. While 2017 was reckoned to be the year of digital discovery, 2018 is going to be the year when retailers will adapt with the changing market and experience evolution in their customer’s needs. Hence, evolution will be the key to success.

Opportunities in AI are also on the rise. Chatbots, robotics and facial recognition and image recognition technologies are unleashing robust opportunities this year. Retailers are hoarding large chunks of data to curate personalized experiences for customers, and win their hearts away. More data means improved algorithm performance, and the best thing is that retailers are going on generating significant amounts of data, through both offline and online mediums. Artificial intelligence in retail can be utilized in many ways, right from improving product specifications and enhancing customer service experience.

Artificial intelligence coupled with machine learning and Internet of Things supports customer experience – there exists amazing opportunity for retailers to gain by using these new age concepts. For better data utilization, get yourself an excellent data analyst training from DexLab Analytics.

Mobile payments will usher us into a cashless economy

China has already gone cashless; thanks to AliPay and WeChat Pay. Following that, the rest of the world is looking up to the likes of Amazon Pay, Walmart Pay, Apple Pay and other types of cryptocurrencies. It’s only a matter of time before global consumers replace their plastic debit cards with more efficient and faster mobile payment options.

Work on improving offline experiences too

Not only online, but retailers should consider looking into offline experiences – how they can keep shopping as human, real and visual as possible. The mode of shopping might be transforming, but humans and their preferences are still the same. Customer experience is still important and offline experience will just focus on that.

Robotic retail is scaling up

In the E-commerce industry, the robot to human ratio is fast changing. While Walmart is testing retail robots, drone delivery is increasingly becoming popular and a viable solution. By 2020, its predicted consumer facing robots will show up in retail stores, all over.

2

Improvements in technology mean a lot of retail growth. And when its technology, we can’t leave behind DATA. It’s like the new currency in the retail scenario – for a comprehensive Retail Analytics Courses, visit DexLab Analytics.

The article has been sourced from:

https://www.forbes.com/sites/pamdanziger/2017/12/27/retail-shopping-predictions-2018/#1116fcdafb33


Interested in a career in Data Analyst?

To learn more about Machine Learning Using Python and Spark – click here.

To learn more about Data Analyst with Advanced excel course – click here.
To learn more about Data Analyst with SAS Course – click here.
To learn more about Data Analyst with R Course – click here.
To learn more about Big Data Course – click here.

How to Take the Plunge from IT to Analytics: Explained

With data analytics flourishing the manner it is, a lot of you hailing from IT background are sincerely thinking about making the remarkable switch from IT to Analytics. The skills you possess are transferable and the data structure fascinates you. You know very well, you will make more money in analytics and your career pathway will seek you great rewards. Yet something is stopping you from going!!!


How to Take the Plunge from IT to Analytics: Explained


What it is? Why are you feeling apprehensive to make the bold move that could change your life and career forever?

Continue reading “How to Take the Plunge from IT to Analytics: Explained”

Write ETL Jobs to Offload the Data Warehouse Using Apache Spark

Write ETL Jobs to Offload the Data Warehouse Using Apache Spark

The surge of Big Data is everywhere. The evolving trends in BI have taken the world in its stride and a lot of organizations are now taking the initiative of exploring how all this fits in.

Leverage data ecosystem to its full potential and invest in the right technology pieces – it’s important to think ahead so as to reap maximum benefits in IT in the long-run.

“By 2020, information will be used to reinvent, digitalize or eliminate 80% of business processes and products from a decade earlier.” – Gartner’s prediction put it so right!

The following architecture diagram entails a conceptual design – it helps you leverage the computing power of Hadoop ecosystem from your conventional BI/ Data warehousing handles coupled with real time analytics and data science (data warehouses are now called data lakes).

moderndwarchitecture

In this post, we will discuss how to write ETL jobs to offload data warehouse using PySpark API from the genre of Apache Spark. Spark with its lightning-fast speed in data processing complements Hadoop.

Now, as we are focusing on ETL job in this blog, let’s introduce you to a parent and a sub-dimension (type 2) table from MySQL database, which we will merge now to impose them on a single dimension table in Hive with progressive partitions.

Stay away from snow-flaking, while constructing a warehouse on hive. It will reduce useless joins as each join task generates a map task.

Just to raise your level of curiosity, the output on Spark deployment alone in this example job is 1M+rows/min.

The Employee table (300,024 rows) and a Salaries table (2,844,047 rows) are two sources – here employee’s salary records are kept in a type 2 fashion on ‘from_date’ and ‘to_date’ columns. The main target table is a functional Hive table with partitions, developed on year (‘to_date’) from Salaries table and Load date as current date. Constructing the table with such potent partition entails better organization of data and improves the queries from current employees, provided the to_date’ column has end date as ‘9999-01-01’ for all current records.

The rationale is simple: Join the two tables and add load_date and year columns, followed by potent partition insert into a hive table.

Check out how the DAG will look:

screen-shot-2015-09-28-at-1-44-32-pm

Next to version 1.4 Spark UI conjures up the physical execution of a job as Direct Acyclic Graph (the diagram above), similar to an ETL workflow. So, for this blog, we have constructed Spark 1.5 with Hive and Hadoop 2.6.0

Go through this code to complete your job easily: it is easily explained as well as we have provided the runtime parameters within the job, preferably they are parameterized.

Code: MySQL to Hive ETL Job

__author__ = 'udaysharma'
# File Name: mysql_to_hive_etl.py
from pyspark import SparkContext, SparkConf
from pyspark.sql import SQLContext, HiveContext
from pyspark.sql import functions as sqlfunc

# Define database connection parameters
MYSQL_DRIVER_PATH = "/usr/local/spark/python/lib/mysql-connector-java-5.1.36-bin.jar"
MYSQL_USERNAME = '<USER_NAME >'
MYSQL_PASSWORD = '********'
MYSQL_CONNECTION_URL = "jdbc:mysql://localhost:3306/employees?user=" + MYSQL_USERNAME+"&password="+MYSQL_PASSWORD 

# Define Spark configuration
conf = SparkConf()
conf.setMaster("spark://Box.local:7077")
conf.setAppName("MySQL_import")
conf.set("spark.executor.memory", "1g")

# Initialize a SparkContext and SQLContext
sc = SparkContext(conf=conf)
sql_ctx = SQLContext(sc)

# Initialize hive context
hive_ctx = HiveContext(sc)

# Source 1 Type: MYSQL
# Schema Name  : EMPLOYEE
# Table Name   : EMPLOYEES
# + --------------------------------------- +
# | COLUMN NAME| DATA TYPE    | CONSTRAINTS |
# + --------------------------------------- +
# | EMP_NO     | INT          | PRIMARY KEY |
# | BIRTH_DATE | DATE         |             |
# | FIRST_NAME | VARCHAR(14)  |             |
# | LAST_NAME  | VARCHAR(16)  |             |
# | GENDER     | ENUM('M'/'F')|             |
# | HIRE_DATE  | DATE         |             |
# + --------------------------------------- +
df_employees = sql_ctx.load(
    source="jdbc",
    path=MYSQL_DRIVER_PATH,
    driver='com.mysql.jdbc.Driver',
    url=MYSQL_CONNECTION_URL,
    dbtable="employees")

# Source 2 Type : MYSQL
# Schema Name   : EMPLOYEE
# Table Name    : SALARIES
# + -------------------------------- +
# | COLUMN NAME | TYPE | CONSTRAINTS |
# + -------------------------------- +
# | EMP_NO      | INT  | PRIMARY KEY |
# | SALARY      | INT  |             |
# | FROM_DATE   | DATE | PRIMARY KEY |
# | TO_DATE     | DATE |             |
# + -------------------------------- +
df_salaries = sql_ctx.load(
    source="jdbc",
    path=MYSQL_DRIVER_PATH,
    driver='com.mysql.jdbc.Driver',
    url=MYSQL_CONNECTION_URL,
    dbtable="salaries")

# Perform INNER JOIN on  the two data frames on EMP_NO column
# As of Spark 1.4 you don't have to worry about duplicate column on join result
df_emp_sal_join = df_employees.join(df_salaries, "emp_no").select("emp_no", "birth_date", "first_name",
                                                             "last_name", "gender", "hire_date",
                                                             "salary", "from_date", "to_date")

# Adding a column 'year' to the data frame for partitioning the hive table
df_add_year = df_emp_sal_join.withColumn('year', F.year(df_emp_sal_join.to_date))

# Adding a load date column to the data frame
df_final = df_add_year.withColumn('Load_date', F.current_date())

df_final.repartition(10)

# Registering data frame as a temp table for SparkSQL
hive_ctx.registerDataFrameAsTable(df_final, "EMP_TEMP")

# Target Type: APACHE HIVE
# Database   : EMPLOYEES
# Table Name : EMPLOYEE_DIM
# + ------------------------------- +
# | COlUMN NAME| TYPE   | PARTITION |
# + ------------------------------- +
# | EMP_NO     | INT    |           |
# | BIRTH_DATE | DATE   |           |
# | FIRST_NAME | STRING |           |
# | LAST_NAME  | STRING |           |
# | GENDER     | STRING |           |
# | HIRE_DATE  | DATE   |           |
# | SALARY     | INT    |           |
# | FROM_DATE  | DATE   |           |
# | TO_DATE    | DATE   |           |
# | YEAR       | INT    | PRIMARY   |
# | LOAD_DATE  | DATE   | SUB       |
# + ------------------------------- +
# Storage Format: ORC


# Inserting data into the Target table
hive_ctx.sql("INSERT OVERWRITE TABLE EMPLOYEES.EMPLOYEE_DIM PARTITION (year, Load_date) \
            SELECT EMP_NO, BIRTH_DATE, FIRST_NAME, LAST_NAME, GENDER, HIRE_DATE, \
            SALARY, FROM_DATE, TO_DATE, year, Load_date FROM EMP_TEMP")

As we have the necessary configuration mentioned in our code, we will simply call to run this job

spark-submit mysql_to_hive_etl.py

As soon as the job is run, our targeted table will consist 2844047 rows just as expected and this is how the partitions will appear:

screen-shot-2015-09-29-at-12-42-37-am

2

3

screen-shot-2015-09-29-at-12-46-55-am

The best part is that – the entire process gets over within 2-3 mins..

For more such interesting blogs and updates, follow us at DexLab Analytics. We are a premium Big Data Hadoop institute in Gurgaon catering to the needs of aspiring candidates. Opt for our comprehensive Hadoop certification in Delhi and crack such codes in a jiffy!


Interested in a career in Data Analyst?

To learn more about Data Analyst with Advanced excel course – Enrol Now.
To learn more about Data Analyst with R Course – Enrol Now.
To learn more about Big Data Course – Enrol Now.

To learn more about Machine Learning Using Python and Spark – Enrol Now.
To learn more about Data Analyst with SAS Course – Enrol Now.
To learn more about Data Analyst with Apache Spark Course – Enrol Now.
To learn more about Data Analyst with Market Risk Analytics and Modelling Course – Enrol Now.

Keep Pace with Automation: Emerging Data Science Jobs in India

Indian IT market is not yet doomed. In fact, if you look at the larger picture, you will find India is expected to face a shortage of 200000 data scientists by 2020. Where traditional IT jobs are going through a rough patch, new age jobs are surfacing up, according to market reports. Big Data, Artificial Intelligence, the Internet of Things, Cloud Computing, and Cybersecurity are new digital domains that are replacing the old school jobs, like data entry and server maintenance, which are expected to reduce more over the next five years.
The next decade is going to witness most vacancies in these job posts:

However, just because there is a wide array of openings for a web services consultant doesn’t make it the most lucrative job position. Big Data architect job openings are much less in number, but offer handsome pays, according to reports.

A median salary of a web services consultant is Rs 9.27 lakh ($14,461) annually

A median salary of a big data architect is Rs 20.67 lakh ($32,234) annually

Now, tell me, which is better?

As technologies evolve so drastically, it becomes an absolute imperative for the techies to update their skills through short learning programs and crash courses. Data analyst courses will help them to sync in with the latest technological developments, which happens every day, something or the other. Moreover, it’s like a constant process, where they have to learn something every year to succeed in this rat race of technological superiority. Every employee needs to make some time, as well as the companies. The companies also need to facilitate these newer technologies in their systems to keep moving ahead of their tailing rivals.

Re-skill or perish – is the new slogan going around. The urgency to re-skill is creating a spur among employees with mid-level experience. If you check the surveys, you will find around 57% of the 7000 IT professionals looking forward to enroll for a short time learning course have at least 4 to 10 years of work experience. Meanwhile, a mere 11% of those who are under 4 years of experience are looking out for such online courses. It happens because, primary-stage employees are mostly fresh graduates, who receives in-house training from their respective companies, hence they don’t feel the urge to scrounge through myriad learning resources, unlike their experienced counterparts.


Today, all big companies across sectors are focusing their attention on data science and analytics, triggering major reinventions in the job profile of a data analyst. Owing to technology updates, “The role of a data analyst is itself undergoing a sea change, primarily because better technology is available now to aid in decision-making,” said Sumit Mitra, head of group human resources and corporate services at GILAC. To draw a closure, data science is the new kid in the block, and IT professionals are imbibing related skills to shine bright in this domain. Contact DexLab Analytics for data analyst course in Delhi. They offer high-in demand data analyst certification courses at the most affordable prices.


Speaking with Tanmoy Ganguli, the expert Data Analyst Bringing Cutting Edge Technology to DexLab Analytics

Speaking with Tanmoy Ganguli, the expert Data Analyst Bringing Cutting Edge Technology to DexLab Analytics


DexLab Analytics is proud to announce that Tanmoy Ganguli, a proficient Data Analyst who has a long standing experience in Credit Risk Modelling, SAS and regression models is joining our Gurgaon institute as Program Director. Here are some excerpts from an interview we conducted, where he talks about the various challenges he faced in his career and the rapid development of Data Analytics.

Continue reading “Speaking with Tanmoy Ganguli, the expert Data Analyst Bringing Cutting Edge Technology to DexLab Analytics”

Skills required during Interviews for a Data Scientist @ Facebook, Intel, Ebay. Square etc.

Skills required during Interviews for a Data Scientist @ Facebook, Intel, Ebay. Square etc.

Basic Programming Languages: You should know a statistical programming language, like R or Python (along with Numpy and Pandas Libraries), and a database querying language like SQL

Statistics: You should be able to explain phrases like null hypothesis, P-value, maximum likelihood estimators and confidence intervals. Statistics is important to crunch data and to pick out the most important figures out of a huge dataset. This is critical in the decision-making process and to design experiments.

Machine Learning: You should be able to explain K-nearest neighbors, random forests, and ensemble methods. These techniques typically are implemented in R or Python.  These algorithms show to employers that you have exposure to how data science can be used in more practical manners.

Data Wrangling: You should be able to clean up data. This basically means understanding that “California” and “CA” are the same thing – a negative number cannot exist in a dataset that describes population. It is all about identifying corrupt (or impure) data and and correcting/deleting them.

Data Visualization: Data scientist is useless on his or her own. They need to communicate their findings to Product Managers in order to make sure those data are manifesting into real applications. Thus, familiarity with data visualization tools like ggplot is very important (so you can SHOW data, not just talk about them)

Software Engineering: You should know algorithms and data structures, as they are often necessary in creating efficient algorithms for machine learning. Know the use cases and run time of these data structures: Queues, Arrays, Lists, Stacks, Trees, etc.

2

What they look for? @ Mu-Sigma, Fractal Analytics

    • Most of the analytics and data science companies, including third party analytics companies such as Mu-sigma and Fractal hire fresher’s in big numbers (some time in hundreds every year).
    • You see one of the main reasons why they are able to survive in this industry is the “Cost Arbitrage” benefit between the US and other developed countries vs India.
    • Generally speaking, they normally pay significantly lower for India talent in India compared to the same talent in the USA. Furthermore, hiring fresh talent from the campuses is one of the key strategies for them to maintain the low cost structure.
    • If they are visiting your campuses for interview process, you should apply. In case if they are not visiting your campus, drop your resume to them using their corporate email id that you can find on their websites.
    • Better will be to find someone in your network (such as seniors) who are working for these companies and ask them to refer you. This is normally the most effective approach after the campus placements.

Key Skills that look for are-

  • Love for numbers and quantitative stuff
  • Grit to keep on learning
  • Some programming experience (preferred)
  • Structured thinking approach
  • Passion for solving problems
  • Willingness to learn statistical concepts

Technical Skills

  • Math (e.g. linear algebra, calculus and probability)
  • Statistics (e.g. hypothesis testing and summary statistics)
  • Machine learning tools and techniques (e.g. k-nearest neighbors, random forests, ensemble methods, etc.)
  • Software engineering skills (e.g. distributed computing, algorithms and data structures)
  • Data mining
  • Data cleaning and munging
  • Data visualization (e.g. ggplot and d3.js) and reporting techniques
  • Unstructured data techniques
  • Python / R and/or SAS languages
  • SQL databases and database querying languages
  • Python (most common), C/C++ Java, Perl
  • Big data platforms like Hadoop, Hive & Pig

Business Skills

  • Analytic Problem-Solving: Approaching high-level challenges with a clear eye on what is important; employing the right approach/methods to make the maximum use of time and human resources.
  • Effective Communication: Detailing your techniques and discoveries to technical and non-technical audiences in a language they can understand.
  • Intellectual Curiosity: Exploring new territories and finding creative and unusual ways to solve problems.
  • Industry Knowledge: Understanding the way your chosen industryfunctions and how data are collected, analyzed and utilized.


Interested in a career in Data Analyst?

To learn more about Data Analyst with Advanced excel course – Enrol Now.
To learn more about Data Analyst with R Course – Enrol Now.
To learn more about Big Data Course – Enrol Now.

To learn more about Machine Learning Using Python and Spark – Enrol Now.
To learn more about Data Analyst with SAS Course – Enrol Now.
To learn more about Data Analyst with Apache Spark Course – Enrol Now.
To learn more about Data Analyst with Market Risk Analytics and Modelling Course – Enrol Now.

Drawing a Bigger Picture: FAQs about Data Analytics

Drawing a Bigger Picture: FAQs about Data Analytics

When the whole world is going crazy about business analytics, you might be sitting in a corner and wondering what does it all mean? With so many explanations, notions run a gamut of options.

It’s TIME to be acquainted with all the imperceptible jargons of data science; let’s get things moving with these elementary FAQs.

What is data analytics?

Data analytics is all about understanding the data and implementing the derived knowledge to direct actions. It is a technical way to transform raw data into meaningful information, which makes integral decision-making easier and effective. To perform data analytics, a handful number of statistical tools and software is used and et voila, you are right on your way to success!

How will analytics help businesses grow?

The rippling effects of data analytics are evident, from the moment you introduce it in your business network. And stop rattling! The effects are largely on the positive side, letting your business unravel opportunities, which it ignored before owing to lack of accurate analytical lens. By parsing latest trends, conventions and relationships within data, analytics help predict the future tendencies of the market.

Moreover, it throws light on these following questions:

  • What is going on and what will happen next?
  • Why is it happening?
  • What strategy would be the best to implement?

Also read: Tigers will be safe in the hands of Big Data Analytics

How do analytics projects look like?

A conventional analytics strategy is segregated into the following 4 steps:

Research – Analysts need to identify and get through the heart of the matter to help business address issues that it is facing now or will encounter in the future.

Plan – What type of data is used? What are the sources from where the data is to be secured? How the data is prepared for implementation? What are the methods used to analyse data? Professional analysts will assess the above-mentioned questions and find relevant solutions.

Execute – This is an important step, where analysts explores and analyses data from different perspectives.

Evaluate – In this stage, analysts evaluate the strategies and execute them.

How predictive modelling is implemented through business domains?

In business analytics, there are chiefly two models, descriptive and predictive. Descriptive models explain what has already happened and what is happening now, while Predictive models decipher what would happen along with stating the underlying reason.

Also read: Data Analytics for the Big Screen

One can now solve issues related to marketing, finance, human resource, operations and any other business operations without a hitch with predictive analytics modelling. By integrating past with present data, this strategy aims to anticipate the future before it arrives.

When should I deploy analytics in business?

An Intrinsic Revelation – Analytics is not a one-time event; it is a continuous process once undertaken. No one can say when will be the right time to introduce data analytics in your business. However, most of the businesses resort to analytics in their not-up-par days, when they face problems and lags behind in devising any possible solution.

5

So, now that you understand the data analytics sphere and the significance attached, take up business analytics training in Delhi. From a career perspective, the field of data science is burgeoning. DexLab Analytics is a premier data science training institute, headquartered in Gurgaon. Check out our services and get one for yourself!


Interested in a career in Data Analyst?

To learn more about Data Analyst with Advanced excel course – Enrol Now.
To learn more about Data Analyst with R Course – Enrol Now.
To learn more about Big Data Course – Enrol Now.

To learn more about Machine Learning Using Python and Spark – Enrol Now.
To learn more about Data Analyst with SAS Course – Enrol Now.
To learn more about Data Analyst with Apache Spark Course – Enrol Now.
To learn more about Data Analyst with Market Risk Analytics and Modelling Course – Enrol Now.

Call us to know more