data analyst institute Archives - Page 2 of 11 - DexLab Analytics | Big Data Hadoop SAS R Analytics Predictive Modeling & Excel VBA

Statistical Application in R & Python: EXPONENTIAL DISTRIBUTION

Statistical Application in R & Python: EXPONENTIAL DISTRIBUTIONStatistical Application in R & Python: EXPONENTIAL DISTRIBUTION

In this blog, we will explore the Exponential distribution. We will begin by questioning the “why” behind the exponential distribution instead of just looking at its PDF formula to calculate probabilities. If we can understand the “why” behind every distribution, we will have a head start in figuring out its practical uses in our everyday business situations.

Much could be said about the Exponential distribution. It is an important distribution used quite frequently in data science and analytics. Besides, it is also a continuous distribution with one parameter “λ” (Lambda). Lambda as a parameter in the case of the exponential distribution represents the “rate of something”. Essentially, the exponential distribution is used to model the decay rate of something or “waiting times”.

Data Science Machine Learning Certification

For instance, you might be interested in predicting answers to the below-mentioned situations:

  • The amount of time until the customer finishes browsing and actually purchases something in your store (success).
  • The amount of time until the hardware on AWS EC2 fails (failure).
  • The amount of time you need to wait until the bus arrives (arrival).

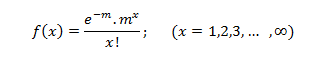
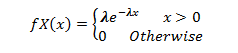
In all of the above cases if we can estimate a robust value for the parameter lambda, then we can make the predictions using the probability density function for the distribution given below:

Application:-

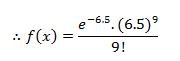
Assume that a telemarketer spends on “average” roughly 5 minutes on a call. Imagine they are on a call right now. You are asked to find out the probability that this particular call will last for 3 minutes or less.


Below we have illustrated how to calculate this probability using Python and R.

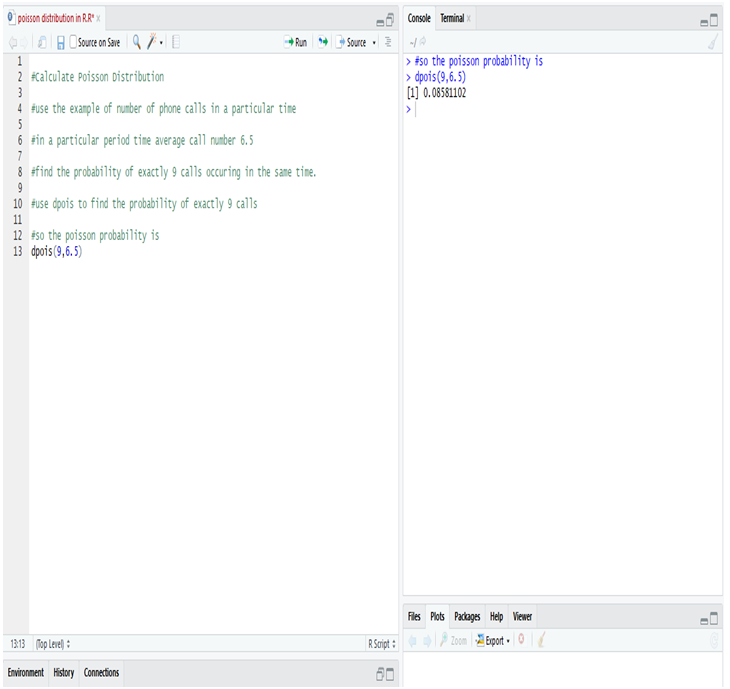
Calculate Exponential Distribution in R:

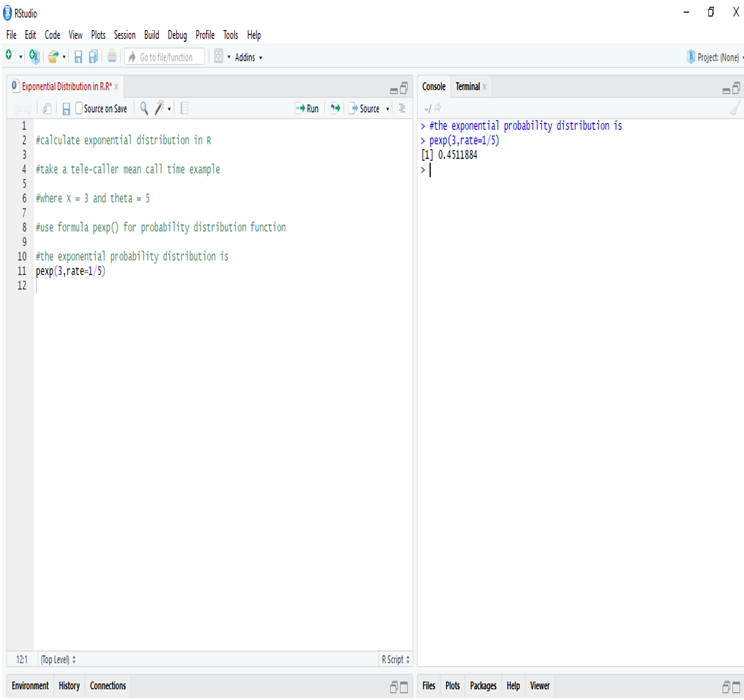
In R we calculate exponential distribution and get the probability of mean call time of the tele-caller will be less than 3 minutes instead of 5 minutes for one call is 45.11%.This is to say that there is a fairly good chance for the call to end before it hits the 3 minute mark.

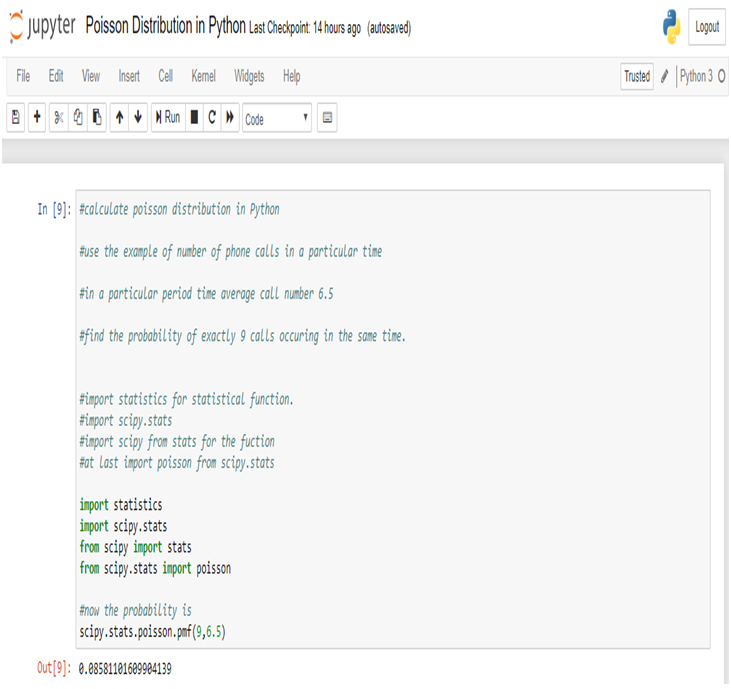
Calculate Exponential Distribution in Python:

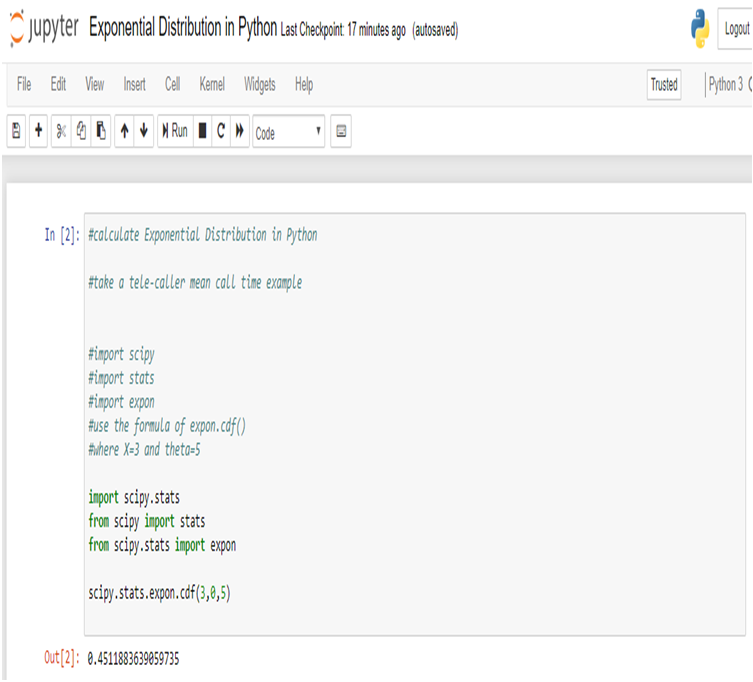
We get the same result using Python.

Conclusion:

We use exponential distribution to predict the amount of waiting time until the next event (i.e., success, failure, arrival, etc).

Here we try to predict that the probability of the mean call time of the telemarketer will be less than 3 minutes instead of 5 minutes for one call, with the help of Exponential Distribution. Similarly, the exponential distribution is of particular relevance when faced with business problems that involve the continuous rate of decay of something. For instance, when attempting to model the rate with which the batteries will run out. 

Data Science & Machine Learning Certification

Hopefully, this blog has enabled you to gather a better understanding of the exponential distribution. For more such interesting blogs and useful insights into the technologies of the age, check out the best Analytics Training institute Gurgaon, with extensive Data Science Courses in Gurgaon and Data analyst course in Delhi NCR.

Lastly, let us know your opinions about this blog through your comments below and we will meet you with another blog in our series on data science blogs soon.


Interested in a career in Data Analyst?

To learn more about Data Analyst with Advanced excel course – Enrol Now.
To learn more about Data Analyst with R Course – Enrol Now.
To learn more about Big Data Course – Enrol Now.

To learn more about Machine Learning Using Python and Spark – Enrol Now.
To learn more about Data Analyst with SAS Course – Enrol Now.
To learn more about Data Analyst with Apache Spark Course – Enrol Now.
To learn more about Data Analyst with Market Risk Analytics and Modelling Course – Enrol Now.

Statistical Application in R & Python: Poisson Distribution

Statistical Application in R & Python: Poisson Distribution

Continuing with the series of blogs, the first of which was Statistical Application In R & Python: Normal Probability Distribution, here we bring you a post on how you can calculate Poisson distribution effortless using R & Python. So, stay tuned!

Poisson distribution is a counting process which is a discrete probabilistic model. It has only one parameter, (lambda or “m”) which is essentially the average rate of change. Poisson distribution is used to model “number of anything”. The probability distribution function of a Poisson distribution is given by the below expression.

If m is the mean occurrence per interval, then the probability of having x occurrence with in a given interval is:

Application:

A business firm receives on an average 6.5 telephone calls per day during the time period 11:00 – 11:15 A.M., Find the probability that on a certain day, the firm receives exactly9 calls during the same period.

The random variable x is the ‘number of telephone calls received during the period 11:00 – 11:15 A.M, since x is assumed to Poisson distribution. The parameter m is equal to the mean of the distribution; i.e.  m = 6.5 and x = 9, then the equation is:

Calculate Poisson Distribution in R:

So, while calculating Poisson distribution in R, we notice that the probability of occurring exactly 9 calls instead of average 6.5 calls in a given particular time (11:00 A.M – 11:15 A.M ) = 85.81%

Calculate Poisson Distribution in Python:

So, while we calculate Poisson distribution in Python, we notice that the probability of occurring exactly 9 calls instead of average 6.5 calls in a given particular time (11:00 A.M – 11:15 A.M) = 85.81%

Conclusion:

Companies can use the Poisson distribution to contrive effective steps to improve their operational efficiency. For instance, an analysis done with the Poisson distribution might reveal how a company can arrange staffing in order to be able to handle the peak periods efficiently, when the customer service calls keep on pouring.

In this problem we see that the business firm receives on an average 6.5 telephone calls per day during the time period 11:00A.M – 11:15A.M, then the probability of the firm receives exactly 9 calls in a same is 85.81%.

Dexlab Analytics is the best Python training institute in Delhi, bringing you the all-inclusive courses of Python for Data Analysis and R Predictive Modelling Certification, among others to start your career in Data Science and Analytics.


Interested in a career in Data Analyst?

To learn more about Data Analyst with Advanced excel course – Enrol Now.
To learn more about Data Analyst with R Course – Enrol Now.
To learn more about Big Data Course – Enrol Now.

To learn more about Machine Learning Using Python and Spark – Enrol Now.
To learn more about Data Analyst with SAS Course – Enrol Now.
To learn more about Data Analyst with Apache Spark Course – Enrol Now.
To learn more about Data Analyst with Market Risk Analytics and Modelling Course – Enrol Now.

How to Start a Successful Data Science Career?

How to Start a Successful Data Science Career?

The most common question we come across in DexLab Analytics HQ is how to take a step into the world of analytics and data science. Of course, grabbing a data science job isn’t easy, especially when there is so much hype going around. This is why we have put together top 5 ways to bag the hottest job in town. Follow these points and swerve towards your dream career.

Deep Learning and AI using Python

Enhance Your Skills

At present, LinkedIn in the US alone have 24,697 vacant data scientist positions. Python, SQL and R are the most common skills in demand followed by Tensorflow, Jupyter Notebooks and AWS. Gaining statistical literacy is the best way to grab these hot positions but for that, you need hands-on training from an expert institute.

If interested, you can check out analytics courses in Delhi NCR delivered by DexLab Analytics. They can help you stay ahead of the curve.

Create an Interesting Portfolio

A portfolio filled with machine learning projects is the best bet. Companies look for candidates who have prior work experience or are involved in data science projects. Your portfolio is the potential proof that you are capable enough to be hired. Thus, make it as attractive as possible.

Include projects that qualify you to be a successful data scientist. We would recommend including a programming language of your choice, your data visualization skill and your ability to employ SQL.

Get Yourself a Website

Want to standout from the rest? Build up your website, create a strong online presence and continuously add and update your Kaggle and GitHub profile to exhibit your skills and command over the language. Profile showcasing is of utmost importance to get recognized by the recruiters. A strong online presence will not only help you fetch the best jobs but also garner the attention of the leads of various freelance projects.

Be Confident and Apply for Jobs You Are Interested In

It doesn’t matter if you possess the skills or meet the job requirements mentioned on the post, don’t stop applying for the jobs that interest you. You might not know every skill given on a job description. Follow a general rule, if you qualify even half of the skills, you should apply.

However, while job hunting, make sure you contact recruiters, well-versed in data science and boost your networking skills. We would recommend you visit career fairs, approach family, friends or colleagues and scroll through company websites. These are the best ways to look for data science jobs. 

2

Improve Your Communication Skills

One of the key skills of data scientists is to communicate insights to different users and stakeholders. Since data science projects run across numerous teams and insights are often shared across a large domain, hence superior communication skill is an absolute must-have.

Want more information on how to become a data scientist? Follow DexLab Analytics. We are a leading data analyst training institute in Delhi offering in-demand skill training courses at affordable prices.


The blog has been sourced fromwww.forbes.com/sites/louiscolumbus/2019/04/14/how-to-get-your-data-scientist-career-started/#67fdbc0e7e5c


Interested in a career in Data Analyst?

To learn more about Data Analyst with Advanced excel course – Enrol Now.
To learn more about Data Analyst with R Course – Enrol Now.
To learn more about Big Data Course – Enrol Now.

To learn more about Machine Learning Using Python and Spark – Enrol Now.
To learn more about Data Analyst with SAS Course – Enrol Now.
To learn more about Data Analyst with Apache Spark Course – Enrol Now.
To learn more about Data Analyst with Market Risk Analytics and Modelling Course – Enrol Now.

ThoughtSpot-Alteryx Partnership to Revolutionize Analytics with AI

ThoughtSpot-Alteryx Partnership to Revolutionize Analytics with AI

ThoughtSpot has recently partnered with Alteryx to boost analytics endeavors with AI.

The aim is to transform businesses through systematic data analytics simplifying the entire process for business users. Right from data preparation to insight generation, Alteryx in association with ThoughtSpot is expected to perform advanced analytics, evaluate meaningful insights and answer relevant questions – all using an all-natural, simple language search.

Constructing Business-driven Data Analytics Pipeline

Data is everywhere. Small and big business houses leverage the power of data science and invest large amounts in technologies that transform industries. Nevertheless, there are still many organizations that fail to put this data into the right hands. Data matters the most for business people. They are the ones who drive the change and data needs to reach them.

The latest collaboration between Alteryx and ThoughtSpot has re-conceptualized the whole idea of data pipeline by empowering every single business person, irrespective of their technical superiority, to connect, evaluate and model intricate data using Alteryx and then immediately start discovering insights using search and AI-driven analytical frameworks by ThoughtSpot. The amalgamation comes with a set of new tools that let Alteryx users add original ThoughtSpot Bulk Loader connections and ThoughtSpot TQL statements directly into a workflow of Alteryx.

Deep Learning and AI using Python

This system automatically offers several advantages to the businesses, including:

  • Connect, modify and model intricate data in a fraction of a second – The users can now collect data from their organization with the help of a high throughput fast parallel loader, transform it and then model it for further analysis more efficiently than before.
  • Faster results – Business users enjoy the liberty to work with data that matters the most, apply sophisticated analytical tools and unravel crucial automated insights while releasing valuable analytical resources that can be employed in other high-value and strategic projects.
  • Advance with AI – The users get to develop machine learning and AI models in an absolutely code-friendly and code-less environment. Later, they can use search to absorb and share insights derived from these models.

The Leaders’ Opinions

On the above context, Toni Adams, Vice President, Global Alliances & Partnerships at ThoughtSpot shared that today’s enterprises cannot afford to wait for days in the hope of putting insights in the hands of the business users. The business users need to be empowered with every mean to churn out insights directly from the most complex data. Fortunately, the recent partnership is likely to change the complete dynamo of data pipeline by transforming every employee of an organization into a data-driven powerhouse capable enough to derive insights instantly. This will eventually make operations simpler and productive.

Furthermore, Steve Walden, Senior Vice President of Business Development, Alteryx emphasized that they believe in strengthening business capabilities by empowering every data worker of the organization. These workers, in turn, will transmute data into actionable insights faster and tweak business outcomes. The partnership with ThoughtSpot is expected to enhance ease-of-use throughout the entire analytics pipeline and unleash unprecedented value for every joint customer.

2

About Alteryx

Transforming businesses through data analytics, Alteryx is a reputable end-to-end analytics platform that entitles data analysts to connect, deliver powerful insights and witness the thrill of deriving answers pretty faster. For more information, click www.alteryx.com.

A premier data analytics training institute, DexLab Analytics offers comprehensive Alteryx certification training in Delhi. Through hands-on training and real-life examples, the expert consultants help you master the intricacies of Alteryx for complex data analytics. Enroll Now.


The blog has been sourced from: www.marketwatch.com/press-release/thoughtspot-partners-with-alteryx-to-advance-analyticswith-ai-2019-03-14


Interested in a career in Data Analyst?

To learn more about Data Analyst with Advanced excel course – Enrol Now.
To learn more about Data Analyst with R Course – Enrol Now.
To learn more about Big Data Course – Enrol Now.

To learn more about Machine Learning Using Python and Spark – Enrol Now.
To learn more about Data Analyst with SAS Course – Enrol Now.
To learn more about Data Analyst with Apache Spark Course – Enrol Now.
To learn more about Data Analyst with Market Risk Analytics and Modelling Course – Enrol Now.

A Regression Line Is the Best Fit for the Given PRF If the Parameters Are OLS Estimations – Elucidate

A Regression Line Is the Best Fit for the Given PRF If the Parameters Are OLS Estimations - Elucidate

Regression analysis is extensively used in business applications. It’s one of the most integral statistical techniques that help in estimating the direction and strength between two or more (financial) variables – thus determining a company’s sales and profits over the past few years.

In this blog, we have explained how a regression line is the best fit for a given PRF if the parameters are all OLS estimations.

The OLS estimators for a given regression line has been obtained as: a = y ̅ – bx ̅ and b = (Cov(x,y))/(v(x)). The regression line on the basis of these OLS estimate has been given as: Y ̂_ i-Y ̅ = b(x_i-x ̅ )….. (1)

The regression line (1) constructed above is a function of the least square i.e. the parameters of the regression equation have been selected so that the residual sum of squares is minimized. Thus, the estimators ‘a’ & ‘b’ explains the population parameters, the best relative to any other parameters. Given, the linearity of the parameters, these estimators share the minimum variations with the population parameters, i.e. they explain the maximum variations in the model, in relation to the population parameters, as compared to any other estimators, in a class of unbiased estimators.

Thus, the regression line would be the ‘best fit’ for a given PRF. If ‘a’ & ‘b’ are best linear unbiased estimators for  respectively. Thus, to show ‘best fit’, we need to prove:

  1. To ‘b’ is Best unbiased estimator for :-

From the OLS estimation; we have ‘b’ as:

i.e.b is a linear combination of w’is & y’is.

Hence; ‘b’ is a linear estimator for β. Therefore, the regression line would be linear in parameters as far as ‘b’ is concerned.

Now,

Let us test for the prevalence of this conditions:

For unbiasedness, we must have :- E(b)=β. To test this, we take expectation on both sides of (3) & get:

From (1) & (4) we can say that ‘b’ is a linear unbiased estimator for β.

To check whether ‘b’ is the best estimator or not we need to check whether it has the minimum variance in a class of linear unbiased estimator.

Thus, we need to calculate the variance for ‘b’ & show that it is the minimum in a class of unbiased estimations. But, first, we need to calculate the variance for ‘b’.

Now; we need to construct another linear unbiased estimator and find its variance.

Let another estimator be: b^*=∑ci yi….(6)  For unbiasedness ∑ci =0,∑cixi =1.

Now; from (6) we get:

∴b* is an unbiased estimator for  Now; the variance for  can be calculated as:-

Now;

Hence; from (9) we can say V(b) is the least among a class of unbiasedness estimators.

Therefore, ‘b’ is the best linear unbiased estimator for  in a class of linear unbiased estimators.

2

  1. To prove ‘a’ is the best linear unbiased estimator for α:-

Form the OLS estimation we have ‘a’ as:-

Here; ‘b’ is a function of Y and Y is a linear function of X(orUi).

‘a’ is also a linear function of Y. i.e. has linearity.

There, ‘a’ is a linear estimator for   ……. (11)

Now, for ‘a’ to be an unbiased estimator; we must have From (10) we have:-

Taking expectations on both sides of the equation; we get:

Therefore, ‘a’ is an unbiased estimator for  ……… (12)

From (11) & (12) ‘a’ is a linear unbiased estimator for

Now, if ‘a’ is to be the best estimator for then is most have the minimum variance. Thus; we first need to calculate the variance of ‘a’.

Now, 

Now; let us consider an estimator in the class of linear unbiased estimator.

Further we know,

Now;

Hence;

Now;

Therefore;

Hence; from (16) we can say that is the Min Variance Unbiased estimator in a class of unbiased estimator.

Hence; we can now safely conclude that a regression line composed of OLS estimators is the ‘best fit’ line for a given PRF, compared to any other estimator.

Thus, the best-fit regression line can be depicted as

Thus, a regression line is the best fit for a given PRF if the estimators are OLS.

End Notes

The beauty and efficiency of Regression method of forecasting never fail to amaze us. The way it crunches the data to help make better decisions and improve the current position of the business is incredible. If you are interested in the same, follow us at DexLab Analytics. A continues blog series on regression model and analysis is upcoming. Watch this space for more.

DexLab Analytics offers premium data science courses in Gurgaon crafted by the experts. After thorough research, each course is prepared keeping student’s needs and industry demands in mind. You can check out our course offerings here.


Interested in a career in Data Analyst?

To learn more about Data Analyst with Advanced excel course – Enrol Now.
To learn more about Data Analyst with R Course – Enrol Now.
To learn more about Big Data Course – Enrol Now.

To learn more about Machine Learning Using Python and Spark – Enrol Now.
To learn more about Data Analyst with SAS Course – Enrol Now.
To learn more about Data Analyst with Apache Spark Course – Enrol Now.
To learn more about Data Analyst with Market Risk Analytics and Modelling Course – Enrol Now.

Demand for Data Analysts is Skyrocketing – Explained

Demand for Data Analysts is Skyrocketing - Explained

The salary of analytics professionals outnumbers that of software engineers by more than 26%. The wave of big data analytics is taking the world by storm. If you follow the latest studies, you will discover that there has been a prominent growth in median salary over several experience levels in the past three years (2016 to 2018). In 2019, the average analytics salary has been capped at 12.6 lakh per annum.

The key takeaway is that the salary structure of analytics professionals continues to beat other tech-related job roles. In fact, data analysts are found out-earning their Java correspondents by nearly 50% in India alone. A latest survey provides an encompassing view of base and compensation salaries in data science along with median salaries followed across diverse job categories, regions, education profiles, experience, tools and skills.

In this regard, a spokesperson of a prominent data analytics learning institute was found saying, “The demand for AI skills is expected to increase rapidly, which is also reflected by the fact that AI engineers command a higher salary than peers.” She further added, “Many of our clients have realized that investing in data-driven skills at the leadership level is a determining factor for the success of digital and AI initiatives in the organization. With the increasing adoption of digital technologies, we expect an enduring growth of Data Science and AI initiatives to offer exciting and lucrative career options to new age professionals,”

Over time, we are witnessing how markets are evolving while the demand for skilled data scientists is following an upward trend. It is not only the technology firms that are posting job offers, but the change is also evident across industries, like retail, medical, retail and CPG amongst others. These sectors are enhancing their analytical capabilities implying an automatic increase in the number of data-centric jobs and recruitment of data scientists.

Points to Consider:

  • In the beginning, nearly 76% of data analysts earn 6-lakh figure per annum.
  • The average analytics salary observed in 2018-19 is 12.6 lakh.
  • In terms of analytics career, Mumbai offers the highest compensation of 13.7 lakh yearly, followed by Bangalore at 13 lakh.
  • Mid-level professionals proficient in data analytics are more in demand.
  • Knowing Python is an added advantage; Python Programming training will help you earn more. Expect a package of 15.1 lakh.
  • Nevertheless, we often see a pay disparity for female data scientists against their male counterparts. While women’s take-home salary is 9.2 lakh, male from the same designation and profession earns 13.7 lakh per annum.

2

As endnotes, the demand for data science skills is skyrocketing. If you want to enter into this flourishing job market, this is the best time! Enroll in a good data analyst course in Delhi and mould your career in the shape of success! DexLab Analytics is a top-notch data analyst training institute that offers a plethora of in-demand skill training courses. Reach us for more.


This article has been sourced fromwww.tribuneindia.com/news/jobs-careers/data-analytics-professionals-ride-the-big-data-wave/759602.html


Interested in a career in Data Analyst?

To learn more about Data Analyst with Advanced excel course – Enrol Now.
To learn more about Data Analyst with R Course – Enrol Now.
To learn more about Big Data Course – Enrol Now.

To learn more about Machine Learning Using Python and Spark – Enrol Now.
To learn more about Data Analyst with SAS Course – Enrol Now.
To learn more about Data Analyst with Apache Spark Course – Enrol Now.
To learn more about Data Analyst with Market Risk Analytics and Modelling Course – Enrol Now.

Bayesian Thinking & Its Underlying Principles

Bayesian Thinking & Its Underlying Principles

In the previous blog on Bayes’ Theorem, we left off at an interesting junction where we just touched upon the ideas on prior odds ratio, likelihood ratio and the resulting Posterior Odds Ratio. However, we didn’t go into much detail of what it means in real life scenarios and how should we use them.

In this blog, we will introduce the powerful concept of “Bayesian Thinking” and explain why it is so important. Bayesian Thinking is a practical application of the Bayes’ Theorem which can be used as a powerful decision-making tool too!

We’ll consider an example to understand how Bayesian Thinking is used to make sound decisions.

For the sake of simplicity, let’s imagine a management consultation firm hires only two types of employees. Let’s say, IT professionals and business consultants. You come across an employee of this firm, let’s call him Raj. You notice something about Raj instantly. Raj is shy. Now if you were asked to guess which type of employee Raj is what would be your guess?

If your guess is that Raj is an IT guy based on shyness as an attribute, then you have already fallen for one of the inherent cognitive biases. We’ll talk more about it later. But what if it can be proved Raj is actually twice as likely to be a Business Consultant?!

This is where Bayesian Thinking allows us to keep account of priors and likelihood information to predict a posterior probability.

The inherent cognitive bias you fell for is actually called – Base Rate Neglect. Base Rate Neglect occurs when we do not take into account the underlying proportion of a group in the population. Put it simply, what is the proportion of IT professionals to Business consultants in a business management firm? It would be fair to assume for every 1 IT professional, the firm hires 10 business consultants.

Another assumption could be made about shyness as an attribute. It would be fair to assume shyness is more common in IT professionals as compared to business consultants. Let’s assume, 75% of IT professionals are in fact shy corresponding to about 15% of business consultants.

Think of the proportion of employees in the firm as the prior odds. Now, think of the shyness as an attribute as the Likelihood. The figure below demonstrates when we take a product of the two, we get posterior odds.

Plugging in the values shows us that Raj is actually twice as likely to be a Business consultant. This proves to us that by applying Bayesian Thinking we can eliminate bias and make a sound judgment.

Now, it would be unrealistic for you to try drawing a diagram or quantifying assumptions in most of the cases. So, how do we learn to apply Bayesian Thinking without quantifying our assumptions? Turns out we could, if we understood what are the underlying principles of Bayesian Thinking are.

Principles of Bayesian Thinking

Rule 1 – Remember your priors!

As we saw earlier how easy it is to fall for the base rate neglect trap. The underlying proportion in the population is often times neglected and we as human beings have a tendency to just focus on just the attribute. Think of priors as the underlying or the background knowledge which is essentially an additional bit of information in addition to the likelihood. A product of the priors together with likelihood determines the posterior odds/probability.

Rule 2 – Question your existing belief

This is somewhat tricky and counter-intuitive to grasp but question your priors. Present yourself with a hypothesis what if your priors were irrelevant or even wrong? How will that affect your posterior probability? Would the new posterior probability be any different than the existing one if your priors are irrelevant or even wrong?

Rule 3 – Update incrementally

We live in a dynamic world where evidence and attributes are constantly shifting. While it is okay to believe in well-tested priors and likelihoods in the present moment. However, always question does my priors & likelihood still hold true today? In other words, update your beliefs incrementally as new information or evidence surfaces. A good example of this would be the shifting sentiments of the financial markets. What holds true today, may not tomorrow? Hence, the priors and likelihoods must also be incrementally updated.

Conclusion

In conclusion, Bayesian Thinking is a powerful tool to hone your judgment skills. Developing Bayesian Thinking essentially tells us what to believe in and how much confident you are about that belief. It also allows us to shift our existing beliefs in light of new information or as the evidence unfolds. Hopefully, you now have a better understanding of Bayesian Thinking and why is it so important.

On that note, we would like to say DexLab Analytics is a premium data analytics training institute located in the heart of Delhi NCR. We provide intensive training on a plethora of data-centric subjects, including data science, Python and credit risk analytics. Stay tuned for more such interesting blogs and updates!

About the Author: Nish Lau Bakshi is a professional data scientist with an actuarial background and a passion to use the power of statistics to tackle various pressing, daily life problems.


Interested in a career in Data Analyst?

To learn more about Data Analyst with Advanced excel course – Enrol Now.
To learn more about Data Analyst with R Course – Enrol Now.
To learn more about Big Data Course – Enrol Now.

To learn more about Machine Learning Using Python and Spark – Enrol Now.
To learn more about Data Analyst with SAS Course – Enrol Now.
To learn more about Data Analyst with Apache Spark Course – Enrol Now.
To learn more about Data Analyst with Market Risk Analytics and Modelling Course – Enrol Now.

The Almighty Central Limit Theorem

The Almighty Central Limit Theorem

The Central Limit Theorem (CLT) is perhaps one of the most important results in all of the statistics. In this blog, we will take a glance at why CLT is so special and how it works out in practice. Intuitive examples will be used to explain the underlying concepts of CLT.

First, let us take a look at why CLT is so significant. Firstly, CLT affords us the flexibility of not knowing the underlying distribution of any data set provided if the sample is large enough. Secondly, it enables us to make “Large sample inference” about the population parameters such as its mean and standard deviation.

The obvious question anybody would be asking themselves is why it is useful not to know the underlying distribution of a given data set?

To put it simply in real life, often times than not the population size of anything will be unknown. Population size here refers to the entire collection of something, like the exact number of cars in Gurgaon, NCR at any given day. It would be very cumbersome and expensive to get a true estimate of the population size. If the population size is unknown its underlying distribution will be known too and so will be its standard deviation. Here, CLT is used to approximate the underlying unknown distribution to a normal distribution. In a nutshell, we don’t have to worry about knowing the size of the population or its distribution. If the sample sizes are large enough, i.e. – we have a lot of observed data, it takes the shape of a symmetric bell-shaped curve. 

Now let’s talk about what we mean by “Large sample inference”. Imagine slicing up the data into ‘n’ number of samples as below:

Now, each of these samples will have a mean of their own.

Therefore, effectively the mean of each sample is a random variable which follows the below distribution:

Imagine, plotting each of the sample mean on a line plot, and as “n”, i.e. the number of samples goes to infinity or a large number the distribution takes a perfect bell-shaped curve, i.e – it tends to a normal distribution.

Large sample inferences could be drawn about the population from the above distribution of x̅. Say, if you’d like to know the probability that any given sample mean will not exceed quantity or limit.

The Central Limit Theorem has vast application in statistics which makes analyzing very large quantities easy through a large enough sample. Some of these we will meet in the subsequent blogs.

Try this for yourself: Imagine the average number of cars transiting from Gurgaon in any given week is normally distributed with the following parameter . A study was conducted which observed weekly car transition through Gurgaon for 4 weeks. What is the probability that in the 5th week number of cars transiting through Gurgaon will not exceed 113,000?

If you liked this blog, then do please leave a comment or suggestions below.

About the Author: Nish Lau Bakshi is a professional data scientist with an actuarial background and a passion to use the power of statistics to tackle various pressing, daily life problems.

About the Institute: DexLab Analytics is a premier data analytics training institute headquartered in Gurgaon. The expert consultants working here craft the most industry-relevant courses for interested candidates. Our technology-driven classrooms enhance the learning experience.


Interested in a career in Data Analyst?

To learn more about Data Analyst with Advanced excel course – Enrol Now.
To learn more about Data Analyst with R Course – Enrol Now.
To learn more about Big Data Course – Enrol Now.

To learn more about Machine Learning Using Python and Spark – Enrol Now.
To learn more about Data Analyst with SAS Course – Enrol Now.
To learn more about Data Analyst with Apache Spark Course – Enrol Now.
To learn more about Data Analyst with Market Risk Analytics and Modelling Course – Enrol Now.

Upskill and Upgrade: The Mantra for Budding Data Scientists

Upskill and Upgrade: The Mantra for Budding Data Scientists

Have the right skills? Then the hottest jobs of the millennium might be waiting for you! The job profiles of data analysts, data scientists, data managers and statisticians harbour great potentials.

However, the biggest challenge in today’s age lies in preparing novice graduates for Industry 4.0 jobs. Although no one has yet cleared which roles will cease to exist and which new roles will be created, the consultants have started advising students to imbibe necessary skills and up-skill in domains that are likely to influence and carve the future jobs. Becoming adaptive is the best way to sail high in the looming technology-dominated future.

Data Science and Future

In this context, data science has proved to be one of the most promising fields of technology and science that exhibits a wide gap between demand and supply yet an absolute imperative across disciplines. “Today there is no shortage of data or computing abilities but there is a shortage of workforce equipped with the right skill set that can interpret data and get valuable insights,” revealed James Abdey, assistant professorial lecturer Statistics, London School of Economics and Political Science (LSE).

He further added that data science is a multidisciplinary field – drawing collectives from Economics, Mathematics, Finance, Statistics and more.

As a matter of fact, anyone, who has the right skill and expertise, can become a data scientist. The required skills are analytical thinking, problem-solving and decision-making aptitude. “As everything becomes data-driven, acquiring analytical and statistical skill sets will soon be imperative for all students, including those pursuing Social Sciences or Liberal Arts and also for professionals,” said Jitin Chadha, founder and director, Indian School of Business and Finance (ISBF).

DexLab Analytics is one of the most prominent deep learning training institutes seated in the heart of Delhi. We offer state-of-the-art in-demand skill training courses to all the interested candidates.

The Challenges Ahead

The dearth of expert training faculty and obsolete curriculum acts as major roadblocks to the success of data science training. Such hindrances cause difficulty in preparing graduates for Industry 4.0. In this regard, Chiraag Mehta from ISBF shared that by increasing international collaborations and intensifying industry-academia connect, they can formulate an effective solution and bring forth the best practices to the classrooms. “With international collaborations, higher education institutes can bring in the latest curriculum while a deeper industry-academia connect including, guest lecturers from industry players and internships will help students relate the theory to real-world applications, ” shared Mehta during an interview with Education Times.

2

Industry 4.0: A Brief Overview

The concept Industry 4.0 encompasses the potential of a new industrial revolution – where gathering and analyzing data across machines will become the order of the day. The rise of this new digital industrial revolution is expected to facilitate faster, more flexible and efficient processes to manufacture high-quality products at reduced costs – thus, increasing productivity, switch economies, stimulate industrial growth and reform workforce profile.

Want to know more about data science courses in Gurgaon? Feel free to reach us at DexLab Analytics.


The blog has been sourced fromtimesofindia.indiatimes.com/home/education/news/learn-to-upskill-and-be-adaptive/articleshow/68989949.cms


Interested in a career in Data Analyst?

To learn more about Data Analyst with Advanced excel course – Enrol Now.
To learn more about Data Analyst with R Course – Enrol Now.
To learn more about Big Data Course – Enrol Now.

To learn more about Machine Learning Using Python and Spark – Enrol Now.
To learn more about Data Analyst with SAS Course – Enrol Now.
To learn more about Data Analyst with Apache Spark Course – Enrol Now.
To learn more about Data Analyst with Market Risk Analytics and Modelling Course – Enrol Now.

Call us to know more