data analyst institute Archives - Page 10 of 11 - DexLab Analytics | Big Data Hadoop SAS R Analytics Predictive Modeling & Excel VBA

Latest Open Source Tools in Data Analytics Beyond Apache Spark

Latest Open Source Tools in Data Analytics Beyond Apache Spark

In the IT world change is always in the air, but especially in the realm of data analytics, profound change is coming up as open source tools are making a huge impact. Well you may already be familiar with most of the stars in the open source space like Hadoop and Spark. But with the growing demand for new analytical tools which will help to round up the data holistically within the analytical ecosystem. A noteworthy point about these tools is the fact that they can be customized to process streaming data.

With the emergence of the IoT (Internet of things) that is giving rise to numerous devices and sensors which will add to this stream of data production, this forms one of the key trends why we need more advanced data analytics tools. The use of streaming data analysis is used for enhanced drug discovery, and institutes like SETI and NASA are also collaborating with each other to analyze terabytes of data, that are highly complex and stream deep in space radio signals.

2

The Apache Hadoop Spark software has made several headlines in the realm of data analytics that allowed billions of development funds to be showered at it by IBM along with other companies. But along with the big players several small open source projects are also on the rise. Here are the latest few that grabbed our attention:

Apache Drill:

This open source analytics tool has had quite good impact on the analytics realm, so much so that companies like MapR have even included it into their Hadoop distribution systems. This project is a top-level one at Apache and is being leveraged along with the star Apache Spark in many streaming data analytics scenarios.

Like at the New York Apache Drill meeting in January this year, the engineers at MapR system showed how Apache Spark and Drill could be used in tandem in a use cases that involve packet capture and almost real-time search and query.

But Drill is not ideal for streaming data application because it is a distributed schema free SQL engine. People like IT personnel and developers can use Drill to interactively explore data in Hadoop and NoSQL databases for things such as HBase and MongoDB. There is no need to explicitly describe the schemas or maintain them because the Drill has the ability to automatically leverage the structure which is embedded in the data. It is capable of streaming the data in memory between operators and minimizes the use of disks unless you need to complete a query.

Grappa:

Both big and small organizations are constantly working on new ways to cull actionable insights from their data streaming in constantly. Most of them are working with data that are generated in clusters and are relying on commodity hardware. This puts a premium label on affordable data centric work processes. This will do wonders to enhance the functionality and performance of tools such as MapReduce and even Spark. With the open source project Grappa that helps to scale the data intensive applications on commodity clusters and will provide a new type of abstraction which will trump the existing distributed shared memory (DSM) systems.

Grappa is available for free on the GitHub under a BSD license. And to use Grappa one can refer to its quick start guide that is available readily on the README file to build and execute it on a cluster.

These were the latest open source data analytics tools of 2017. For more such interesting news on Big Data analytics and information about analytics training institute follow our daily uploads from DexLab Analytics.


Interested in a career in Data Analyst?

To learn more about Data Analyst with Advanced excel course – Enrol Now.
To learn more about Data Analyst with R Course – Enrol Now.
To learn more about Big Data Course – Enrol Now.

To learn more about Machine Learning Using Python and Spark – Enrol Now.
To learn more about Data Analyst with SAS Course – Enrol Now.
To learn more about Data Analyst with Apache Spark Course – Enrol Now.
To learn more about Data Analyst with Market Risk Analytics and Modelling Course – Enrol Now.
Understanding the Difference Between Factor and Cluster Analysis

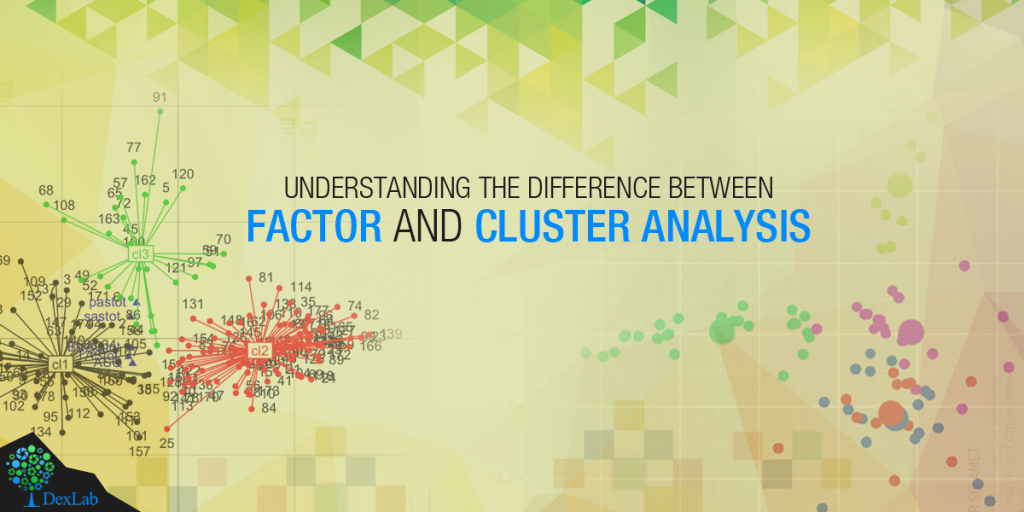
Understanding the Difference Between Factor and Cluster Analysis

Cluster analysis and factor analysis are two different statistical methods in data analytics which are used heavily in analytical methods of subjects like natural sciences and behavioural sciences. The names of these analytical methods are so because both these methods allow the users to divide the data into either clusters or into factors.

Most newly established data analysts have this common confusion that both these methods are almost similar. But while these two methods may look similar on the surface but they differ in several ways including their applications and objectives.

Difference in objectives between cluster analysis and factor analysis:

One key difference between cluster analysis and factor analysis is the fact that they have distinguished objectives. For factor analysis the usual objective is to explain the correlation with a data set and understand how the variables relate to each other. But on the other hand the objective of cluster analysis is to address the heterogeneity in the individual data sets.

Put in simpler words the spirit of cluster analysis is to help in categorization but that of factor analysis are a form of simplification.

Data Science Machine Learning Certification

Difference is solutions:

This is not an easy section for drawing a line of separation in between cluster and factor analysis. That is because the results or solutions obtainable from both these analysis is subjective to their application. But still one could say that with factor analysis provides in a way the ‘best’ solutions to the researcher. This best solution is in the sense that the researcher can optimize a certain aspect of the solution this is known as orthogonality which offers ease of interpretation for the analysts.

But in case of cluster analysis this is not the case. The reasons behind that being all algorithms which can yield the best solutions for cluster analysis are usually computationally incompetent. Thus, researchers cannot trust this method of cluster analysis as it does not guarantee an optimal solution.

Difference in applications:

Cluster analysis and factor analysis differ in how they are applied to data, especially when it comes to applying them to real data. This is because factor analysis can reduce the unwieldy variables sets and boil them down to a smaller set of factors. This makes it suitable for simplifying otherwise complex models of analysis. Moreover, factor analysis also comes with a sort of confirmatory use researchers can use this method to develop a set of hypotheses based on how the variables in the data set are related.  After that the researcher can run a factor analysis to further confirm these hypotheses.

But cluster analysis on the other hand is suitable only for categorizing objects as per certain predetermined criteria. In cluster analysis a researcher can measure selected aspects of say a group of newly discovered plants and then place these plants into categories of species grouped by employing cluster analysis.

Here is an infographic to better explain the difference between cluster analysis and factor analysis: 


Interested in a career in Data Analyst?

To learn more about Data Analyst with Advanced excel course – Enrol Now.
To learn more about Data Analyst with R Course – Enrol Now.
To learn more about Big Data Course – Enrol Now.

To learn more about Machine Learning Using Python and Spark – Enrol Now.
To learn more about Data Analyst with SAS Course – Enrol Now.
To learn more about Data Analyst with Apache Spark Course – Enrol Now.
To learn more about Data Analyst with Market Risk Analytics and Modelling Course – Enrol Now.
Aspiring Data Analysts Must Know the Answer to These Interview Questions

Aspiring data analysts must know the answer to these interview questions

You have recently completed Data analyst certification and are hunting vigorously for a job as a data scientist. But the prospect of sitting for such an important job role at a corporate firm in front of a room full of C-suite interviewers is an intimidating prospect. But fear not as we at DexLab Analytics have got you covered both inside the class room as well out.

This megatrend on Big Data analysts started first in 2013, when the leading universities of the world began to realize the gap in between the demand and supply of Big Data professionals. And soon several , Data analyst training institutes cropped up here and there and rooms transformed into classrooms with several students being keen to learn about the steps to handle Big Data  and to join the ranks of data scientists which is a highly sought after profession of these days. Continue reading “Aspiring Data Analysts Must Know the Answer to These Interview Questions”

A few easy steps to be a SUCCESSFUL Data Scientist

A-few-easy-steps-to-be-a-successful-data-scientist (1)

Data science has soared high for the past few years now; sending the job market into turbo pace where organizations are opening up their C-suite positions for unicorns to take their mountainous heap of data and make sense of it all to generate the big bucks. And professionals from a variety of fields are now eyeing the attractive position of data analyst as a possible profitable career move.

We went about questioning the faculty at our premiere data science and excel dashboard training institute to know how one can emerge as a successful data scientist, in this fast expanding field. We wanted to take an objective position from a recruiter’s point of view and create a list of technical and non-technical skills which are essential to be deemed an asset employee in the field of data science.

Keep Pace with Automation: Emerging Data Science Jobs in India – @Dexlabanalytics.

A noteworthy point to be mentioned here is that every other organization will evaluate skills and knowledge in different tools with varying perspectives. Thus, this list in no way is an exhaustive one. But if a candidate has these songs then he/she will make a strong case in their favor as a potential data scientist.

The technical aspects:

Academia:

Most data scientists are highly educated professionals with more than 88 percent of them having a Master’s degree and 46 percent of them have a PhD degree. There are exceptions to these generalized figures but a strong educational background is necessary for aspiring data scientists to understand the complex subject of data science in depth. The field of data science can be seen in the middle of a Venn diagram with intersecting circles of subjects like Mathematics and Statistics 32%, Engineering 16% and Computer Science and Programming 19%.

Knowledge in applications like SAS and/or R Programming:

In depth knowledge in any one of the above tools is absolutely necessary for aspiring data scientists as these form the foundation of data analysis and predictive modeling. Different companies give preference to different analysis tools from R and SAS, a relatively new open source program that is also slowly being incorporated into companies is Hadoop.

2

For those from a computer science background:

  • Coding skills in Python – the most common coding language currently in use in Python. But some companies may also demand their data scientists to know Perl, C++, Java or C.
  • Understanding of Hadoop environment – not always an absolute necessity but can prove to be advantageous in most cases. Another strong selling point may be experience in Pig or Hive. Acquaintance with cloud based tools like Amazon S3 may also be advantageous.
  • Must have the ability to work with unstructured data with knowledge in NoSQL and must be proficient in executing complex queries in SQL.

Non-technical skills:

  • Impeccable communicational skills so that data personnel can translate their technical findings into non-technical inputs comprehensible by the non-techies like sales and marketing.
  • A strong understanding of the business or the industry the company operates in. leverage the company’s data to achieve its business objectives with strong business acumen.
  • Must have profound intellectual curiosity to filter out the problem areas and find solutions against the same.


Interested in a career in Data Analyst?

To learn more about Data Analyst with Advanced excel course – Enrol Now.
To learn more about Data Analyst with R Course – Enrol Now.
To learn more about Big Data Course – Enrol Now.

To learn more about Machine Learning Using Python and Spark – Enrol Now.
To learn more about Data Analyst with SAS Course – Enrol Now.
To learn more about Data Analyst with Apache Spark Course – Enrol Now.
To learn more about Data Analyst with Market Risk Analytics and Modelling Course – Enrol Now.

Are You a Student of Statistics? – You must know these 3 things

Are you a student of statistics?

We a premiere statistical and data analysis training institute offering courses on Big Data Hadoop, Business intelligence and Ai. We asked our faculty to tell us the three most important things that every student of elementary statistics should know.

So, let us get on with it:

  1. The notion that statistics is about numbers, is in the context only: statistics involves a rich treasure trove of numeric and graphical representation of displaying data to quantify them also it is very important to be capable of generating graphs along with numbers. But that is not the half part of statistics and the main interesting aspect is related to making the big leap from numbers and graphs to the realistic worldly interpretations. Uncannily statistics also poses to be a fascinating philosophical tension raising the question and healthy skepticism about we believe in and what we do not.
  2. The analysis part is not the most crucial part of a statistical study, the most important part lies with the when, where and how of gathering the data. We must not forget when we enter each number or data, calculate and plot the strategies we build on our understanding, but many a times at the time of interpretation that each every graph, data or number is a product of a fallible machine, be it organic or mechanical. If we are able to take proper care at the stage of sampling and observation we will be able to obtain great dividends at the final stage of interpretation and analysis of all our statistical efforts.
  3. All statistical functions off all kinds of mathematical sciences are based on a two-way communication system. This communication system should be between the statistician and non-statistician end. The main aim of statistical analysis is to put forward important social, public and scientific questions. A good statistician knows how to communicate with the public especially with those who are by and large not statisticians. Also the public here plays an important role and must possess simple idea of statistical conclusions to grasp what the statisticians have to say to them. This is an important criterion to be incorporated in the K-12 and college curriculum for elementary statistical students.

Data Science Machine Learning Certification

If you agree with our views and would like to discuss further on statistics and its application on data analysis then feel free drop by DexLab Analytics and stay updated on the latest trends in data management and mining.


Interested in a career in Data Analyst?

To learn more about Data Analyst with Advanced excel course – Enrol Now.
To learn more about Data Analyst with R Course – Enrol Now.
To learn more about Big Data Course – Enrol Now.

To learn more about Machine Learning Using Python and Spark – Enrol Now.
To learn more about Data Analyst with SAS Course – Enrol Now.
To learn more about Data Analyst with Apache Spark Course – Enrol Now.
To learn more about Data Analyst with Market Risk Analytics and Modelling Course – Enrol Now.

Trending Data Job Role: Chief Data Officer

Trending data job role: Chief Data Officer

Financial firms are going berserk in order to employ the best Chief Data Officers from around the world. This is the new hype in the C-suite world who wants to manage risks associated with data and also grasp its opportunities for conducting better business.

These days all financial firms are sincerely focused on maintaining their data and governing them to comply with the latest rules and regulations. They want to comply with customer demands to maintain their competitive edge and stay on top of the game. And in order to maintain this, the financial services teams are on a hyper drive in hiring the C-suite role of a Chief Data Officer i.e. CDO.

Recent developments in the regulatory mandates of Volcker Rule of the Dodd-Frank Act in relation to capital planning have made it difficult for financial organizations to aggregate and manage their data. In a recent stress test a large number of major US corporate banks and other financial institutions have failed as the quality of their data was not up to scratch.

But expert data analyst and scientists state that only regulatory compliance is not the main issue at hand. Effective risk management goes hand-in-hand with efficient data management. And firms are lacking that front as they do not manage their data effectively and are simply gambling with chances of a hug penalty at the risk of losing customers and acquiring a bad name in the business.

2

The opportunities in this position of Chief Data Officer:

While the aspects of regulatory compliance and risk management are becoming more and more complex every day, but that is not the only reason to move up information management positions and invite them into the boardroom. That is why as most financial organizations know that good governance requires strong data management skills with good understanding of architecture and analytics. Companies have come to realize that this kind of information can prove to be effective and provide them with competitive advantage in terms of reaching out to customers and protecting them with the offering of innovative products and services.

According to latest research, experts predicted that 25 percent of every financial organization will have employed a Chief Data Officer by the end of 2015. The job responsibility of this role is still clouded and most organizations are trying to refine and boil it down, but as of now three main roles have been identified – data governance, data analysis and data architecture and technology. While according to this survey 77 percent of the CDOs will remain focused in governance focused but their responsibilities are likely to grow into other areas as well. The main objective behind data architecture is to oversee how data is sourced, integrated and then consumed in the global organizations. The way to lead efficiencies in this respect is to consider this aspect in depth. Thus, it can be concluded that data analytics has the most potential.

For more details on Online Certificate in Business Analytics, visit DexLab Analytics. Their online courses in data science are up to the mark as per industry standards. Check out the course module today.

DexLab Analytics Presents #BigDataIngestion

DexLab Analytics has started a new admission drive for prospective students interested in big data and data science certification. Enroll in #BigDataIngestion and enjoy 10% off on in-demand courses, including data science, machine learning, hadoop and business analytics.


Interested in a career in Data Analyst?

To learn more about Machine Learning Using Python and Spark – click here.
To learn more about Data Analyst with Advanced excel course – click here.
To learn more about Data Analyst with SAS Course – click here.
To learn more about Data Analyst with R Course – click here.
To learn more about Big Data Course – click here.

Interesting Statistics of Employment: 5 Figures

Interesting Statistics of Employment: 5 Figures

It is a common sight to see the old and young talking about the job market that is going through a slump, regardless of the time or the economic conditions of the country; this picture usually is accompanied with some “cutting chai” at tea stalls on busy streets or cool cafes at the malls with the slurp of espresso with a tiny straw where the average upper-middle class youth talk about their first-world dreams while breathing progressive third-world air.

But is that really always the case? Data management or statistical analysis as we have established several times before, is sending the job market into hyper-drive, attracting millions of MNCs into the Indian soil and populating the job search portals with millions of opportunities in data.  But dare we only make statements, we are statisticians and we know that numbers do speak louder than simple statements.

So, in keeping with our love for figures and facts backed by data, DexLab Analytics has compiled a list of interesting statistics about the job market and the process of hiring.

#1 Each and every major corporate job position attracts a minimum of 250 applications!

Out of all these applications only 4 to 6 resumes get shortlisted and are called for interviews. Out of these 4 to 6 people only 1 lucky candidate is selected.

#2 Every job seeker takes into account 5 factors before accepting the position at a firm.

They are –

  • The company culture, values and overall work environment
  • Distance, ease of commute, location
  • Prospects of maintaining work/life balance
  • Growth prospects in career and
  • Pay package and compensation.

#3 Almost 94 percent of sales personnel revealed that base salary is the most important determining factor in the compensation package for them.

But 62 percent of sales personnel say that commission is the most important element.

#4 Out of 3 employees at least 2 say that most employers do not do or do not know how to use social media platforms for promoting job openings.

And 3 out of 4 employees also believe that most companies and employers do not know how to promote their brand on social media networks as well.

#5 Social media platforms are used to search for jobs by 79 percent of jobseekers.

This figure rises to 86 percent for younger job seekers who are in their initial 10 years of job search.

To learn more about statistical analysis and for Data analyst certification in Gurgaon drop by our website at DexLab Analytics.


Interested in a career in Data Analyst?

To learn more about Data Analyst with Advanced excel course – Enrol Now.
To learn more about Data Analyst with R Course – Enrol Now.
To learn more about Big Data Course – Enrol Now.

To learn more about Machine Learning Using Python and Spark – Enrol Now.
To learn more about Data Analyst with SAS Course – Enrol Now.
To learn more about Data Analyst with Apache Spark Course – Enrol Now.
To learn more about Data Analyst with Market Risk Analytics and Modelling Course – Enrol Now.

Data analysis resources to keep you updated

Data analysis resources to keep you updated

One should always be proactive about building upon what they already know and have learnt, and with explosion of the web such resources can be obtained fairly easily. The problem is not the availability of resources but the abundance from it. Due to the availability of too many choices it often becomes difficult to gauge if the sources are actually authentic.

2

So, here is a list of books, websites and other resources which we think are authentic:

To stay on top of the latest trends and analyses reports and what’s new in the realm of analytics here are the best latest blogs:

  • FiveThirtyEight: the main man behind this blog is Nate Silver, a data whiz kid, this blog is the place to find out data analysis and visualizations of political, economic and cultural issues. The content in his blogs are usually light-hearted and interactive yet pointed with illustrative examples of data can be used in day-to-day activities.
  • Flowing Data: this is an interesting blog where Dr. Nathan Yau, PhD reveals how the data personnel – like designers, analysts, scientists and statisticians can analyze and visualize data to gather a better understanding of the world around us. It is especially fun to read as Yau offers a funny approach about the regular challenges faced by a data professional in this field. One can also find job recommendations, tutorials and other resources in this blog.
  • Simply statistics: this is another blog that is managed by expert professors each from Ivy League colleges like Johns Hopkins University, Harvard University and the Dana Ferber Cancer Institute. These professors also talk about how data is being used or misused around the world in different industries.
  • Hunch: this blog has been created by John Langford from Microsoft Research, he is the doctor of learning there and his blog talks about machine learning basics of what we know and how we use what we know. This is a good read for those who are new in the field of machine learning and do not yet know how things work in machine learning as it provides an in-depth view of new ideas and events going on in this industry.

To connect to other fellow data scientists and analysts to inquire about questions that may arise while you try the tread the treacherous roads of the data world, these are few communities of data analysts you can follow.

    1. Kaggle competitions: this is a popular community that all data scientists are likely to come across. This is a platform where one can find data prediction competitors. This is a platform where one can search for upcoming competitions in data analysis the website also features a forum where a visitor can ask any question or find a partner for the competition, share resources and ask for support to make a good career in data science.
    2. Metaoptimize: this is a question and answer community for people who are into machine learning, natural language processing, data mining and more. Badges are awarded as per votes on questions are awarded. Thus, making it becomes simpler for the visitors to discover the most popular helpful answers to the questions.
    3. Datatau: this website is best described as hacker news for data scientists and it lives up to this description to the last word. People share career advice with each other; interesting articles are shared amongst the users and then commented upon also the people here share useful information to those new to the world of data analytics.
    4. DexLab Analytics blogs: while DexLab Analytics is one of the leading data analytics training institute in Gurgaon, but they maintain regular blogs about the latest developments in the field of data science and provide India-specific as well global data related news. For students pursuing or aspiring to pursue a career in data science must follow the daily posts from this institute.

In conclusion we would like to add that while there are several resources from where one can obtain valuable information about data analysis. Thus, keeping this list as a starting point you can find several other experts out there to help you learn more about data analytics.


Interested in a career in Data Analyst?

To learn more about Data Analyst with Advanced excel course – Enrol Now.
To learn more about Data Analyst with R Course – Enrol Now.
To learn more about Big Data Course – Enrol Now.

To learn more about Machine Learning Using Python and Spark – Enrol Now.
To learn more about Data Analyst with SAS Course – Enrol Now.
To learn more about Data Analyst with Apache Spark Course – Enrol Now.
To learn more about Data Analyst with Market Risk Analytics and Modelling Course – Enrol Now.
Measuring Why Correlation does not Causation

How about we first examine the thought of the connection and its application in the process of data analysis? Connection analysis is being utilized to distinguish or evaluate the relationship between two quantitative variables. The existence of variables should be between either dependent or free variable. To quantify between the reaction and indicator variable ‘r’ is used, which is the Connection Coefficient. The connection coefficient’s indication shows the affiliation’s bearing. The bearing should be either positive affiliation or negative affiliation. For instance, a connection of r = 0.95 demonstrates an in number, positive relationship between the two variables. Then again, if a relationship r = – 0.3 demonstrates a powerless, negative relationship between the two variables. The size of the relationship coefficient demonstrates the affiliation’s quality. In connection analysis, we can fall upon just four situations of affiliation.

qualitative

Situation 1 – The two variables have an in-number positive connection where r = 0.9

Situation 2 – The two variables have a powerless relationship where r = 0.3

Situation 3 – The two variables do not have any connection where r = 0

Situation 4 – The two variables have an in-number negative connection where r = – 0.9

Utilization of Case Correlation:

Promotion supervisor needs to distinguish the discriminating variable that is influencing the Conversion Rate of a site.

Business administrators need to discover whether the web journal redesign, identified with free arrival of online games, is creating the extra offer of income on the agreed day.

DayVisitors – Free Online Games Release UpdateRevenue
1180001500
2120001200
3150001600
410000900
58000950
6140001300
7120001100
8160001650
9100001050
10200001600

You may utilize excel function CORREL () in order to recognize the connection coefficient to quantify the relationship between the guests and the income. The relationship coefficient r for the aforementioned set of data is 0.90. It demonstrates that there is a solid relationship between the variable guests and income. Another flawless case for an in-number negative relationship is that at whatever point the precipitation diminishes, the horticulture’s yield diminishes. The relationship analysis likewise serves to further develop the analysis in multivariate insights.


Connection does not infer Causation:

This happens as soon as you attempt to discover the relationship between two autonomous variables or between an indigent variable and free variable. Association does not infer Causation implies those occasions that take place to correspond with one another – are not as a matter essentially related in a causal manner. This might be passed on that the variable X does not have an impact on the variable Y. It’s only an occurrence. We need to further accept or make it a theory that X is bringing about the impact on the Y variable. In the aforementioned utilization case, we discovered that the connection coefficient was at 0.89. It just demonstrates that there is a solid relationship between our Y Variable income and the X variable guests. Nonetheless, we don’t have any verification that if there is an expansion in the guests then the income additionally increments. No circumstances and end results is oblique here.

Call us to know more