data analyst course in delhi Archives - Page 4 of 8 - DexLab Analytics | Big Data Hadoop SAS R Analytics Predictive Modeling & Excel VBA

Databricks Supports Apache Spark 2.4 and Adds ML Runtime

Databricks Supports Apache Spark 2.4 and Adds ML Runtime

Databricks recently embraced the Apache Spark 2.4, a latest version. They are integrating it into their platform of analytics. Also, the company is on its way to unveil another runtime feature that would simplify the intricacies of deep learning.

Needless to say, Databricks is one of the most powerful supporters of version 2.4 of Spark, the notable stream processing framework.  The latest upgraded version features improvement in the performance of machine learning framework running on Spark as well as distributed deep learning. It also includes modifications that would instantly address dependency issues related to deep learning tasks.

Project Hydrogen is an ambitious initiative; it’s under this tag the Spark upgrades were fused and introduced as a new scheduling mode, known as ‘barrier execution’. It encourages developers to embed training in lieu of distributed deep learning posed as an Apache Spark workload.

In context to above, Reynold Xin, a staunch Spark contributor and co-founder at Databricks said, “This is the largest change to Spark’s scheduler since the inception of the project.” He further mentioned that the upgrades will actually help reduce the complexities of machine learning structures and ensure high efficacy.

The latest runtime detail categorized HorovodRunner is developed to rationalize scaling and streamlining of distributed deep learning workloads. It is performed from a single machine to huge clusters. Previously, drifting from single-node workloads to huge distributed training on GPU or CPU clusters needed a bunch of full code rewrites – it was exceedingly challenging enough. Undeniably, HorovodRunner reduces training as well as programming time cutting down them from hours to a few minutes. This was claimed by the professionals working at Databricks.

Besides Horovod, Databricks is found to be saying that its platform offers native integration with TensorFlow, Kera and several other machine learning programs coupled with MLib and GraphFrames super machine learning algorithms.

On top of all this, a few weeks back, Databricks associated itself with a versatile cloud data integrator Talend with a sole aim to integrate the cloud service with their own data analytics platform to allow data scientists leverage the cluster computing framework – it would help process large data sets at scale.
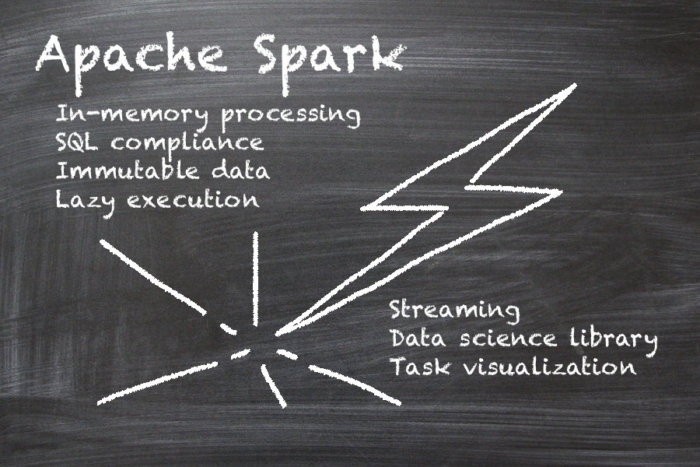
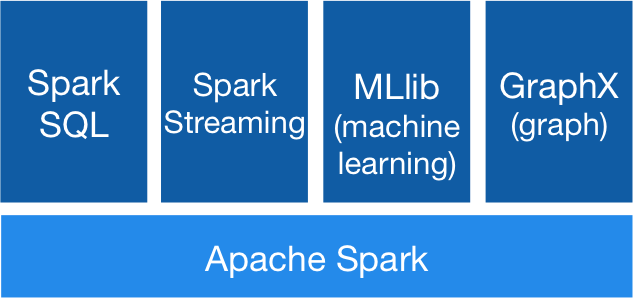
About Apache Spark:

Apache Spark is a robust, well-integrated analytics engine efficient in processing large datasets. Crafted for high speed, productivity and generic use, it is considered as one of the most popular projects in motion under Apache software umbrella. It is also one of the most volatile and active open source big data projects.

DexLab Analytics is a top-notch Apache Spark training institute in Gurgaon. It provides top of the line in-demand skill training on a plethora of new-age IT related courses, such as data science, data analytics courses, big data, risk analytics and more.


The blog was sourced from ― www.datanami.com/2018/11/19/databricks-upgrades-spark-support-adds-ml-runtime


Interested in a career in Data Analyst?

To learn more about Data Analyst with Advanced excel course – Enrol Now.
To learn more about Data Analyst with R Course – Enrol Now.
To learn more about Big Data Course – Enrol Now.

To learn more about Machine Learning Using Python and Spark – Enrol Now.
To learn more about Data Analyst with SAS Course – Enrol Now.
To learn more about Data Analyst with Apache Spark Course – Enrol Now.
To learn more about Data Analyst with Market Risk Analytics and Modelling Course – Enrol Now.

Private Banks, Followed by E-commerce and Telecom Industry Shows High Adoption Rates for Data Analytics

Private Banks, Followed by E-commerce and Telecom Industry Shows High Adoption Rates for Data Analytics

Are you looking for a data analyst job? The chances of bagging a job at a private bank are more than that a public bank. The former is more likely to hire you than the latter.

As a matter of fact, data analytics is widely being used in the private banking and e-commerce sectors – according to a report on the state of data analytics in Indian business. The veritable report was released last month by Analytics India Magazine in association with the data science institute INSOFE. Next to banking and ecommerce, telecom and financial service sectors have started to adopt the tools of data analytics on a larger scale, the report mentioned.

The report was prepared focusing on 50 large firms across myriad sectors, namely Maruti Suzuki and Tata Motors in automobiles, ONGC and Reliance Industries under oil-drilling and refineries, Zomato and Paytm under e-commerce tab, and HDFC and the State Bank of India in banking.

2

If you follow the study closely, you will discover that in a nutshell, data analytics and data science boasts of a healthy adoption rate all throughout – 64% large Indian firms has started implementing this wonder tool at their workplaces. As a fact, if a firm is found to have an analytics penetration rate of minimum 0.75% (which means, at least one analytics professional is found out of 133 employees in a company), we can say the company has adopted analytics.

Nevertheless, the rate of adoption was not universal overall. We can see that infrastructure firms have zero adoption rates – this might be due to a lack of resources to power up a robust analytics facility or whatever. Also, steel, power and oil exhibited low adoption rates as well with not even 40% of the surveyed firms crossing the 0.75% bar. On contrary, private banks and telecom industry showed a total 100% adoption rates.

Astonishingly, public sector banks showed a 50% adoption rate- almost half of the rate in the private sector.

The study revealed more and more companies in India are looking forward to data analytics to boost sales and marketing initiatives. The tools of analytics are largely employed in the sales domain, followed by finance and operations.

Apparently, not much of the results were directly comparable with that of the last year’s study. Interestingly, one metric – analytics penetration rate – was measured last year as well, which is nothing but the ratio of analytics-oriented employees to the total. Also, last year, you would have found one out of 59 employees in an average organization, which has now reached one data analyst for every 36 employees.

For detailed information, read the full blog here: qz.com/india/1482919/banks-telcos-e-commerce-firms-hire-most-data-analysts-in-india

If you are interested in following more such interesting blogs and technology-related updates, follow DexLab Analytics, a premium analytics training institute headquartered in Gurgaon, Delhi. Grab a data analyst certification today and join the bandwagon of success.


Interested in a career in Data Analyst?

To learn more about Data Analyst with Advanced excel course – Enrol Now.
To learn more about Data Analyst with R Course – Enrol Now.
To learn more about Big Data Course – Enrol Now.

To learn more about Machine Learning Using Python and Spark – Enrol Now.
To learn more about Data Analyst with SAS Course – Enrol Now.
To learn more about Data Analyst with Apache Spark Course – Enrol Now.
To learn more about Data Analyst with Market Risk Analytics and Modelling Course – Enrol Now.

6 Essential Skills Data Scientists Need to Add to Their Resumes

6 Essential Skills Data Scientists Need to Add to Their Resumes

Like all other career paths, cracking the hottest job of 21st century is mainly about gaining knowledge and developing important skills relevant to the job. And your resume should reflect all these skills. So what must the resume of a professional data scientist look like? Here are 6 key skills that must be in the fingertips of a good data scientist.

Stats and Math:

Not only blue-chip tech companies, even medium and small scale enterprises are operated by data science these days. And statistical knowledge is vital for that. You should be thorough with general statistical concepts, like distributions, tests, range, likelihood estimators, etc.

In mathematics, one must know the basics of linear algebra and multivariable calculus. This will definitely make a difference in your work outcomes as it enables you to improve predictive presentations.

2

Excellent Programming and Computing Skills:

Simply put, being good at coding is a must. So, if you are a budding data scientist you must actively work towards developing a computing mind; you should be able to understand, write and even analyze code whenever necessary. This level of dexterity only comes through meticulous study and practice of not one, but a number of programming languages.

If you want to develop a programming skill which is especially designed for data scientists, then get enrolled for R programming certification. Over 40 percent data scientists prefer R for solving stat problems. But it must be noted that R isn’t easy to learn, especially for those who aren’t comfortable with codes.

Python is another language which is highly preferred by data scientists because it is very adaptable and hence, can be employed in all the different steps part of a data science project. Moreover, data sets can be created with ease and SQL tables can be imported into working codes when required. Considering these benefits and the fact that over 50% data scientists favor Python, an excellent Python Certification in Delhi should be first in your list of courses to undertake.

Live Projects

Learning isn’t effective unless you implement it practically. Moreover, your skills get duly appreciated when it’s demonstrated. Hence, always look for live projects you can join and try to understand the data architecture behind the screen. It may be up there in your head, but it needs to be implemented. Large companies actually prefer candidates who have more practical experience rather than just bookish knowledge.

Managing Unstructured Data

Unstructured data is any type of content that doesn’t fit into traditional database tables. These data types aren’t well organized and hence, sorting them becomes very difficult. Blogs, videos and customer reviews are some examples of unstructured data. Being able to manage unstructured data is an important skill for data scientists. Apache Hadoop, NoSQL and Microsoft HDI insight are some good software for tackling unstructured data. If you are interested to learn the techniques, you can look up the course details for Hadoop certification in Delhi at DexLab Analytics.

Storytelling with Data

Data scientists might have to work with complicated models and datasets, but they must know how to express their deductions in lucid language that’s simple and engaging. Hence their raw data must be expressed in the form of tables, charts and graphs, which are visually appealing and can capture the attention of stakeholders.

Academics and Degrees

A strong educational background is the door to the world of data science. Big companies prefer applicants who are master degree holders in either stats or math or computer science or physical science.

Data science is definitely the trendiest job and you might be eager to land one, but it’s not easy to acquire the above mentioned skills. If you are looking for guidance from experts who have previously worked in this field, then you should get enrolled for Data Science Courses in Delhi right away. The industry experts at DexLab Analytics tailor the courses to the unique needs of students and incorporate ample practical cases to help them get ready for the challenges ahead.


Reference: www.analyticsindiamag.com/7-things-data-scientists-must-have-in-their-resumes


Interested in a career in Data Analyst?

To learn more about Data Analyst with Advanced excel course – Enrol Now.
To learn more about Data Analyst with R Course – Enrol Now.
To learn more about Big Data Course – Enrol Now.

To learn more about Machine Learning Using Python and Spark – Enrol Now.
To learn more about Data Analyst with SAS Course – Enrol Now.
To learn more about Data Analyst with Apache Spark Course – Enrol Now.
To learn more about Data Analyst with Market Risk Analytics and Modelling Course – Enrol Now.

Data Driven Projects: 3 Questions That You Need to Know

Data Driven Projects: 3 Questions That You Need to Know

Today, data is an asset. It’s a prized possession for companies – it helps derive crucial insights about customers, thus future business operations. It also boosts sales, predicts product development and optimizes delivery chains.

Nevertheless, several recent reports suggest that even though data floats around in abundance, a bulk of data-driven projects fail. In 2017 alone, Gartner highlighted 60% of big data projects fail – so what leads it? Why the availability of data still can’t ensure success of these projects?

2

Right data, do I have it?

It’s best to assume the data which you have is accurate. After all, organizations have been keeping data for years, and now it’s about time they start making sense out of it. The challenge that they come across is that this data might give crucial insights about past operations, but for present scenario, they might not be good enough.

To predict the future outcomes, you need fresh, real-time data. But do you know how to find it? This question leads us to the next sub-head.

Where to find relevant data?

Each and every company does have a database. In fact, many companies have built in data warehouses, which can be transformed into data lakes. With such vast data storehouses, finding data is no more a difficult task, or is it?

Gartner report shared, “Many of these companies have built these data lakes and stored a lot of data in them. But if you ask the companies how successful are you doing predictions on the data lake, you’re going to find lots and lots of struggle they’re having.”

Put simply, too many data storehouses may pose a challenge at times. The approach, ‘one destination for all data in the enterprise’ can be detrimental. Therefore, it’s necessary to look for data outside the data warehouses; third party sources can be helpful or even company’s partner network.

How to combine data together?

Siloed data can be calamitous. Unsurprisingly, data is available in all shapes and is derived from numerous sources – software applications, mobile phones, IoT sensors, social media platforms and lot more – compiling all the data sources and reconciling data to derive meaningful insights can thus be extremely difficult.

However, the problem isn’t about the lack of technology. A wide array of tools and software applications are available in the market that can speed up the process of data integration. The real challenge lies in understanding the crucial role of data integration. After all, funding an AI project is no big deal – but securing a budget to address the problem of data integration efficiently is a real challenge.

In a nutshell, however data sounds all promising, many organizations still don’t know how achieve full potential out of data analytics. They need to strengthen their data foundation, and make sure the data that is collected is accurate and pulled out from a relevant source.

A good data analyst course in Gurgaon can be of help! Several data analytics training institutes offer such in-demand skill training course, DexLab Analytics is one of them. For more information, visit their official site.

The blog has been sourced fromdataconomy.com/2018/10/three-questions-you-need-to-answer-to-succeed-in-data-driven-projects


Interested in a career in Data Analyst?

To learn more about Data Analyst with Advanced excel course – Enrol Now.
To learn more about Data Analyst with R Course – Enrol Now.
To learn more about Big Data Course – Enrol Now.

To learn more about Machine Learning Using Python and Spark – Enrol Now.
To learn more about Data Analyst with SAS Course – Enrol Now.
To learn more about Data Analyst with Apache Spark Course – Enrol Now.
To learn more about Data Analyst with Market Risk Analytics and Modelling Course – Enrol Now.

Human Element Remains Critical for Enhanced Digital Customer Experience

Human Element Remains Critical for Enhanced Digital Customer Experience

Digital customer engagement and service is trending the charts. Companies are found actively focusing on establishing long-lasting relationships in sync with customer expectations to hit better results and profitable outcomes. Customers are even hopeful about businesses implementing smart digital channels to solve complex service issues and finish transactions.

70 % of customers expect companies to have a self-service option in their websites and 50% expect to solve issues concerning products or services themselves – according to Zendesk.

In this regard, below we’ve charted down a few ways to humanize the customer experience, keeping the human aspect in prime focus:

2

Adding Human Element through Brand Stories

Each brand tells a story. But, how, or in what ways do the brands tell their story to the customers? Is it through videos or texts? Brand’s history or values need to be iterated in the right voice to the right audience. Also, the companies must send a strong message saying how well they value their customers and how they always put their customers in the first place, before anything else.

Additionally, the company’s sales team should always look forward to help their customers with after-purchase information – such as how well the customers are enjoying certain features, whether any improvement is needed and more – valuable customer feedback always help at the end of the day!

AI for Feedback

Identify prospective customers who are becoming smarter day by day. This is done via continuous feedback loops along with automated continuous education. Whenever you receive feedback from a specific customer interaction, it’s advised to feed it back to their profile. An enclosed feedback loop is quite important to gain meaningful information about customers and their purchasing pattern. This is the best way to know well your customers and determine what they want and how.

Time and again, customers are asked by brands to take part in specific surveys and rate their services, describing what their feelings are about those particular products or services. All this helps comprehend customer’s satisfaction quotient regarding services, and in a way helps you take necessary action in enhancing customer experience.

Personalized Content for Customer Satisfaction

Keeping customers interested in your content is the key. Become a better story-teller and enhance customer satisfaction. Customers like it when you tell your brand’s story in your own, innovative way. But, of course, marketers face a real challenge when writing down an entertaining story, not appearing like written by agency but themselves.

A token of advice from our side – never go too rigid; be original, and try to narrate the story in an interactive way. To craft a unique brand story, the essence lies in using little wit, humor and a dash of self-effacement to add a beat to the brand.

End Notes

As parting thoughts, we would like to say always act in real-time, and better understand what your customers what and their behavioral traits. This way it would be easier to predict their next move. What’s more, your brand should be people-based and make intelligent use of customer’s available data to develop a deeper understating about your users and their respective needs.

DexLab Analytics is a prime data analyst training institute in Delhi – their data analyst training courses is as per industry standards and brimmed with practical expertise merged with theoretical knowledge. Visit the website now.

 
The blog has been sourced fromdataconomy.com/2018/08/how-to-keep-the-human-element-in-digital-customer-experience
 

Interested in a career in Data Analyst?

To learn more about Data Analyst with Advanced excel course – Enrol Now.
To learn more about Data Analyst with R Course – Enrol Now.
To learn more about Big Data Course – Enrol Now.

To learn more about Machine Learning Using Python and Spark – Enrol Now.
To learn more about Data Analyst with SAS Course – Enrol Now.
To learn more about Data Analyst with Apache Spark Course – Enrol Now.
To learn more about Data Analyst with Market Risk Analytics and Modelling Course – Enrol Now.

5 Incredible Techniques to Lift Data Analysis to the Next Level

5 Incredible Techniques to Lift Data Analysis to the Next Level

Today, it’s all about converting data into actionable insights. How much data an organization collects from a plethora of sources is all companies cares of. To understand the intricacies of the business operations and helps team identify future trends, data is the power.

Interestingly, there’s more than one way to analyze data. Depending on your requirement and types of data you need to have, the perfect tool for data analytics will fluctuate. Here, we’ve 5 methods of data analysis that will help you develop more relevant and actionable insights.

DexLab Analytics is a premier data analytics training institute in Noida. It offers cutting edge data analyst courses for data enthusiasts.

2

Difference between Quantitative and Qualitative Data:

What type of data do you have? Quantitative or qualitative? From the name itself you can guess quantitative deal is all about numbers and quantities. The data includes sales numbers, marketing data, including payroll data, revenues and click-through rates, and any form of data that can be counted objectively.

Qualitative data is relatively difficult to pin down; they tend to be more subjective and explanatory. Customer surveys, interview results of employees and data that are more inclined towards quality than quantity are some of the best examples of qualitative data. As a result, the method of analysis is less structured and simple as compared to quantitative techniques.

Measuring Techniques for Quantitative Data:

Regression Analysis

When it comes to making forecasts and predictions and future trend analysis, regression studies are the best bet. The tool of regression measures the relationship between a dependent variable and an independent variable.

Hypothesis Testing

Widely known as ‘T Testing’, this type of analytics method boosts easy comparison of data against the hypothesis and assumptions you’ve made regarding a set of operations. It also allows you to forecast future decisions that might affect your organization.

Monte Carlo Simulation

Touted as one of the most popular techniques to determine the impact of unpredictable variables on a particular factor, Monte Carlo simulations implement probability modeling for smooth prediction of risk and uncertainty. This type of simulation uses random numbers and data to exhibit a series of possible outcomes for any circumstance based on any results. Finance, engineering, logistics and project management are a few industries where this incredible tool is widely used.

Measuring Techniques for Qualitative Data:

Unlike quantitative data, qualitative data analysis calls for more subjective approaches, away from pure statistical analysis and methodologies. Though, you still will be able to extract meaningful information from data by employing different data analysis techniques, subject to your demands.

Here, we’ve two such techniques that focus on qualitative data:

Content Analysis

It works best when working with data, like interview data, user feedback, survey results and more – content analysis is all about deciphering overall themes emerging out of a qualitative data. It helps in parsing textual data to discover common threads focusing on improvement.

Narrative Analysis

Narrative analysis help you understand organizational culture by the way ideas and narratives are communicated within an organization. It works best when planning new marketing campaigns and mulling over changes within corporate culture – it includes what customers think about an organization, how employees feel about their job remuneration and how business operations are perceived.

Agreed or not, there’s no gold standard for data analysis or the best way to perform it. You have to select the method, which you deem fit for your data and requirements, and unravel improved insights and optimize organizational goals.

 
The blog has been sourced fromwww.sisense.com/blog/5-techniques-take-data-analysis-another-level
 

Interested in a career in Data Analyst?

To learn more about Data Analyst with Advanced excel course – Enrol Now.
To learn more about Data Analyst with R Course – Enrol Now.
To learn more about Big Data Course – Enrol Now.

To learn more about Machine Learning Using Python and Spark – Enrol Now.
To learn more about Data Analyst with SAS Course – Enrol Now.
To learn more about Data Analyst with Apache Spark Course – Enrol Now.
To learn more about Data Analyst with Market Risk Analytics and Modelling Course – Enrol Now.

How Data Analytics Should Be Managed In Your Company, and Who Will Lead It?

How Data Analytics Should Be Managed In Your Company, and Who Will Lead It?

In the last couple of years, data management strategies have revolutionized a lot. Previously, the data management used to come under the purview of the IT department, while data analytics was performed based on business requirements. Today, a more centralized approach is being taken uniting the roles of data management and analytics – thanks to the growing prowess of predictive analytics!

Predictive analytics has brought in a significant change – it leverages data and extracts insights to enhance revenue and customer retention. However, many companies are yet to realize the power of predictive analytics. Unfortunately, data is still siloed in IT, and several departments still depend on basic calculations done by Excel.

But, of course, on a positive note, companies are shifting focus and trying to recognize the budding, robust technology. They are adopting predictive analytics and trying to leverage big data analytics. For that, they are appointing skilled data scientists, who possess the required know-how of statistical techniques and are strong on numbers.

2

Strategizing Analytical Campaigns

An enterprise-wide strategy is the key to accomplish analytical goals and how. Remember, the strategy should be encompassing and incorporate needful laws that need to be followed, like GDPR. This signifies effective data analytics strategies begin from the top.

C-suite is a priority for any company, especially which looks forward to defining data and analytics, but each company also require a designated person, who would act as a link between C-suite and the rest of the company. This is the best way to mitigate the wrong decisions and ineffective strategies that are made in silos within the organization.

Chief Data Officers, Chief Analytics Officers and Chief Technology Officers are some of the most popular new age job designations that have come up. Eminent personalities in these fetching positions play influential roles in strategizing and executing a successful corporate-level data analytics plan. The main objective of them is to provide analytical support to the business units, determine the impact of analytical strategies and ascertain and implement innovative analytical prospects.

Defensive Vs Offensive Data Strategy

To begin, defensive strategy deals with compliance with regulations, prevention of theft and fraud detection, while offensive strategy is about supporting business achievements and strategizing ways to enhance profitability, customer retention and revenue generation.

Generally, companies following a defensive data strategy operate across industries that are heavily regulated (for example, pharmaceuticals, automobile, etc.) – no doubt, they need more control on data. Thus, a well-devised data strategy has to ensure complete data security, optimize the process of data extraction and observe regulatory compliance.

On the other hand, offensive strategy requires more tactical implementation of data. Why? Because they perform in a more customer-oriented industry. Here, the analytics have to be more real-time and their numerical value will depend on how quickly they can arrive at decisions. Hence, it becomes a priority to equip the business units with analytical tools along with data. As a result, self-service BI tools turns out to be a fair deal. They are found useful. Some of the most common self-service BI vendors are Tableau and PowerBI. They are very easy to use and deliver the promises of flexibility, efficacy and user value.  

As final remarks, the sole responsibility of managing data analytics within an organization rests on a skilled team of software engineers, data analysts and data scientists. Only together, they would be able to take the charge of building successful analytical campaigns and secure the future of the company.

For R Predictive Modelling Certification, join DexLab Analytics. It’s a premier data science training platform that offers top of the line intensive courses for all data enthusiasts. For more details, visit their homepage.


The blog has been sourced from dataconomy.com/2018/09/who-should-own-data-analytics-in-your-company-and-why


Interested in a career in Data Analyst?

To learn more about Data Analyst with Advanced excel course – Enrol Now.
To learn more about Data Analyst with R Course – Enrol Now.
To learn more about Big Data Course – Enrol Now.

To learn more about Machine Learning Using Python and Spark – Enrol Now.
To learn more about Data Analyst with SAS Course – Enrol Now.
To learn more about Data Analyst with Apache Spark Course – Enrol Now.
To learn more about Data Analyst with Market Risk Analytics and Modelling Course – Enrol Now.

Best Data Science Interview Questions to Get Hired Right Away

Best Data Science Interview Questions to Get Hired Right Away

Data scientists are big data ninjas. They tackle colossal amounts of messy data, and utilize their imposing skills in statistics, mathematics and programming to collect, manage and analyze data. Next, they combine all their analytic abilities – including, industry expertise, encompassing knowledge and skepticism to unravel integral business solutions of meaningful challenges.

But how do you think they become such competent data wranglers? Years of experience or substantial pool of knowledge, or both? In this blog, we have penned down the most important interview data questions on data science – it will only aid you crack tough job interviews but also will test your knowledge about this promising field of study.

2

DexLab Analytics offers incredible Data Science Courses in Delhi. Start learning from the experts!

What do you mean by data science?

Data is a fine blend of statistics, technical expertise and business acumen. Together they are used to analyze datasets and predict the future trend.

Which is more appropriate for text analytics – R or Python?

Python includes a very versatile library, known as Pandas, which helps analysts use advanced level of data analysis tools and data structures. R doesn’t have such a feature. Therefore, Python is the one that’s highly suitable for text analytics.

Explain a Recommender System.

Today, a recommender system is extensively deployed across multiple fields – be it music recommendations, movie preferences, search queries, social tags, research and analysis – the recommender system works on a person’s past to build a model to predict future buying or movie-viewing or reading pattern in the individual.

What are the advantages of R?

  • A wide assortment of tools available for data analysis
  • Perform robust calculations on matrix and array
  • A well-developed yet simple programming language is R
  • It supports an encompassing set of machine learning applications
  • It poses as a middleman between numerous tools, software and datasets
  • Helps in developing ace reproducible analysis
  • Offers a powerful package ecosystem for versatile needs
  • Ideal for solving complex data-oriented challenges

What are the two big components of Big Data Hadoop framework?

HDFS – It is the abbreviated form of Hadoop Distributed File System. It’s the distributed database that functions over Hadoop. It stores and retrieves vast amounts of data in no time.

YARN – Stands for Yet Another Resource Negotiator. It aims to allocate resources dynamically and manage workloads.

How do you define logistic regression?

Logistic regression is nothing but a statistical technique that analyzes a dataset and forecasts significant binary outcomes. The outcome has to be in either zero or one or a yes or no.

How machine learning is used in real-life?

Following are the real-life scenarios where machine learning is used extensively:

  • Robotics
  • Finance
  • Healthcare
  • Social media
  • Ecommerce
  • Search engine
  • Information sharing
  • Medicine

What do you mean by Power Analysis?

Power analysis is best defined as the process of determining sample size required for determining an impact of a given size from a cause coupled with a certain level of assurance. It helps you understand the sample size estimate and in the process aids you in making good statistical judgments.

To get an in-depth understanding on data science, enroll for our intensive Data Science Certification – the course curriculum is industry-standard, backed by guaranteed placement assistance.

The blog has been sourced fromintellipaat.com/interview-question/data-science-interview-questions

Interested in a career in Data Analyst?

To learn more about Data Analyst with Advanced excel course – Enrol Now.
To learn more about Data Analyst with R Course – Enrol Now.
To learn more about Big Data Course – Enrol Now.

To learn more about Machine Learning Using Python and Spark – Enrol Now.
To learn more about Data Analyst with SAS Course – Enrol Now.
To learn more about Data Analyst with Apache Spark Course – Enrol Now.
To learn more about Data Analyst with Market Risk Analytics and Modelling Course – Enrol Now.

3 Potent IoT Challenges That Keeps Data Scientists Always on Toes

3 Potent IoT Challenges That Keeps Data Scientists Always on Toes

The job responsibility of data scientists is no mean feat. They stay under a lot of pressure. A wide number of stumbling blocks are laid in front of them, which makes it really difficult for them to secure the long-shot business goals and objectives.

As prevention is better than cure – being aware of the challenges always help data scientists plot the shortest and smartest route to success, and we can’t agree more. Brace yourselves! Below, we’ve enumerated some of the challenges data scientists face while getting started with an IoT project:

2

Inferior Data Quality

Messy data is life and soul of data scientists. Irrespective of business scale, the job of every data scientist is to organize data in the correct manner. But, however organizing them may require adequate time as well as hard work.

A fundamental rule – avoid manual data, wherever possible. Intelligent data compilation is the final key to high quality data, which is a prerequisite for favorable company operation. It includes crisp communication, regular anomaly detection, logic determination and well-defined industry standards. Another way to tame your data can be through application integration tools – they are a fabulous way to automate data entry and lessen escalation of typographical errors, individual eccentricities, staggering spellings and more from the data.

Once data is in the right format and quality, data scientists can start slicing off the data they don’t need any more, which takes us to the next step.

For Data Science Certification, drop by DexLab Analytics.

Shedding Out Excessive Data

Though big data is found in abundance, too much of data can also pose a substantial challenge. This is why employing superior data selection techniques and minimizing features are supported, they help eliminate unwanted chaos cutting through what matters the most.

What happens is that when data becomes excessively large, we often end up developing high-end predictive models that fails to deliver productive results. But, on the other hand, if you track the events, giving importance to validation and testing routines, the outcomes will spell perfection. And that’s what we are looking forward to.

Predictive Analytics is the Key

IoT has made predictive analytics a daunting reality. Owing to its critical business significance, predictive analytics is quickly accelerating along the priority ladder of IoT stakeholders. However, take a note, this breed of analytics may not be fruitful in every instance. It’s imperative to begin your analytics endeavor by clearly defining your module’s objective, followed by needed research and valuation.

Next, you need to sync in with subject matter pundits to ascertain which predictions will lead you closer to fulfilling the business objectives. Following to this, you have to be sure that you have all the data required to make prediction. In other cases, you can re-set goals, anytime.

Find the best Data Science Courses in Noida… At DexLab Analytics. Get detailed information on the website.


The blog has been sourced from — www.networkworld.com/article/3305329/internet-of-things/3-iot-challenges-that-keep-data-scientists-up-at-night.html


Interested in a career in Data Analyst?

To learn more about Data Analyst with Advanced excel course – Enrol Now.
To learn more about Data Analyst with R Course – Enrol Now.
To learn more about Big Data Course – Enrol Now.

To learn more about Machine Learning Using Python and Spark – Enrol Now.
To learn more about Data Analyst with SAS Course – Enrol Now.
To learn more about Data Analyst with Apache Spark Course – Enrol Now.
To learn more about Data Analyst with Market Risk Analytics and Modelling Course – Enrol Now.

Call us to know more