Autocorrelation is a special case of correlation. It refers to the relationship between successive values of the same variables .For example if an individual with a consumption pattern:-
spends too much in period 1 then he will try to compensate that in period 2 by spending less than usual. This would mean that Ut is correlated with Ut+1 . If it is plotted the graph will appear as follows :
Positive Autocorrelation : When the previous year’s error effects the current year’s error in such a way that when a graph is plotted the line moves in the upward direction or when the error of the time t-1 carries over into a positive error in the following period it is called a positive autocorrelation. Negative Autocorrelation : When the previous year’s error effects the current year’s error in such a way that when a graph is plotted the line moves in the downward direction or when the error of the time t-1 carries over into a negative error in the following period it is called a negative autocorrelation.
Now there are two ways of detecting the presence of autocorrelation By plotting a scatter plot of the estimated residual (ei) against one another i.e. present value of residuals are plotted against its own past value.
If most of the points fall in the 1st and the 3rd quadrants , autocorrelation will be positive since the products are positive.
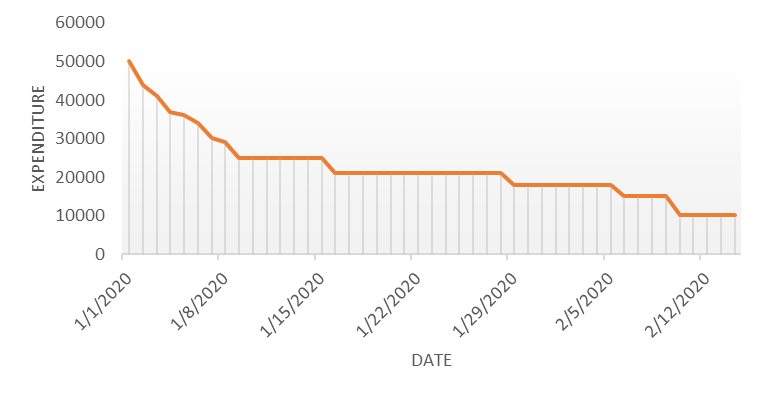
If most of the points fall in the 2nd and 4th quadrant , the autocorrelation will be negative, because the products are negative. By plotting ei against time : The successive values of ei are plotted against time would indicate the possible presence of autocorrelation .If e’s in successive time show a regular time pattern, then there is autocorrelation in the function. The autocorrelation is said to be negative if successive values of ei changes sign frequently. First Order of Autocorrelation (AR-1) When t-1 time period’s error affects the error of time period t (current time period), then it is called first order of autocorrelation. AR-1 coefficient p takes values between +1 and -1 The size of this coefficient p determines the strength of autocorrelation. A positive value of p indicates a positive autocorrelation. A negative value of p indicates a negative autocorrelation In case if p = 0, then this indicates there is no autocorrelation. To explain the error term in any particular period t, we use the following formula:-
Where Vt= a random term which fulfills all the usual assumptions of OLS How to find the value of p?
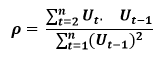
One can estimate the value of ρ by applying the following formula :-
Data Smoothing is done to better understand the hidden patterns in the data. In the non- stationary processes, it is very hard to forecast the data as the variance over a period of time changes, therefore data smoothing techniques are used to smooth out the irregular roughness to see a clearer signal.
In this segment we will be discussing two of the most important data smoothing techniques :-
Moving average smoothing
Exponential smoothing
Moving average smoothing
Moving average is a technique where subsets of original data are created and then average of each subset is taken to smooth out the data and find the value in between each subset which better helps to see the trend over a period of time.
Lets take an example to better understand the problem.
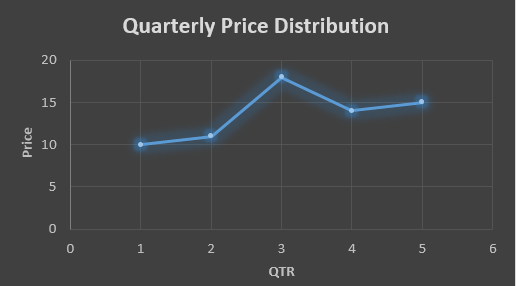
Suppose that we have a data of price observed over a period of time and it is a non-stationary data so that the tend is hard to recognize.
QTR (quarter)
Price
1
10
2
11
3
18
4
14
5
15
6
?
In the above data we don’t know the value of the 6th quarter.
….fig (1)
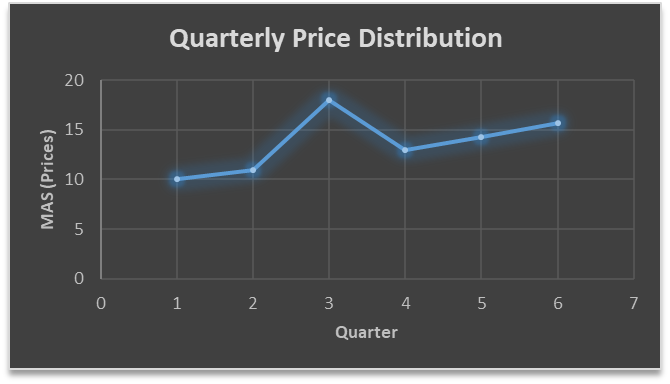
The plot above shows that there is no trend the data is following so to better understand the pattern we calculate the moving average over three quarter at a time so that we get in between values as well as we get the missing value of the 6th quarter.
To find the missing value of 6th quarter we will use previous three quarter’s data i.e.
MAS = = 15.7
QTR (quarter)
Price
1
10
2
11
3
18
4
14
5
15
6
15.7
MAS = = 13
MAS = = 14.33
QTR (quarter)
Price
MAS (Price)
1
10
10
2
11
11
3
18
18
4
14
13
5
15
14.33
6
15.7
15.7
….. fig (2)
In the above graph we can see that after 3rd quarter there is an upward sloping trend in the data.
Exponential Data Smoothing
In this method a larger weight ( ) which lies between 0 & 1 is given to the most recent observations and as the observation grows more distant the weight decreases exponentially.
The weights are decided on the basis how the data is, in case the data has low movement then we will choose the value of closer to 0 and in case the data has a lot more randomness then in that case we would like to choose the value of closer to 1.
EMA= Ft= Ft-1 + (At-1 – Ft-1)
Now lets see a practical example.
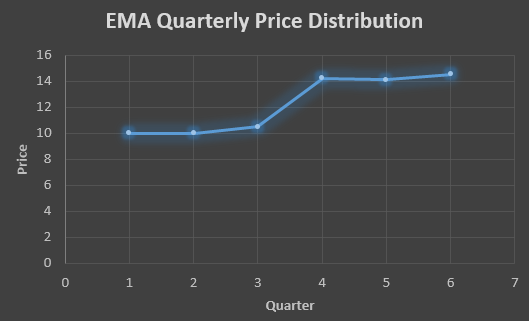
For this example we will be taking = 0.5
Taking the same data……
QTR (quarter)
Price
(At)
EMS Price(Ft)
1
10
10
2
11
?
3
18
?
4
14
?
5
15
?
6
?
?
To find the value of yellow cell we need to find out the value of all the blue cells and since we do not have the initial value of F1 we will use the value of A1. Now lets do the calculation:-
F2=10+0.5(10 – 10) = 10
F3=10+0.5(11 – 10) = 10.5
F4=10.5+0.5(18 – 10.5) = 14.25
F5=14.25+0.5(14 – 14.25) = 14.13
F6=14.13+0.5(15 – 14.13)= 14.56
QTR (quarter)
Price
(At)
EMS Price(Ft)
1
10
10
2
11
10
3
18
10.5
4
14
14.25
5
15
14.13
6
14.56
14.56
In the above graph we see that there is a trend now where the data is moving in the upward direction.
So, with that we come to the end of the discussion on the Data smoothing method. Hopefully it helped you understand the topic, for more information you can also watch the video tutorial attached down this blog. The blog is designed and prepared by Niharika Rai, Analytics Consultant, DexLab AnalyticsDexLab Analytics offers machine learning courses in Gurgaon. To keep on learning more, follow DexLab Analytics blog.
The job of a data scientist is one that is challenging, exciting and crucial to an organization’s success. So, it’s no surprise that there is a rush to enroll in a Data Science course, to be eligible for the job. But, while you are at it, you also need to have the awareness regarding the job responsibilities usually bestowed upon the data scientists in a business organization and you would be surprised to learn that the responsibilities of a data scientist differs from that of a data analyst or, a data engineer.
So, what is the role and responsibility of a data scientist? Let’s take a look.
The common idea regarding a data scientist role is that they analyze huge volumes of data in order to find patterns and extract information that would help the organizations to move ahead by developing strategies accordingly. This surface level idea cannot sum up the way a data scientist navigates through the data field. The responsibilities could be broken down into segments and that would help you get the bigger picture.
Data management
The data scientist, post assuming the role, needs to be aware of the goal of the organization in order to proceed. He needs to stay aware of the top trends in the industry to guide his organization, and collect data and also decide which methods are to be used for the purpose. The most crucial part of the job is the developing the knowledge of the problems the business is trying solve and the data available that have relevance and could be used to achieve the goal. He has to collaborate with other departments such as analytics to get the job of extracting information from data.
Data analysis
Another vital responsibility of the data scientist is to assume the analytical role and build models and implement those models to solve issues that are best fit for the purpose. The data scientist has to resort to data mining, text mining techniques. Doing text mining with python course can really put you in an advantageous position when you actually get to handle complex dataset.
Developing strategies
The data scientists need to devote themselves to tasks like data cleaning, applying models, and wade through unstructured datasets to derive actionable insight in order to gauge the customer behavior, market trends. These insights help a business organization to decide its future course of action and also measure a product performance. A Data analyst training institute is the right place to pick up the skills required for performing such nuanced tasks.
Collaborating
Another vital task that a data scientist performs is collaborating with others such as stakeholders and data engineers, data analysts communicating with them in order to share their findings or, discussing certain issues. However, in order to communicate effectively the data scientists need to master the art of data visualization which they could learn while pursuing big data courses in delhi along with deep learning for computer vision course. The key issue here is to make the presentation simple yet effective enough so that people from any background can understand it.
The above mentioned responsibilities of a data scientist just scratch the surface because, a data scientist’s job role cannot be limited by or, defined by a couple of tasks. The data scientist needs to be in synch with the implementation process to understand and analyze further how the data driven insight is shaping strategies and to which effect. Most importantly, they need to evaluate the current data infrastructure of the company and advise regarding future improvement. A data scientist needs to have a keen knowledge of Machine Learning Using Python, to be able to perform the complex tasks their job demands.
Ever since the world woke up to discover the significance of data, there has been tremendous advancement in this field each taking us further towards the utilization of accumulated data to achieve a higher level of efficiency. Predictive analytics is all about extracting hidden information in data and combining technologies like machine learning, artificial intelligence, data analysis, statistical modeling to predict future trends.
Sifting through stored datasets comprising structured and unstructured data, predictive analytics identifies the patterns hidden and analyzes those patterns to make predictions about trends and thereby helps to identify opportunities as well as risk factors. Not just forecasting, but predictive analytics also helps you find associations that could lead you to a new breakthrough. Having undergone big data training in gurgaon, could actually prove to be a big boost for someone planning on working in this specialized field. Now, when you have access to data-based forecasting, it is easy for you to identify both negative and positive trends and in turn, it helps you take the right decisions.
Businesses especially rely heavily on predictive analytics for market analysis, targeting their customers, and assessing risk factors. Unlike before when these business strategies were based on mere guesswork, now the think-tank has access to data to anticipate an outcome.
Predictive analytics models: Predictive analytics models could be classified into two broad categories as follows
Classification models: In this model data is categorized on the basis of some specified criterion.
Regression models: Regression models focus on identifying patterns that already exist, or, that has been continuing for a while.
So, what are the processes involved in Predictive analytics?
Predictive analytics process could be broken down to different stages and let’s take a look at what the steps are
Defining the Project: This is the first stage when you decide what kind of outcome you are expecting. Besides setting out clear business objectives you also need to be clear about the deliverables as these will have a bearing on your data collection.
Collecting all Data: This is the second stage where data from different sources are collected.
Analyzing Data: In this stage, the data collected is cleaned and gets structured and also gets transformed and modeled.
Statistics: A statistical model is used to test the assumptions, hypotheses, as well as findings.
Modeling: Through multi-model evaluation best option is chosen from an array of available options. So, the idea is to create an accurate predictive model.
Deployment: This is the stage of deploying the predictive model and create an option for deploying the results for productive purposes in reality.
monitoring: the final and an important stage where the models created are monitored and tested with new data sets to check whether the models still have relevance.
The applications of predictive analytics
Predictive analytics models have found usage across industries
In the financial sector, predictive analytics could be used for credit risk measurement, detecting fraud as well as for minimizing the risk, and also for retaining customers.
In the field of healthcare predictive analytics could be used for detecting severe health complications that might develop in a patient in the future.
In business predictive analytics could be used for short-term or, long-term sales forecasting. In fact, the reaction of the customer could be anticipated and changes could be made accordingly.
When a huge investment is involved predictive analytics could help to identify the problematic areas that could pose risk. Accurate risk assessment could help a company secure a better ROI.
Predictive analytics could help companies with their customer service, marketing campaigns, sales goals. Companies can strategize better to retain customers and improve their relations with them.
With predictive analytics in place, it would be easier to predict equipment maintenance needs and it could also be used for forecasting an equipment failure.
Predictive analytics is being adopted in a number of industries ranging from insurance to healthcare. The forecasting that one gets is highly accurate. However, building a reliable dataset and building a reliable model is essential. Having trained personnel on the team who have done data analyst course in delhi, could be helpful.
Big data is certainly is getting a lot of hype and for good reasons. Different sectors ranging from business to healthcare are intent on harnessing the power of data to find solutions to their most imminent problems. Huge investments are being made to build models, but, there are some niggling issues that are not being resolved.
So what are the big challenges the data science industry is facing?
Managing big data
Thanks to the explosion of information now the amount of data being created every year is adding to the already overstocked pile, and, most of the data we are talking about here is unstructured data. So, handling such a massive amount of raw data that is not even in a particular database is a big challenge that could only be overcome by implementing advanced tools.
Lack of skilled personnel
One of the biggest challenges the data science industry has to deal with is the shortage of skilled professionals that are well equipped with Data Science training. The companies need somebody with specific training to manage and process the datasets and present them with the insight which they can channelize to develop business strategies. Sending employees to a Data analyst training institute can help companies address the issue and they could also consider making additional efforts for retaining employees by offering them a higher remuneration.
Communication gap
One of the challenges that stand in the way, is the lack of understanding on the part of the data scientists involved in a project. They are in charge of sorting, cleaning, and processing data, but before they take up the responsibility they need to understand what is the goal that they are working towards. When they are working for a business organization they need to know what the set business objective is, before they start looking for patterns and build models.
Data integration
When we are talking about big data, we mean data pouring from various sources. The myriad sources could range from emails, documents, social media, and whatnot. In order to process, all of this data need to be combined, which can be a mammoth task in itself. Despite there being data integration tools available, the problem still persists. Investment in developing smarter tools is the biggest requirement now.
Data security
Just the way integrating data coming from different sources is a big problem, likewise maintaining data security is another big challenge especially when interconnectivity among data sources exists. This poses a big risk and renders the data vulnerable to hacking. In the light of this problem, procuring permission for utilizing data from a source becomes a big issue. The solution lies in developing advanced machine learning algorithms to keep the hackers at bay.
Data validity
Gaining insight from data processing could only be possible when that data is free from any sort of error. However, sometimes data hailing from different sources could show disparity regardless of being about the same subject. Especially in healthcare, for example, patient data when coming from two different sources could often show dissimilarity. This poses a serious challenge and it could be considered an extension of the data integration issue. Advanced technology coupled with the right policy changes need to be in place to address this issue, otherwise, it would continue to be a roadblock.
The challenges are there, but, recognizing those is as essential as continuing research work to finding solutions. Institutes are investing money in developing data science tools that could smoothen the process by eliminating the hurdles. Accessing big data courses in delhi, is a good way to build a promising career in the field of data science, because despite there being challenges the field is full big opportunities.
The term big data refers to the massive amount of data being generated from various sources that need to be sorted, processed, and analyzed using advanced data science tools to derive valuable insight for different industries. Now, big data comprises structured, semi-structured, and mostly unstructured data. Processing this huge data takes skill and expertise and which only someone with Data Science training would be able to do.
The concept of big data is relatively new and it started emerging post the arrival of internet closely followed by the proliferation of advanced mobile devices, social media platforms, IoT devices, and all other myriad platforms that are the breeding grounds of user-generated data. Managing and storing this data which could be in text, audio, image formats is essential for not just businesses but, for other sectors as well. The information data holds can help in the decision-making process and enable people to understand the vital aspects of an issue better.
The characteristics of big data
Now, any data cannot be classified as big data, there are certain characteristics that define big data and getting in-depth knowledge regarding these characteristics can help you grasp the concept of big data better. The main characteristics of big data could be broken down into 5Vs.
What are the 5Vs of data?
The 5Vs of data basically refers to the core elements of big data, the presence of which acts as a differentiating factor. Although many argue in favor of the essential 3 VS, other pundits prefer dissecting data as per 5Vs. These 5Vs denote Volume, Velocity, Variety, Veracity, Value the five core factors but, not necessarily in that order. However, Volume would always be the element that lays the foundation of big data. Pursuing a Data Science course would further clarify your idea of big data.
Volume
This concept is easier to grasp as it refers to the enormous amount of data being generated and collected every day. This amount is referred to as volume, the size of data definitely plays a crucial role as storing this data is posing a serious challenge for the companies. Now the size of the data would vary from one industry to the other, the amount of data an e-commerce site generates would vary from the amount generated on a popular social media platform like Facebook. Now, only advanced technology could handle and process and not to mention deal with the cost and space management issue for storing such large volumes of data.
Velocity
Another crucial feature of big data is velocity which basically refers to the speed at which data is generated and processed, analyzed, and moved across platforms to deliver insight in real-time if possible. Especially, in a field like healthcare the speed matters, crucial trading decisions that could result in loss or profit, must also be taken in an instant. Only the application of advanced data science technology can collect data points in an instant and process those at a lightning speed to deliver results. Another point to be noted here is the fact that just like volume the velocity of data is also increasing.
Variety
The 3rd V refers to the variety, a significant aspect of big data that sheds light on the diversity of data and its sources. As we already know that the data now hails from multiple sources, including social media platforms, IoT devices, and whatnot. The problem does not stop there, the data is also diverse in terms of format such as videos, texts, images, audios and it is a combination of structured and unstructured data. In fact, almost 80%-90% of data is unstructured in nature. This poses a big problem for the data scientists as sorting this data into distinct categories for processing is a complicated task. However, with advanced data science technologies in place determining the relationship among data is a lot hassle-free process now.
Veracity
It is perhaps the most significant aspect of all other elements, no matter how large datasets you have and in what variety, if the data is messy and inaccurate then it is hardly going to be of any use. Data quality matters and dirty data could be a big problem especially because of the fact that data comes from multiple sources. So, you have apparently no control, the problems range from incomplete data to inconsistency of information. In such situations filtering the data to extract quality data for analysis purposes is essential. Pursuing Data science using python training can help gain more skill required for such specific tasks.
Value
The 5th V of big data refers to the value of the data we are talking about. You are investing money in collecting, storing, and processing the big data but if it does not generate any value at the end of the day then it is completely useless. Managing this massive amount of data requires a big investment in advanced infrastructure and additional resources, so, there needs to be ROI. The data teams involved in the process of collecting, sorting, and analyzing the data need to be sure of the quality of data they are handling before making any move.
The significance of big data in generating valuable insight is undeniable and soon it would be empowering every industry. Further research in this field would lead to the development of data science tools for handling big data issues in a more efficient manner. The career prospects in this field are also bright, training from a Data analyst training institute can help push one towards a rewarding career.
In the competitive world of business, branding plays a pivotal role in making sure that your company can rise above the noise and be noticed. The concept of branding thrives on the dual power of brand recognition and brand recall meaning the customer’s ability to identify your brand among a host of other similar products.
Creating brand awareness is a crucial task for any business done through carefully measured and planned strategies. Familiarizing the audience with a specific brand takes time and apt utilization of all available communication platforms.
What role data science can play in devising branding strategy?
The emergence of online shopping, as well as the proliferation of communication channels, are making the job complicated for marketers, along with the explosion of information sources causing an exponential increase in data generation. The large data if assessed correctly can reveal useful information regarding customers and allow them to make data-driven branding strategies. Data Science training is required for enabling the professionals to help companies assess valuable data.
Handling this vast data can baffle any seasoned marketing team, but, with the application of data science tools and techniques manipulating and extracting valuable information becomes easier. Not just that, but, the marketing team now has the power to peek into customer preferences to angle their branding strategy the right away to make their imprint on the customer’s mind.
So, here is how branding is getting smarter
Personalized messages
Data science allows the marketers to assess the customer data spread across various channels including social media platforms. When analyzed this data points the marketers towards the customers’ buying habits, preferences, and they can develop a message for individual customers keeping these preferences in mind. Marketing personnel having undergone customer market analysis courses would be able to guide their team better.
When a brand approaches a specific customer with recommendations specifically tailored to their preferences they tend to return to that brand. Furthermore, it also helps them to find reasons why the customers change buying decision midcourse and leave a site, or, product page. Data analysis will assess that behavior and offer insight.
Another factor to consider here is that the marketing team can also find the errors in their previous marketing campaigns contained in past data through the right analysis.
Shaper social media strategy
Accessing social media platforms to target customers is a strategy all marketers resort to, after all, a huge chunk of their target audience spends a significant amount of time here. However, creating content and aiming it randomly at all platforms or, some platforms based on guesswork can go for a toss.
Data collected regarding social media usage patterns of customers can point the strategists towards the platforms to invest in. A certain section of their targeted customers might spend time on Twitter, while another segment might veer towards Instagram. So, identifying those platforms for specific segments and delivering content accordingly needs data-backed insight. Assessing data patterns can help marketers position their brands on the right platform.
Delivering the right content
Brands reach out to the target audience via different types of content that they promote across various channels to gain customer attention and push their brand identity. However, their strategy is often very loosely based on an assumption that might go wrong. Engaging the customer gets a lot easier if the team puts the data-driven insight into their content marketing plan.
Data regarding customer age, gender, personal interests, the time they spend over different types of content and what they retweet, or, share on their timeline matters. The team can gain a perspective analyzing the search data of customers to understand what they are looking for and what kind of content resonates with which demographic. Data analysis can solve this entire puzzle and enable the team to devise a content marketing strategy accordingly.
When the customers find that a specific brand has the answers to their queries and offers meaningful information they will naturally gravitate towards it.
Assess brand performance
Application of data science tools can not only lead towards measuring customer behavior but also allow the company to assess its performance. Data could reveal valuable information regarding the bounce rate, the social media image of the brand, customer reviews all of that to point out the problem areas that need immediate attention.
The insight gained from the data could help the team to collaborate with other teams to work on the problem areas and make changes. This does send out a positive message regarding the brand which continuously works to improve itself.
Understanding the value of data is vital for any brand wishing to win customers’ hearts. Applying data science tools to process this data requires skill. Companies should invest in building a team comprising data scientists, analysts to get the job done. They can also train their personnel by sending them to Data analyst training institute.
The growing significance of big data and the insight it imparts is of utmost significance. Data scientists are working round the clock to process the massive amount of data generated every day. However, unless you have been through Data Science training, it would be impossible for you to grasp even an iota of what is being communicated through data.
The patterns, outliers every single important factor that emerged through decoding must be presented in a coherent format for the untrained eyes. Data visualization enables the researchers to present data findings visually via different techniques and tools to enable people to grasp that information easily.
Why data visualization is so vital?
The complicated nuances of data analysis is not easier for anybody to understand. As we humans are programmed to gravitate towards a visual representation of any information, it makes sense to convey the findings through charts, graphs, or, some other way. This way it takes only a couple of moments for the marketing heads to process what is the trend to watch out for.
We are used to seeing and processing the information presented through bars and pie charts in company board meetings, people use these conventional models to represent company sales data.
It only makes sense to narrate what the scientists have gathered from analyzing complex raw data sets, via visual techniques to an audience who needs that information to form data-driven decisions for the future.
So what are the different formats and tools of data visualization?
Data visualization can take myriad forms which may vary in the format but, these all have one purpose to serve representing data in an easy to grasp manner. The data scientist must be able to choose the right technique to relate his data discovery which should not only enlighten the audience but, also entertain them.
The popular data visualization formats are as follows
Area Chart Bubble Cloud/Chart Scatter Plot Funnel Chart Heat Map The formats should be adopted in accordance with the information to be communicated
Data scientists also have access to smart visualization tools which are
Qlikview
Datawrapper
Sisense
FusionCharts
Plotly
Looker
Tableau
A data scientist must be familiar with the tools available and be able to decide on which suits his line of work better.
What are the advantages of data visualization?
Data visualization is a tricky process while ensuring that the audience does not fall asleep during a presentation, data scientists also need to identify the best visualization techniques, which they can learn during big data training in gurgaon to represent the relationship, comparison or, some other data dynamic. If and when done right data visualization has several benefits to offer
Enables efficient analysis of data
In business, efficient data interpretation can help companies understand trends. Data visualization allows them quickly identify and grasp the information regarding company performance hidden in the data and enables them to make necessary changes to the strategy.
Identify connections faster
While representing information regarding the operational issues of an organization, data visualization technique can be of immense help as it allows to show connections among different data sets with more clarity. Thereby enabling the management to quickly identify the connecting factors.
Better performance analysis
Using certain visualizing techniques it is easier to present a product or, customer-related data in a multi-dimensional manner. This could provide the marketing team with the insight to understand the obstacles they are facing. Such as the reaction of a certain demographic to a particular product, or, it could also be the demand for certain products in different areas. They are able to act faster to solve the niggling issues this way.
Adopt the latest trends
Data processing can quickly identify the emerging trends, and with the help of data visualization techniques, the findings could be quickly represented in an appealing manner to the team. The visual element can immediately communicate which trends are to watch out for and which might no longer work.
Encourages interaction
Visual representation of data allows the strategists to not just look at numbers but, actually understand the story being told through the patterns. It encourages interaction and allows them to delve deeper into the patterns, instead of just merely looking at some numbers and making assumptions.
Data visualization is certainly aiding the businesses to gain an insight that was lost to them earlier. A data scientist needs to be familiar with the sophisticated data visualization tools and must strike a balance between the data and its representation. Identifying what is unimportant and which needs to be communicated as well as finding an engaging visual technique to quickly narrate the story is what makes him an asset for the company. A premier Data analyst training institute can help hone the skills of an aspiring data scientist through carefully designed courses.
As different sectors are waking up to realize the significance of big data, the law firms are also catching up. After all it is one of the sectors that have to deal with literally massive amounts of data.
The popularity of legal analytics software like Premonition is a pointer to the fact that even though the industry was initially slow on the uptake, it is now ready to harness the power of big data to derive profit.
So what exactly is legal analytics?
Legal analytics involves application of data analysis to mine legal documents and dockets to derive valuable insight. Now there is no need to confuse it with legal research or, to think that it is an alternative to the popular practice. Legal analytics is all about detecting patterns in past case records to enable firms strategize better in future. It basically aims to offer aid in legal research. Training received in an analytics lab could help a professional achieve proficiency.
Legal analytics platform combines sophisticated technologies of machine learning, NLP. It goes through past unstructured data and via cleaning and organizing that data into a coherent structure it analyzes the data to detect patterns.
How law firms can benefit from legal analytics?
Law firms having to deal with exhaustive data holding key information can truly gain advantage with the application of legal analytics. Primarily because of the fact it would enable them to anticipate what the possible outcome might be in order to strategize better and increase their chances of turning a case in their favor. Data Science training could be of immense value for firms willing to adopt this technology.
Not just that but implementation of legal analytics could also help the law firms whether big or, small run their operations and market their service in a more efficient manner and thereby increasing the percentage of ROI.
The key advantages of legal analytics could be as followed
The chances of winning a case could be better as by analyzing the data of past litigations, useful insight could be derived regarding the key issues like duration, judge’s decision and also certain trends that might help the firm develop a smarter strategy to win a particular case.
Cases often continue for a long period before resulting in a loss. To save money and time spent on a particular case, legal analytics could help lawyers decide whether to continue on or, to settle.
Often legal firms need to hire outside expertise to help with their case, the decision being costly in nature must be backed by data. With legal analytics it would be easier to go through data regarding a particular candidate and his performance in similar cases in the past.
There could be a significant improvement in the field of operational efficiency. In most of the situations lawyers spend huge amount of time in sorting through case documents and other data. This way they are wasting their time in finding background information when they could be spending time in offering consultation to a potential client and securing another case thereby adding financial benefit to the firm. The task of data analysis should better be handled by the legal analytics software.
At the end of the day a law firm is just another business, so, to ensure that the business operations of the firm are being managed with efficiency, legal analytics software could come in handy. Whether it’s budgeting or, recruiting or retaining old staff valuable insight could be gained, which could be channeled to rake in more profit.
There has been an increase in the percentage of law firms which have adopted legal analytics, but, overall this industry is still showing reluctance in fully embracing the power. The professionals who have apprehension they need to set aside the bias they have and recognize the potential of this technology. May be they should consider enrolling in a Data analyst training institute to gain sharper business insight.