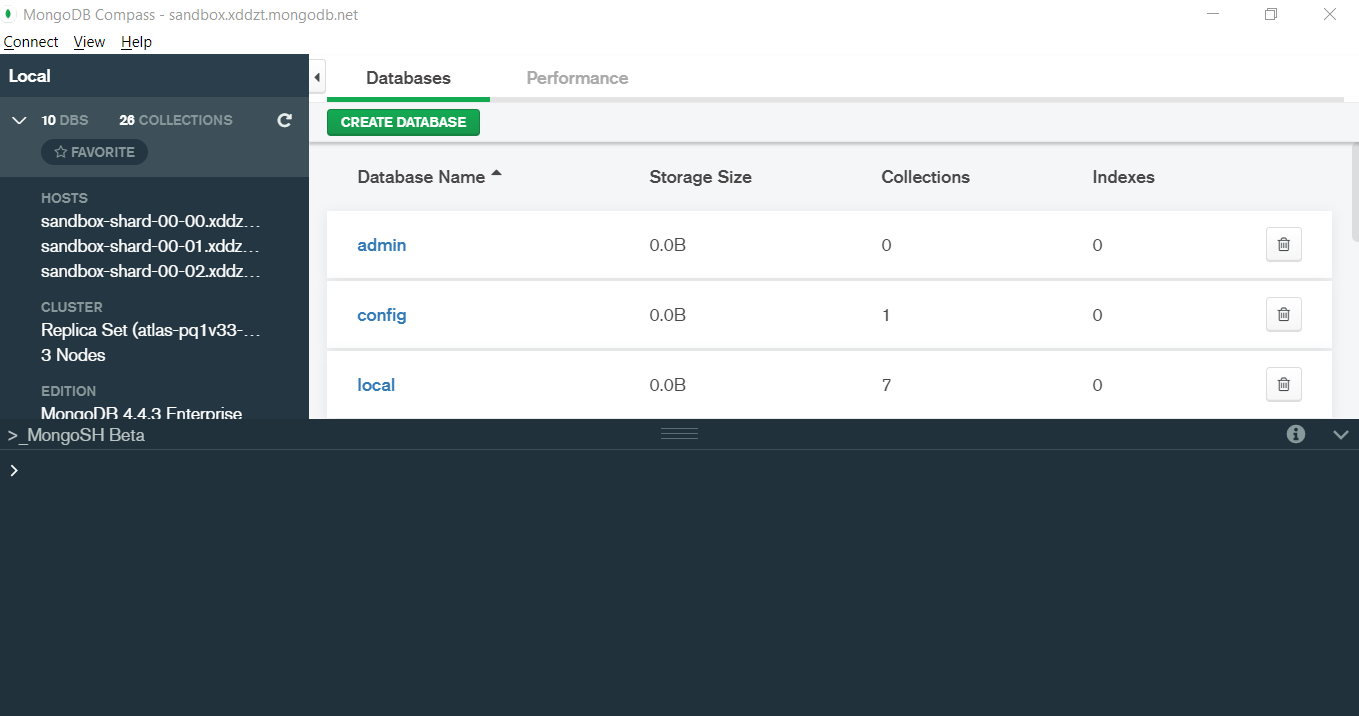
In this particular blog we will discuss about few of the basic functions of MQL (MongoDB Query Language) and we will also see how to use them? We will be using MongoDB Compass shell (MongoSH Beta) which is available in the latest version of MongoDB Compass.
Connect your Atlas cluster to your MongoDB Compass to get started. Latest version of MongoDB Compass will have this shell, so if you don’t find this shell then please install the latest version for this to work.
Now lets start with the functions.
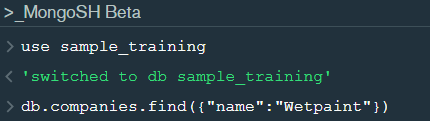
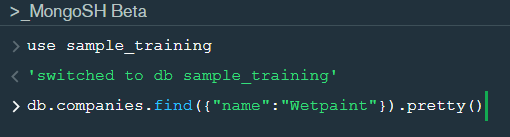
find() :- You need this function for data extraction in the shell.
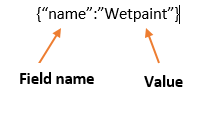
In the shell we need to first write the “use database name” code to access the database then use .find() to extract data which has name “Wetpaint”
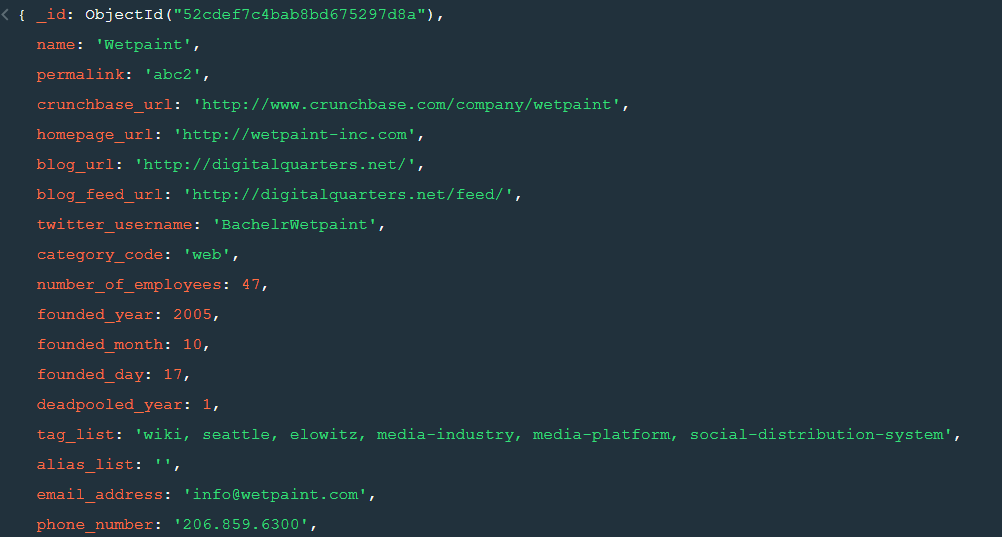
For the above query we get the following result:-
The above result brings us to another function .pretty() .
2. pretty() :- this function helps us see the result more clearly.
Try it yourself to compare the results.
3. count() :- Now lets see how many entries we have by the company name “Wetpaint”.
So we have only one document.
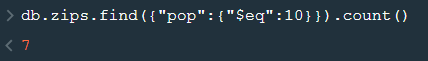
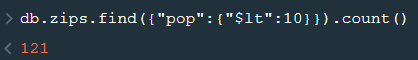
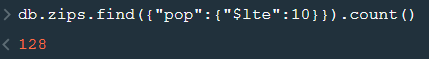
4. Comparison operators :-
“$eq” : Equal to
“$neq”: Not equal to
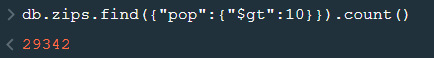
“$gt”: Greater than
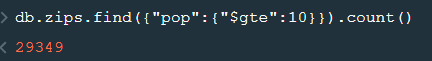
“$gte”: Greater than equal to
“$lt”: Less than
“$lte”: Less than equal to
Lets see how this works.
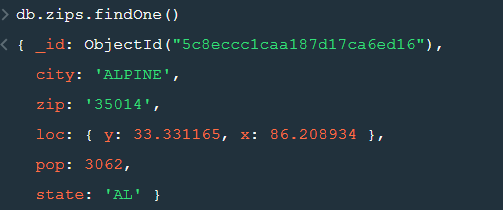
5. findOne() :- To get a single document from a collection we use this function.
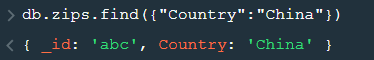
6. insert() :- This is used to insert documents in a collection.
Now lets check if we have been able to insert this document or not.
Notice that a unique id has been added to the document by default. The given id has to be unique or else there will be an error. To provide a user defined id use “_id”.
So, with that we come to the end of the discussion on the MongoDB. Hopefully it helped you understand the topic, for more information you can also watch the video tutorial attached down this blog. The blog is designed and prepared by Niharika Rai, Analytics Consultant, DexLab AnalyticsDexLab Analytics offers machine learning courses in Gurgaon. To keep on learning more, follow DexLab Analytics blog.
This is another blog added to the series of time series forecasting. In this particular blog I will be discussing about the basic concepts of ARIMA model.
So what is ARIMA?
ARIMA also known as Autoregressive Integrated Moving Average is a time series forecasting model that helps us predict the future values on the basis of the past values. This model predicts the future values on the basis of the data’s own lags and its lagged errors.
When a data does not reflect any seasonal changes and plus it does not have a pattern of random white noise or residual then an ARIMA model can be used for forecasting.
There are three parameters attributed to an ARIMA model p, q and d :-
p :- corresponds to the autoregressive part
q:- corresponds to the moving average part.
d:- corresponds to number of differencing required to make the data stationary.
In our previous blog we have already discussed in detail what is p and q but what we haven’t discussed is what is d and what is the meaning of differencing (a term missing in ARMA model).
Since AR is a linear regression model and works best when the independent variables are not correlated, differencing can be used to make the model stationary which is subtracting the previous value from the current value so that the prediction of any further values can be stabilized . In case the model is already stationary the value of d=0. Therefore “differencing is the minimum number of deductions required to make the model stationary”. The order of d depends on exactly when your model becomes stationary i.e. in case the autocorrelation is positive over 10 lags then we can do further differencing otherwise in case autocorrelation is very negative at the first lag then we have an over-differenced series.
The formula for the ARIMA model would be:-
To check if ARIMA model is suited for our dataset i.e. to check the stationary of the data we will apply Dickey Fuller test and depending on the results we will using differencing.
In my next blog I will be discussing about how to perform time series forecasting using ARIMA model manually and what is Dickey Fuller test and how to apply that, so just keep on following us for more.
So, with that we come to the end of the discussion on the ARIMA Model. Hopefully it helped you understand the topic, for more information you can also watch the video tutorial attached down this blog. The blog is designed and prepared by Niharika Rai, Analytics Consultant, DexLab AnalyticsDexLab Analytics offers machine learning courses in Gurgaon. To keep on learning more, follow DexLab Analytics blog.
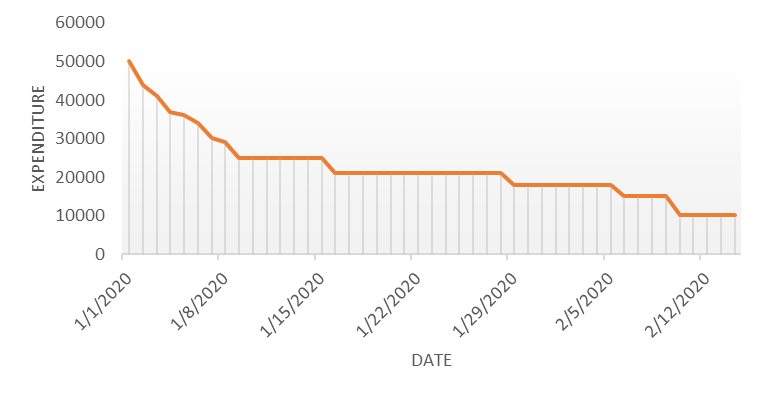
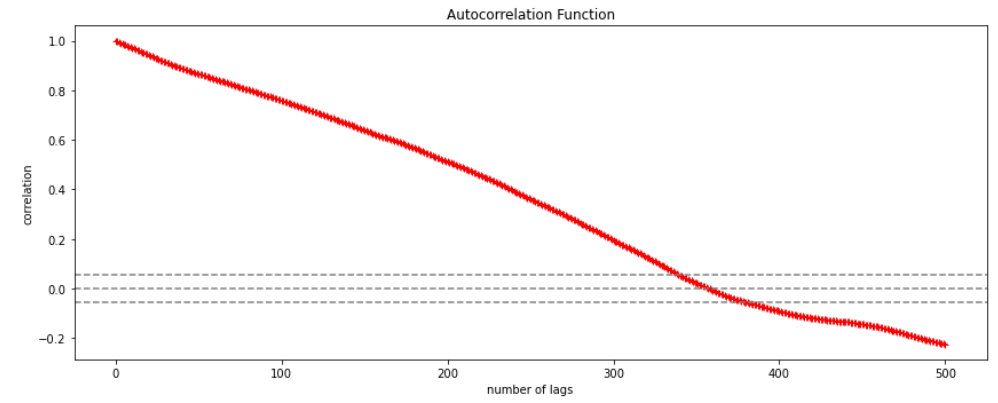
Autocorrelation is a special case of correlation. It refers to the relationship between successive values of the same variables .For example if an individual with a consumption pattern:-
spends too much in period 1 then he will try to compensate that in period 2 by spending less than usual. This would mean that Ut is correlated with Ut+1 . If it is plotted the graph will appear as follows :
Positive Autocorrelation : When the previous year’s error effects the current year’s error in such a way that when a graph is plotted the line moves in the upward direction or when the error of the time t-1 carries over into a positive error in the following period it is called a positive autocorrelation. Negative Autocorrelation : When the previous year’s error effects the current year’s error in such a way that when a graph is plotted the line moves in the downward direction or when the error of the time t-1 carries over into a negative error in the following period it is called a negative autocorrelation.
Now there are two ways of detecting the presence of autocorrelation By plotting a scatter plot of the estimated residual (ei) against one another i.e. present value of residuals are plotted against its own past value.
If most of the points fall in the 1st and the 3rd quadrants , autocorrelation will be positive since the products are positive.
If most of the points fall in the 2nd and 4th quadrant , the autocorrelation will be negative, because the products are negative. By plotting ei against time : The successive values of ei are plotted against time would indicate the possible presence of autocorrelation .If e’s in successive time show a regular time pattern, then there is autocorrelation in the function. The autocorrelation is said to be negative if successive values of ei changes sign frequently. First Order of Autocorrelation (AR-1) When t-1 time period’s error affects the error of time period t (current time period), then it is called first order of autocorrelation. AR-1 coefficient p takes values between +1 and -1 The size of this coefficient p determines the strength of autocorrelation. A positive value of p indicates a positive autocorrelation. A negative value of p indicates a negative autocorrelation In case if p = 0, then this indicates there is no autocorrelation. To explain the error term in any particular period t, we use the following formula:-
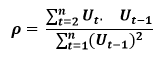
Where Vt= a random term which fulfills all the usual assumptions of OLS How to find the value of p?
One can estimate the value of ρ by applying the following formula :-
Data Smoothing is done to better understand the hidden patterns in the data. In the non- stationary processes, it is very hard to forecast the data as the variance over a period of time changes, therefore data smoothing techniques are used to smooth out the irregular roughness to see a clearer signal.
In this segment we will be discussing two of the most important data smoothing techniques :-
Moving average smoothing
Exponential smoothing
Moving average smoothing
Moving average is a technique where subsets of original data are created and then average of each subset is taken to smooth out the data and find the value in between each subset which better helps to see the trend over a period of time.
Lets take an example to better understand the problem.
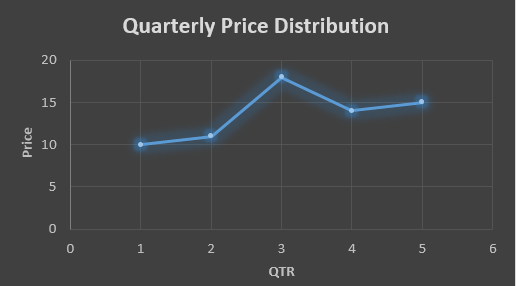
Suppose that we have a data of price observed over a period of time and it is a non-stationary data so that the tend is hard to recognize.
QTR (quarter)
Price
1
10
2
11
3
18
4
14
5
15
6
?
In the above data we don’t know the value of the 6th quarter.
….fig (1)
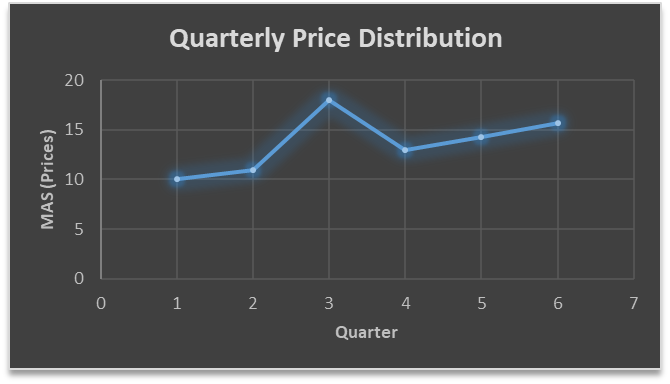
The plot above shows that there is no trend the data is following so to better understand the pattern we calculate the moving average over three quarter at a time so that we get in between values as well as we get the missing value of the 6th quarter.
To find the missing value of 6th quarter we will use previous three quarter’s data i.e.
MAS = = 15.7
QTR (quarter)
Price
1
10
2
11
3
18
4
14
5
15
6
15.7
MAS = = 13
MAS = = 14.33
QTR (quarter)
Price
MAS (Price)
1
10
10
2
11
11
3
18
18
4
14
13
5
15
14.33
6
15.7
15.7
….. fig (2)
In the above graph we can see that after 3rd quarter there is an upward sloping trend in the data.
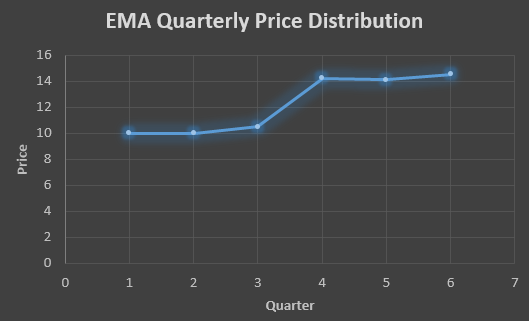
Exponential Data Smoothing
In this method a larger weight ( ) which lies between 0 & 1 is given to the most recent observations and as the observation grows more distant the weight decreases exponentially.
The weights are decided on the basis how the data is, in case the data has low movement then we will choose the value of closer to 0 and in case the data has a lot more randomness then in that case we would like to choose the value of closer to 1.
EMA= Ft= Ft-1 + (At-1 – Ft-1)
Now lets see a practical example.
For this example we will be taking = 0.5
Taking the same data……
QTR (quarter)
Price
(At)
EMS Price(Ft)
1
10
10
2
11
?
3
18
?
4
14
?
5
15
?
6
?
?
To find the value of yellow cell we need to find out the value of all the blue cells and since we do not have the initial value of F1 we will use the value of A1. Now lets do the calculation:-
F2=10+0.5(10 – 10) = 10
F3=10+0.5(11 – 10) = 10.5
F4=10.5+0.5(18 – 10.5) = 14.25
F5=14.25+0.5(14 – 14.25) = 14.13
F6=14.13+0.5(15 – 14.13)= 14.56
QTR (quarter)
Price
(At)
EMS Price(Ft)
1
10
10
2
11
10
3
18
10.5
4
14
14.25
5
15
14.13
6
14.56
14.56
In the above graph we see that there is a trend now where the data is moving in the upward direction.
So, with that we come to the end of the discussion on the Data smoothing method. Hopefully it helped you understand the topic, for more information you can also watch the video tutorial attached down this blog. The blog is designed and prepared by Niharika Rai, Analytics Consultant, DexLab AnalyticsDexLab Analytics offers machine learning courses in Gurgaon. To keep on learning more, follow DexLab Analytics blog.
A time series is a sequence of numerical data in which each item is associated with a particular instant in time. Many sets of data appear as time series: a monthly sequence of the quantity of goods shipped from a factory, a weekly series of the number of road accidents, daily rainfall amounts, hourly observations made on the yield of a chemical process, and so on. Examples of time series abound in such fields as economics, business, engineering, the natural sciences (especially geophysics and meteorology), and the social sciences.
Univariate time series analysis- When we have a single sequence of data observed over time then it is called univariate time series analysis.
Multivariate time series analysis – When we have several sets of data for the same sequence of time periods to observe then it is called multivariate time series analysis.
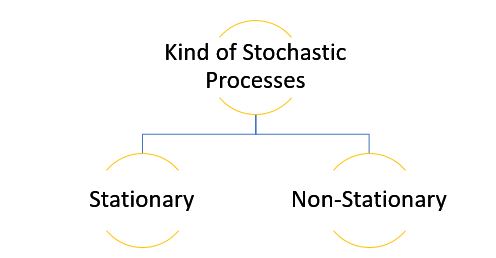
The data used in time series analysis is a random variable (Yt) where t is denoted as time and such a collection of random variables ordered in time is called random or stochastic process.
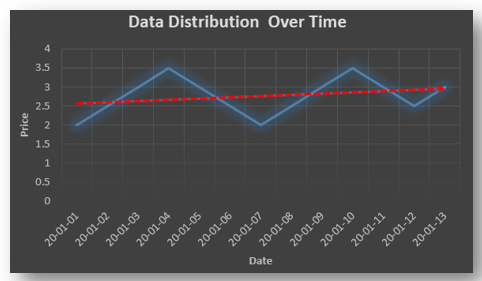
Stationary: A time series is said to be stationary when all the moments of its probability distribution i.e. mean, variance , covariance etc. are invariant over time. It becomes quite easy forecast data in this kind of situation as the hidden patterns are recognizable which make predictions easy.
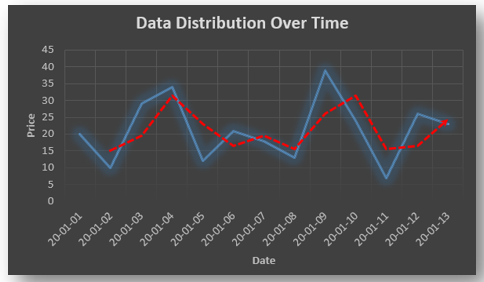
Non-stationary: A non-stationary time series will have a time varying mean or time varying variance or both, which makes it impossible to generalize the time series over other time periods.
Non stationary processes can further be explained with the help of a term called Random walk models. This term or theory usually is used in stock market which assumes that stock prices are independent of each other over time. Now there are two types of random walks: Random walk with drift : When the observation that is to be predicted at a time ‘t’ is equal to last period’s value plus a constant or a drift (α) and the residual term (ε). It can be written as Yt= α + Yt-1 + εt The equation shows that Yt drifts upwards or downwards depending upon α being positive or negative and the mean and the variance also increases over time. Random walk without drift: The random walk without a drift model observes that the values to be predicted at time ‘t’ is equal to last past period’s value plus a random shock. Yt= Yt-1 + εt Consider that the effect in one unit shock then the process started at some time 0 with a value of Y0 When t=1 Y1= Y0 + ε1 When t=2 Y2= Y1+ ε2= Y0 + ε1+ ε2 In general, Yt= Y0+∑ εt In this case as t increases the variance increases indefinitely whereas the mean value of Y is equal to its initial or starting value. Therefore the random walk model without drift is a non-stationary process.
So, with that we come to the end of the discussion on the Time Series. Hopefully it helped you understand time Series, for more information you can also watch the video tutorial attached down this blog. DexLab Analytics offers machine learning courses in delhi. To keep on learning more, follow DexLab Analytics blog.
Running a business is a challenging job, especially when business operations take place on a small-scale platform. Small business owners need constant motivation and brainstorming to keep their business in a profitable position.
However, as the world is busy deriving benefits from AI technology, and professionals opting for artificial intelligence course in delhi for better career prospects, small business owners too should seize this opportunity to power up their businesses.
Why the small business owners are shying away from AI?
With biggies like Google, Amazon, Apple, Microsoft empowering themselves with AI tools, small businesses are somewhat showing reluctance towards the new technology. Only a small percentage of businesses ranging from small to medium have so far been influenced by it. A 2018 survey showed the number to be around 13.6%.
This indicates there is some inhibition in the small business community, but, it might not just be that, when questioned most small business owners often cite reasons like lack of expertise, financial concern to be the causes.
They are mostly under the misconception that such advanced technology is best suited for giant platforms and their small scale businesses are not going to rake in any profit, even if they invest. They don’t even have tons of data like most businesses, to begin with. So, AI being a data-driven technology, might not work for them.
Their perception is gradually changing because of the way AI has started seeping through the very fiber of civilization and impacting so many aspects of life. It is not possible for small businesses to indulge in AI research or, develop a platform specifically for their business needs for feasible reasons but, they can get ideas regarding how best to conduct business the AI way.
Let’s find out how AI can be incorporated into small business infrastructure to improve five core areas.
Smarter sales and marketing with AI-powered CRMs
A CRM is an indispensable tool for any business, let alone a small one. Basically, a CRM works to garner customer data from various platforms to enable the sales and marketing team to keep track of their valuable customers while pursuing new leads.
The fusion of AI and CRM could do wonders as it is evident from the way Einstein AI, introduced by SalesForce is working.
You stand to gain insight into the customer mindset as this fusion will work to analyze customer mindset by analyzing the conversations that happened across different channels. This insight can help shape your sales and marketing efforts accordingly especially if you can upskill your team with customer market analysis courses.
Keep an eye on your rivals
Staying one step ahead of your biggest competition in the market is a crucial need no business owner big or small can afford to ignore. However, it is not easy to monitor every move they make, but, AI can be your biggest ally in helping you track your rival’s every digital move.
AI-powered Crayon, is a smart tool that monitors what your competition is doing on social media, across websites and applications, you can gauge their performance and activities and keep a tab on their marketing strategies, pricing, and other such issues to make suitable modifications to your own.
Automate customer service
Handling your customers is an important but, tedious task and as your business starts to grow so does your customer base and their queries. Investing in a big support team might not always be a feasible option for you, so why don’t you take advantage of chatbots to automate the whole process and make it more efficient?
Not all queries are important, some of these are generic which the chatbots can handle while your sales team can focus on more personalized or, technical queries to keep your customers happy. Answering support tickets can be easy with a tool like Digital Genius. It is a great option even for those businesses which can’t afford a support team.
Smoother HR operations
No matter how small scale your business might be, you still have to manage your employees and hire new ones, which means having an HR team ready round the clock. Now you can manage this segment bypassing all hassles thanks to AI-powered platforms that automate your HR functions, be it screening applications, scheduling interviews or, onboarding the new employees, every segment will be well taken care of. Not just that but, the administrative jobs that the HR have to do repetitively could be automated too.
Customize your customer journey
Customers like to be pampered, when they shop from big brand names they hardly get to experience that personalized approach. The trendy products aimed at mass-market leave them wishing for something that would suit their style. Retail Analytics Courses can help you develop a better understanding of the whole issue.
Being a small business owner you already have the advantage to take care of this issue and you can be near perfect in your approach if you get support from smart AI algorithms that can browse through customer data and detect patterns to help you understand the personal preferences of customers and thereby allow you to modify your products accordingly to suit their needs.
Coupled with AI power you could also improve your logistics to ensure your supply chain does not experience any glitch.
The development of AI platforms programmed to perform specialized tasks need to be recognized by the small business community, only then they would find the motivation to channelize the power in the right direction. They can also consider upskilling themselves with deep learning for computer vision course, to be able to harness the power of AI.
In the competitive world of business, branding plays a pivotal role in making sure that your company can rise above the noise and be noticed. The concept of branding thrives on the dual power of brand recognition and brand recall meaning the customer’s ability to identify your brand among a host of other similar products.
Creating brand awareness is a crucial task for any business done through carefully measured and planned strategies. Familiarizing the audience with a specific brand takes time and apt utilization of all available communication platforms.
What role data science can play in devising branding strategy?
The emergence of online shopping, as well as the proliferation of communication channels, are making the job complicated for marketers, along with the explosion of information sources causing an exponential increase in data generation. The large data if assessed correctly can reveal useful information regarding customers and allow them to make data-driven branding strategies. Data Science training is required for enabling the professionals to help companies assess valuable data.
Handling this vast data can baffle any seasoned marketing team, but, with the application of data science tools and techniques manipulating and extracting valuable information becomes easier. Not just that, but, the marketing team now has the power to peek into customer preferences to angle their branding strategy the right away to make their imprint on the customer’s mind.
So, here is how branding is getting smarter
Personalized messages
Data science allows the marketers to assess the customer data spread across various channels including social media platforms. When analyzed this data points the marketers towards the customers’ buying habits, preferences, and they can develop a message for individual customers keeping these preferences in mind. Marketing personnel having undergone customer market analysis courses would be able to guide their team better.
When a brand approaches a specific customer with recommendations specifically tailored to their preferences they tend to return to that brand. Furthermore, it also helps them to find reasons why the customers change buying decision midcourse and leave a site, or, product page. Data analysis will assess that behavior and offer insight.
Another factor to consider here is that the marketing team can also find the errors in their previous marketing campaigns contained in past data through the right analysis.
Shaper social media strategy
Accessing social media platforms to target customers is a strategy all marketers resort to, after all, a huge chunk of their target audience spends a significant amount of time here. However, creating content and aiming it randomly at all platforms or, some platforms based on guesswork can go for a toss.
Data collected regarding social media usage patterns of customers can point the strategists towards the platforms to invest in. A certain section of their targeted customers might spend time on Twitter, while another segment might veer towards Instagram. So, identifying those platforms for specific segments and delivering content accordingly needs data-backed insight. Assessing data patterns can help marketers position their brands on the right platform.
Delivering the right content
Brands reach out to the target audience via different types of content that they promote across various channels to gain customer attention and push their brand identity. However, their strategy is often very loosely based on an assumption that might go wrong. Engaging the customer gets a lot easier if the team puts the data-driven insight into their content marketing plan.
Data regarding customer age, gender, personal interests, the time they spend over different types of content and what they retweet, or, share on their timeline matters. The team can gain a perspective analyzing the search data of customers to understand what they are looking for and what kind of content resonates with which demographic. Data analysis can solve this entire puzzle and enable the team to devise a content marketing strategy accordingly.
When the customers find that a specific brand has the answers to their queries and offers meaningful information they will naturally gravitate towards it.
Assess brand performance
Application of data science tools can not only lead towards measuring customer behavior but also allow the company to assess its performance. Data could reveal valuable information regarding the bounce rate, the social media image of the brand, customer reviews all of that to point out the problem areas that need immediate attention.
The insight gained from the data could help the team to collaborate with other teams to work on the problem areas and make changes. This does send out a positive message regarding the brand which continuously works to improve itself.
Understanding the value of data is vital for any brand wishing to win customers’ hearts. Applying data science tools to process this data requires skill. Companies should invest in building a team comprising data scientists, analysts to get the job done. They can also train their personnel by sending them to Data analyst training institute.
Analytics India Magazine (AIM), one of the foremost journals on big data and AI in India, has rated Dexlab Analytics’ credit risk modelling course one of the best in India and recommended it be taken up to learn the subject in 2020. Dexlab Analytics is on AIM’s list of nine best online courses on the subject.
In an article, the AIM has rated DexLab Analytics as a premier institute offering a robust course in credit risk modelling. Credit risk modelling is “the analysis of the credit risk that helps in understanding the uncertainty that a lender runs before lending money to borrowers”.
The article describes the Dexlab Analytics course as offering learners “an opportunity to understand the measure of central tendency theorem, measures of dispersion, probability theory and probability distribution, sampling techniques, estimation theory, types of statistical tests, linear regression, logistic regression. Besides, you will learn the application of machine learning algorithms such as Decision tree, Random Forest, XGBoost, Support Vector Machine, banking products and processes, uses of the scorecard, scorecard model development, use of scorecard for designing business strategies of a bank, LGD, PD, EAD, and much more.”
The other bodies offering competent courses on the subject on AIM’s list are Udemy, SAS, Redcliffe Training, EDUCBA, Moneyweb CPD HUB, 365 DataScience and DataCamp.
Analytics India Magazine chronicles technological progress in the space of analytics, artificial intelligence, data science & big data by highlighting the innovations, players, and challenges shaping the future of India through promotion and discussion of ideas and thoughts by smart, ardent, action-oriented individuals who want to change the world.
Since 2012, Analytics India Magazine has been dedicated to passionately championing and promoting the analytics ecosystem in India. We have been a pre-eminent source of news, information and analysis for the Indian analytics ecosystem, covering opinions, analysis, and insights on key breakthroughs and future trends in data-driven technologies as well as highlighting how they’re being leveraged for future impact.
Dexlab Analytics has been thriving as one of the prominent institutes offering the best selection of courses on Big Data Hadoop, R Programming, Python, Business Analytics, Data Science, Machine Learning, Deep Learning, Data Visualization using Tableau and Excel. Moreover, it aims to achieve Corporate Training Excellence with each training it conducts.
Employability and the scramble for top Jobs in India
Looking to hire new talent or searching for a job? Well, some insights several studies and surveys provide about the job scenario in India might interest you.
The Millenial
Indian millennials, aged between 18 and 35 years, according to studies ( wheebox.com/assets/pdf/ISR_Report_2020.pdf ) makes nearly half the Indian workforce and looks likely to remain so for the next decade. This generation of workers are not only working hands but likely consumers as well, strong in their opinions, with access to the internet and social media across urban and rural areas. What they are most ardently looking for are jobs that respect their talent, pay them adequately and improve their employability in the market.
Employability in India
Employability has remained stagnant for several years now with around 46 per cent candidates job-ready. Of those employed, trends revealed
MBA’s in India are now projecting a rate of 54 per cent employability, acquiring the highest paying jobs
Employers prefer candidates with work experience, especially 1-5 years. Freshers are least preferred at 15 per cent.
The AI industry is showing promise wherein some reports pegged the number of job openings in AI and Machine learning sector at almost 1million in India last year.
Employability for pass-outs of B.Pharma, B.com, BA and Polytechnics showed an increase of around 15% since 2019.
Prospective workers from Maharashtra, Tamil Nadu and Uttar Pradesh were found to be most employable
While women are as employable as men, women’s participation in the workforce remains at a low 25 per cent vis a vis that of men.
What employers seek
Domain knowledge
Adaptability to the work environment
Learning ability and agility
Positive attitude
What employees seek
Majority of Students, around 88 per cent of those surveyed, sought internship opportunities though the supply did not meet demand in most cases
Maharashtra, Tamil Nadu and Andhra Pradesh were preferred and most sought after in terms of work opportunity
Over 55% students expect the annual salary to be above Rs. 2.6 lacs, a figure which has remained constant for the past few years
Ways to improve employability
Most students or potential candidates, surveys show, seek proper guidance and training and internship opportunities as varied as customer market analysis courses to customer marketing analysis training and courses teaching retail analytics using Python. While most universities lack the wherewithal to skill their outgoing students, students prefer to sign up for short courses online to equip themselves with the requisite knowledge specific to their industry. All this done with a view to increase their employability in a market deeply customer driven.
Interested in a career in Data Analyst?
To learn more about Data Analyst with Advanced excel course – Enrol Now. To learn more about Data Analyst with R Course – Enrol Now. To learn more about Big Data Course – Enrol Now.
To learn more about Machine Learning Using Python and Spark – Enrol Now. To learn more about Data Analyst with SAS Course – Enrol Now. To learn more about Data Analyst with Apache Spark Course – Enrol Now. To learn more about Data Analyst with Market Risk Analytics and Modelling Course – Enrol Now.