credit risk analysis Archives - Page 5 of 6 - DexLab Analytics | Credit Risk | Market Risk | SAS Python Machine Learning Modeling

Darker Clouds Covering the Cloud

Darker Clouds Covering the Cloud
 

New age technologies are dominating the present business environment. Mobility, cloud computing, social media and analytics have been affecting the different realms of business at an ever-increasing rate. Though most of the impacts are favourable, yet it will be reckless to ignore the severity of the negative ones.

Amidst all, cloud computing grabbed the utmost attention. The benefits of cloud computing are myriad – better productivity, lower costs and quicker time to market. A surging number of employees are using cloud applications to talk about various work-related subject matters. Nevertheless, data security is still a leading concern.


1


Traditional threats are no more potent. Most organisations have devised manipulating ways to safeguard themselves against those predictable threats, newer threats call for better IT security to realise high profile business priorities. A well-researched study by VMware, a pioneer in cloud infrastructure and digital workspace technology revealed that though businesses – small, medium and large will be more than keen to implement cloud computing to secure better future goals and efficiency, information security thriving on the cloud will have a profound impact on enterprises in the next 3-5 years.


role_IT_cloud_data_protection

The Cloud Security

Another study by eminent research firm Kantar IMRB highlighted that though organisations are taking steps towards a modern workspace environment, they are more interested about having a safe and secured digital environment, thanks to a rising number of cyber threats and thefts. If you follow the figures, in the next 3-5 years, more than 86% of enterprises are going to enhance their IT Budget and 80% of organisations will be eager to expend more time, skill and money on cloud technology.


haven_secure_cloud


In respect to the above context, Arun Parameswaran, managing director of VMware India said, “With nearly 25% of all IT workloads being managed on the cloud today, and the number expected to double by 2021, it is evident that the traditional on-premises IT environment is undergoing a profound change.” He further added, “Today, CIOs play an extremely essential role in their organisations’ IT, and it is of utmost importance to have enterprise data available always—anytime and anywhere while tightly secured.”

Enhanced productivity and better profitability will always remain a prime priority, but now as per the recent studies, IT security has also become a chief concern in the list of business priorities. However, despite heavy investments in IT, CIOs of well-established companies are unhappy because the budget is either not structured properly or inadequate. The studies also reveal that the government and BFSI respondents think that the budget for IT security is quite low, and it should be increased at least by 25% by next year.


Cloud is the best thing since sliced bread. Companies are relying more on cloud to store sensitive data. Cloud is the future; so companies should look up to ways to balance the risks with explicit advantages that this evolving technology brings in.

 Data-Privacy

Looking forward to a credit risk analysis course online? Check out a wide range of interactive Credit Risk Analysis online course at DexLab Analytics.


Interested in a career in Data Analyst?

To learn more about Machine Learning Using Python and Spark – click here.
To learn more about Data Analyst with Advanced excel course – click here.
To learn more about Data Analyst with SAS Course – click here.
To learn more about Data Analyst with R Course – click here.
To learn more about Big Data Course – click here.

ANZ uses R programming for Credit Risk Analysis

ANZ uses R programming for Credit Risk Analysis

At the previous month’s “R user group meeting in Melbourne”, they had a theme going; which was “Experiences with using SAS and R in insurance and banking”. In that convention, Hong Ooi from ANZ (Australia and New Zealand Banking Group) spoke on the “experiences in credit risk analysis with R”. He gave a presentation, which has a great story told through slides about implementing R programming for fiscal analyses at a few major banks.

In the slides he made, one can see the following:

How R is used to fit models for mortgage loss at ANZ

A customized model is made to assess the probability of default for individual’s loans with a heavy tailed T distribution for volatility.

One slide goes on to display how the standard lm function for regression is adapted for a non-Gaussian error distribution — one of the many benefits of having the source code available in R.

A comparison in between R and SAS for fitting such non-standard models

Mr. Ooi also notes that SAS does contain various options for modelling variance like for instance, SAS PROC MIXED, PRIC NLIN. However, none of these are as flexible or powerful as R. The main difference as per Ooi, is that R modelling functions return as object as opposed to returning with a mere textual output. This however, can be later modified and manipulated with to adapt to a new modelling situation and generate summaries, predictions and more. An R programmer can do this manipulation.


Read Also: From dreams to reality: a vision to train the youngsters about big data analytics by the young entrepreneurs:


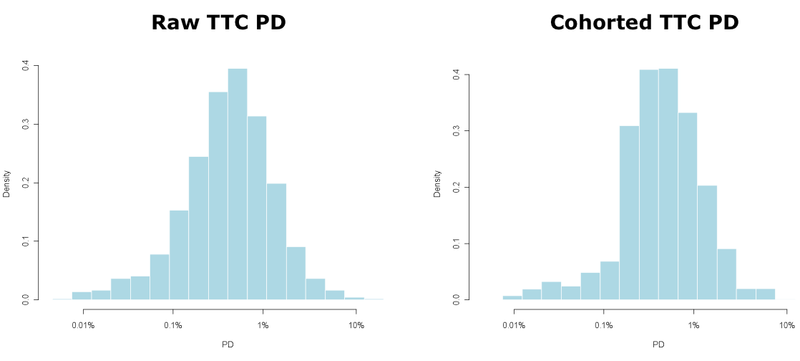
We can use cohort models to aggregate the point estimates for default into an overall risk portfolio as follows:

A comparison in between R and SAS for fitting such non-standard models
Photo Coutesy of revolution-computing.typepad.com

He revealed how ANZ implemented a stress-testing simulation, which made available to business users via an Excel interface:

The primary analysis is done in r programming within 2 minutes usually, in comparison to SAS versions that actually took 4 hours to run, and frequently kept crashing due to lack of disk space. As the data is stored within SAS; SAS code is often used to create the source data…

While an R script can be used to automate the process of writing, the SAS code can do so with much simplicity around the flexible limitations of SAS.


Read Also: Dexlab Analytics' Workshop on Sentiment Analysis of Twitter Data Using R Programming


Comparison between use of R and SAS’s IML language to implement algorithms:

Mr. Ooi’s R programming code has a neat trick of creating a matrix of R list objects, which is fairly difficult to do with IML’s matrix only data structures.

He also discussed some of the challenges one ma face when trying to deploy open-source R in the commercial organizations, like “who should I yell at if things do now work right”.

And lastly he also discussed a collection of typically useful R resources as well.

For people who work in a bank and need help adopting R in the workflow, may make use of this presentation to get some knowledge about the same. And also feel free to get in touch with our in-house experts in R programming at DexLab Analytics, the premiere R programming training institute in India.


Refhttps://www.r-bloggers.com/how-anz-uses-r-for-credit-risk-analysis/


Interested in a career in Data Analyst?

To learn more about Data Analyst with Advanced excel course – Enrol Now.
To learn more about Data Analyst with R Course – Enrol Now.
To learn more about Big Data Course – Enrol Now.

To learn more about Machine Learning Using Python and Spark – Enrol Now.
To learn more about Data Analyst with SAS Course – Enrol Now.
To learn more about Data Analyst with Apache Spark Course – Enrol Now.
To learn more about Data Analyst with Market Risk Analytics and Modelling Course – Enrol Now.

Apple Watch’s Strategy Analytics, Return to 1% Growth

As per the latest research from strategy analytics, the global smart watch shipments of Apple has grown by 1 percent annually to hit the major record of 8.2 million units in the 4th quarter of the year 2016. The growth of apple watch drove and got dominated with 63 percent in global smart watch share of market and Samsung still continues to hold its second position.
 
Apple Watch’s Strategy Analytics, Return to 1% Growth


Neil Mawston, the Executive Director at Strategy Analytics stated on the issue by saying – the global shipments have grown by 1 percent annually from the pre-existing 8.1 million units in quarter 4 in 2015 to 8.2 million in quarter 4 in 2016. The market shows a marked growth in the fourth quarter for growth in smart watches industry after the past two consecutive quarters for declining volumes. The smart watch growth is also seen to be recovering ever so slightly due to new product launches from other company giants. Moreover, there is a seasonal demand for these gadgets, and a giant such as Apple is launching stringer demand in the major developed markets in the US and UK. Hence, the international smart watch shipments grew by 1 percent annually; from the previously existing 20.8 million in full-year 2015 to a record high of 21.1 million in 2016.

Continue reading “Apple Watch’s Strategy Analytics, Return to 1% Growth”

The Opportunities and Challenges in Credit Scoring with Big Data

The Opportunities and Challenges in Credit Scoring with Big Data

Within the past few decades, the banking institutions have collected plenty of data in order to describe the default behaviour of their clientele. Good examples of them are historical data about a person’s date of birth, their income, gender, status of employment etc. the whole of this data has all been nicely stored into several huge databases or data warehouses (for e.g. relational).

And on top of all this, the banks have accumulated several business experiences about their crediting products. For instance, a lot of credit experts have done a pretty swell job at discriminating between low risk and high risk mortgages with the use of their business mortgages, thereby making use of their business expertise only. It is now the goal of all credit scoring to conduct a detailed analysis of both the sources of data into a more detailed perspective with then come up with a statistically based decision model, which allows to score future credit applications and then ultimately make a decision about which ones to accept and which to reject.

With the surfacing of Big Data it has created both chances as well as challenges to conduct credit scoring. Big Data is often categorised in terms of its four Vs viz: Variety, Velocity, Volume, and Veracity. To further illustrate this, let us in short focus into some key sources or processes, which will generate Big Data.  

The traditional sources of Big Data are usually large scale transactional enterprise systems like OLTP (online Transactional Processing), ERP (Enterprise Resource Processing) and CRM (Customer Relationship Management) applications. The classical credit is generally constructed using the data extracted from these traditional transactional systems.

However, the online graphing is more recent example. Simply think about the all the major social media networks like, Weibo, Wechat, Facebook, Twitter etc. All of these networks together capture the information about close to two billion people relating to their friends preferences and their other behaviours, thereby leaving behind a huge trail of digital footprint in the form of data.

Also think about the IoT (the internet of things) or the emergence of the sensor enable ecosystems which is going to link the various objects (for e.g. cars, homes etc) with each other as well as with other humans. And finally, we get to see a more and more transparent or public data such as the data about weather, maps, traffic and the macro-economy. It is a clear indication that all of these new sources of generating data will offer a tremendous potential for building better credit scoring models.

The main challenges:

The above mentioned data generating processes can all be categorised in terms of their sheer volume of the data which is being created. Thus, it is evident that this poses to be a serious challenge in order to set up a scalable storage architecture which when combined with a distributed approach to manipulate data and query will be difficult.

Big Data also comes with a lot of variety or in several other formats. The traditional data or the structured data, such as customer name, their birth date etc are usually more and more complementary with unstructured data such as images, tweets, emails, sensor data, Facebook pages, GPS data etc. While the former may be easily stored in traditional databases, the latter needs to be accommodated with the use of appropriate database technology thus, facilitating the storage, querying and manipulation of each of these types of unstructured data. Also it requires a lot of effort since it is thought to be that at least 80 percent of all data in unstructured.

The speed at which data is generated is the velocity factor and it is at that perfect speed that it must be analysed and stored. You can imagine the streaming applications like on-line trading platforms, SMS messages, YouTube, about the credit card swipes and other phone calls, these are all examples of high velocity data and form an important concern.

Veracity which is the quality or trustworthiness of the data, is yet another factor that needs to be considered. However, sadly more data does not automatically indicate better data, so the quality of data being generated must be monitored closely and guaranteed.

So, in closing thoughts as the velocity, veracity, volume, and variety keeps growing, so will the new opportunities to build better credit scoring models.     

Looking for credit risk modelling courses? Take up our credit risk management course online or classroom-based from DexLab Analytics and get your career moving….


Interested in a career in Data Analyst?

To learn more about Data Analyst with Advanced excel course – Enrol Now.
To learn more about Data Analyst with R Course – Enrol Now.
To learn more about Big Data Course – Enrol Now.

To learn more about Machine Learning Using Python and Spark – Enrol Now.
To learn more about Data Analyst with SAS Course – Enrol Now.
To learn more about Data Analyst with Apache Spark Course – Enrol Now.
To learn more about Data Analyst with Market Risk Analytics and Modelling Course – Enrol Now.

Introduction To Credit Score Cards: Its Use in Crisis

The incident we are about to describe took place during 2009 circa at a party, a year in which the world was going through one of its worst financial crisis for the longest time. Every average bloke on the streets was aware of terms like mortgage-backed securities (MBS), sub-prime lending and credit crisis, after all these are the reasons for his plight.


Introduction To Credit Score Cards: Its Use in Crisis


But at this party we are speaking of, I was fortunate enough to meet with an informed and highly compassionate elderly woman, and after a few minutes of discussion the topic came to what we here do for a living. She wanted to know more about credit scorecard systems. As I further went on to explain the details of how this system works, her expression changed from being just plainly curious to angry to pained. Continue reading “Introduction To Credit Score Cards: Its Use in Crisis”

Credit Risk Managers Must use Big Data in These Three Ways

Credit risk managers must use Big Data in these three ways

While the developed nations are slowly recovering from the financial chaos of post depression, the credit risk managers are facing growing default rates as household debts are increasing with almost no relief in sight. As per the reports of the International Finance which stated at the end of 2015 that household debts have risen to by USD 7.7 trillion since the year 2007. It now stands at the heart stopping amount of a massive USD 44 trillion and the amount of debts increased in the emerging markets is of USD 6.2 trillion. The household loans of emerging economies calculating as per adult rose by 120 percent over the period and are now summed up to USD 3000.

To thrive in this market of increasing debts, credit risk managers must consider innovative methods to keep accuracy in check and decrease default rates. A good solution to this can be applying the data analytics to Big Data. Continue reading “Credit Risk Managers Must use Big Data in These Three Ways”

Facts about Remittances for Credits and Rent Losses – Part 1

Facts about Remittances for Credits and Rent Losses – Part 1


A valuation store, built up and kept up by charges against the bank’s working salary, is what we know by The Allowances for Loans and Lease Losses (ALLL). As an assessment measure, it is an evaluation of invalid sums that is utilized to decrease the book estimation of credits and rents to the sum that is relied upon to be gathered. The ALLL frames a piece of Capital of Tier-2; henceforth it is kept up to cover misfortunes that are plausible and admirable at the time of assessment. It does not work as a support against all conceivable future misfortunes; that assurance is given by the Capital of Tier 1. For building up and keeping up a satisfactory payment, a bank ought to:

Continue reading “Facts about Remittances for Credits and Rent Losses – Part 1”

Banking Business And Banking Instruments- Part 2

Banking Business And Banking Instruments- Part 2
 

In the last blog we had discussed three types of banking instruments, namely the Current account, Savings account and Certificate of Deposit.  In this blog we discuss credit cards. Credit cards are the most expensive and profitable type of loan that a bank can extend. A credit card is a card issued by a financial institution giving the holder an option to borrow funds, usually at points of scales. Credit cards charge interest and are primarily used for short-term financing. Interest usually begins one month after a purchase is made and borrowing limit is pre-set according to the individual’s credit rating. Credit cards have higher interest rates than most consumer loans, or lines of credit.

Continue reading “Banking Business And Banking Instruments- Part 2”

BASEL Accords: A Basic Understanding

BASEL accords are a set of agreements set by the Basel Committee on Banking Supervision(BCBS) which provides recommendations on banking regulations in regard to credit risk, market risk and operational risk. The purpose of the accords is to ensure that the financial institutions have adequate capital on account to meet obligations and absorb unexpected loss. There are three versions of BASEL: BASEL-I, II and III. BASEL-I is relatively more simple compared to the later versions, in the sense that, its scope of definition of risk was limited only to credit risk. BASEL-II is a more advanced version of its predecessor in defining the scope and domain of banking risk. It points out three main areas of risks: Minimum Capital Requirements, Supervisory Review and market discipline. These are called the three pillars of BASEL. The focus of BASEL-II has been to strengthen the international banking requirements as well as to supervise and enforce these requirements. BASEL-III is the recent most version of the BASEL accords and most banks seeks compliance with it by the end of 2018. BASEL-III discusses the three pillars professed by BASEL-II in a more detailed manner by increasing the scope of the three pillars. In this blog we will discuss the three pillars of BASEL accords and the opportunities they generate in the analytics industry.

Pillar 1: Minimum Capital Requirements

BASEL-II emphasises that banks must have adequate capital to cover the three areas of risk exposure: Credit risk, Operational Risk and Market Risk. Credit risks are those which arise from the default on the loans made to obligors. The default occurs when obligors fail to make required payments. Operational Risk arises from failed internal processes. It includes legal risk, but excludes strategic and reputation risk. Market risks arise from losses on and off balance sheet position arising from movement in market prices. Statistical models are extensively used to develop predictive models for identifying the credit, operational and market risks. Probability of Default (PD), Loss given Default (LGD) and Exposure at Default (EAD) models are built to identify the inherent credit risk in the bank’s portfolio. Market risks are modelled using Value at Risk (VaR) and Economic Capital (ECAP) models. Building these models require a sound understanding of (i) the relevant business for which model development is done (ii) statistical techniques like Logistic Regression, Linear Regression, Time Series Analysis (both basic and advanced) (iii) segmentation techniques like CHAID, CART, Cluster analysis etc. and (iv) a very good understanding of soft wares like SAS, EXCEL and R.

Pillar 2: Supervisory Review

It provides with a framework to deal with risk related to systemic, pension, strategic, concentration, liquidity, legal and reputational. The accord combines all these risks under the title of residual risk. The aim of this pillar is to give better tools to the regulators. Black-Scholes-Merton of option pricing forms the basis of modeling for most of these risks (especially systemic risks). In order to develop this type of model you are required to have sound knowledge in terms of simulation Stochastic processes.

Pillar 3: Market Discipline

Market discipline supplements regulation as sharing of information facilitates assessment of the bank by others, including investors, analysts, customers, other banks, and rating agencies, which leads to good corporate governance. The aim of Pillar 3 is to allow market discipline to operate by requiring institutions to disclose details on the scope of application, capital, risk exposures, risk assessment processes, and the capital adequacy of the institution. It must be consistent with how the senior management, including the board, assess and manage the risks of the institution.

Banks require being compliant with all the three pillars of BASEL accords for prudently managing their risks. Hence Systematically Important Financial Institutions like Wells Fargo, HSBC, American Express, Bank of New York Mellon etc. look for resources with sound understanding of these pillars and the statistical knowledge required building models for their captive risk management process. Managing banking risk is perhaps the safest business to invest in as the extent of risks and regulatory compliance for banks are increasing overtime. Over the next few blogs we will try to understand the capital structures of banks and development of different BASEL compliant models for different pillars and capital tiers of banks.

Call us to know more