Certificate in Business Analytics Archives - DexLab Analytics | Big Data Hadoop SAS R Analytics Predictive Modeling & Excel VBA

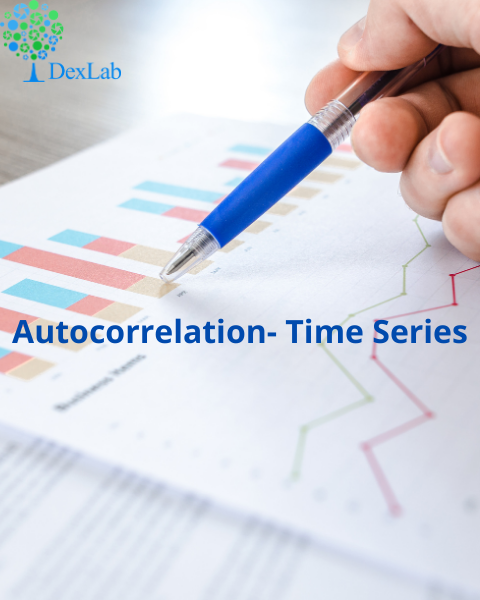
Autocorrelation- Time Series – Part 3

Autocorrelation is a special case of correlation. It refers to the relationship between successive values of the same variables .For example if an individual with a consumption pattern:-

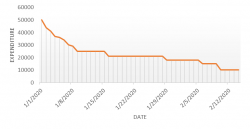
spends too much in period 1 then he will try to compensate that in period 2 by spending less than usual. This would mean that Ut is correlated with Ut+1 . If it is plotted the graph will appear as follows :

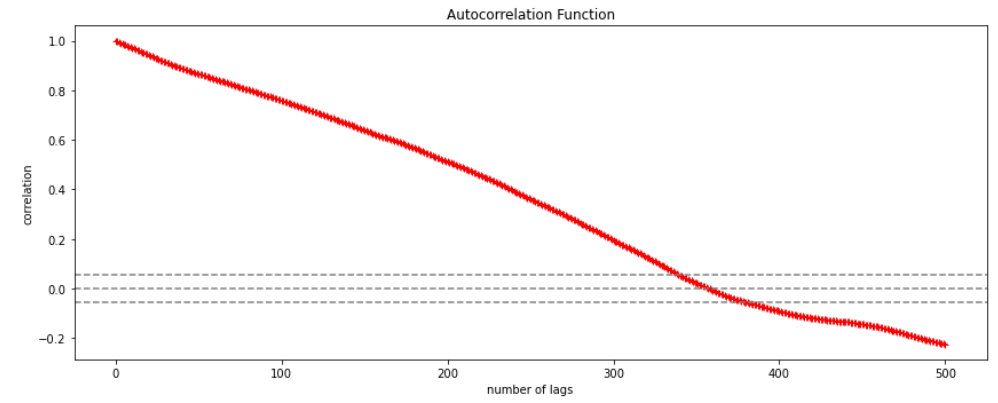
Positive Autocorrelation : When the previous year’s error effects the current year’s error in such a way that when a graph is plotted the line moves in the upward direction or when the error of the time t-1 carries over into a positive error in the following period it is called a positive autocorrelation.
Negative Autocorrelation : When the previous year’s error effects the current year’s error in such a way that when a graph is plotted the line moves in the downward direction or when the error of the time t-1 carries over into a negative error in the following period it is called a negative autocorrelation.

Now there are two ways of detecting the presence of autocorrelation
By plotting a scatter plot of the estimated residual (ei) against one another i.e. present value of residuals are plotted against its own past value.

If most of the points fall in the 1st and the 3rd quadrants , autocorrelation will be positive since the products are positive.

If most of the points fall in the 2nd and 4th quadrant , the autocorrelation will be negative, because the products are negative.
By plotting ei against time : The successive values of ei are plotted against time would indicate the possible presence of autocorrelation .If e’s in successive time show a regular time pattern, then there is autocorrelation in the function. The autocorrelation is said to be negative if successive values of ei changes sign frequently.
First Order of Autocorrelation (AR-1)
When t-1 time period’s error affects the error of time period t (current time period), then it is called first order of autocorrelation.
AR-1 coefficient p takes values between +1 and -1
The size of this coefficient p determines the strength of autocorrelation.
A positive value of p indicates a positive autocorrelation.
A negative value of p indicates a negative autocorrelation
In case if p = 0, then this indicates there is no autocorrelation.
To explain the error term in any particular period t, we use the following formula:-

Where Vt= a random term which fulfills all the usual assumptions of OLS
How to find the value of p?

One can estimate the value of ρ by applying the following formula :-
Time Series Analysis Part I


A time series is a sequence of numerical data in which each item is associated with a particular instant in time. Many sets of data appear as time series: a monthly sequence of the quantity of goods shipped from a factory, a weekly series of the number of road accidents, daily rainfall amounts, hourly observations made on the yield of a chemical process, and so on. Examples of time series abound in such fields as economics, business, engineering, the natural sciences (especially geophysics and meteorology), and the social sciences.

  • Univariate time series analysis- When we have a single sequence of data observed over time then it is called univariate time series analysis.
  • Multivariate time series analysis – When we have several sets of data for the same sequence of time periods to observe then it is called multivariate time series analysis.

The data used in time series analysis is a random variable (Yt) where t is denoted as time and such a collection of random variables ordered in time is called random or stochastic process.

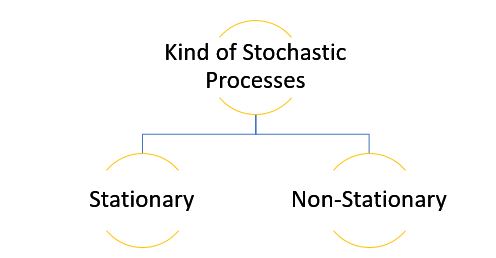
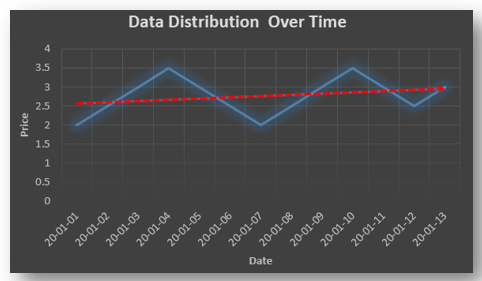
Stationary: A time series is said to be stationary when all the moments of its probability distribution i.e. mean, variance , covariance etc. are invariant over time. It becomes quite easy forecast data in this kind of situation as the hidden patterns are recognizable which make predictions easy.

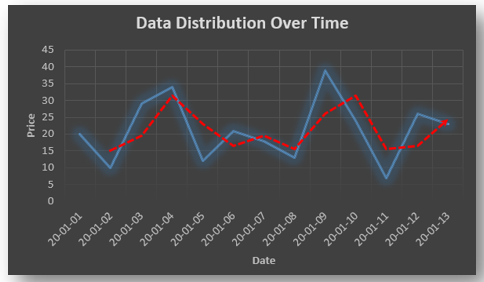
Non-stationary: A non-stationary time series will have a time varying mean or time varying variance or both, which makes it impossible to generalize the time series over other time periods.

Non stationary processes can further be explained with the help of a term called Random walk models. This term or theory usually is used in stock market which assumes that stock prices are independent of each other over time. Now there are two types of random walks:
Random walk with drift : When the observation that is to be predicted at a time ‘t’ is equal to last period’s value plus a constant or a drift (α) and the residual term (ε). It can be written as
Yt= α + Yt-1 + εt
The equation shows that Yt drifts upwards or downwards depending upon α being positive or negative and the mean and the variance also increases over time.
Random walk without drift: The random walk without a drift model observes that the values to be predicted at time ‘t’ is equal to last past period’s value plus a random shock.
Yt= Yt-1 + εt
Consider that the effect in one unit shock then the process started at some time 0 with a value of Y0
When t=1
Y1= Y0 + ε1
When t=2
Y2= Y1+ ε2= Y0 + ε1+ ε2
In general,
Yt= Y0+∑ εt
In this case as t increases the variance increases indefinitely whereas the mean value of Y is equal to its initial or starting value. Therefore the random walk model without drift is a non-stationary process.

So, with that we come to the end of the discussion on the Time Series. Hopefully it helped you understand time Series, for more information you can also watch the video tutorial attached down this blog. DexLab Analytics offers machine learning courses in delhi. To keep on learning more, follow DexLab Analytics blog.


.

Citizen Data Scientists: Who Are They & What Makes Them Special?

Citizen Data Scientists: Who Are They & What Makes Them Special?

Companies across the globe are focusing their attention on data science to unlock the potentials of their data. But, what remains crucial is finding well trained data scientists for building such advanced systems.

Today, a lot many organizations are seeking citizen data scientists – though the notion isn’t something new, the practice is fairly picking up pace amongst the industries. Say thanks to a number of factors, including perpetual improvement in the quality of tools and difficulty in finding properly skilled data scientists!

Gartner, a top notch analyst firm has been promoting this virgin concept for the past few years. In 2014, the firm predicted that the total number of citizen data scientists would expand 5X faster than normal data scientists through 2017. Although we are not sure if the number forecasted panned out right but what we know is that the proliferating growth of citizen data scientists exceeded our expectations.

Recently, Gartner analyst Carlie Idoine explained a citizen data scientist is one who “creates or generates models that use advanced diagnostic analytics or predictive and prescriptive capabilities, but whose primary job function is outside the field of statistics and analytics.” They are also termed as “power users”, who’ve the ability to perform cutting edge analytical tasks that require added expertise. “They do not replace the experts, as they do not have the specific, advanced data science expertise to do so. But they certainly bring their OWN expertise and unique skills to the process,” she added.

Of late, citizen data scientists have become critical assets to an organization. They help businesses discover key big data insights and in the process are being asked to derive answers from data that’s not available from regular relational database. Obviously, data can’t be queried through SQL, either. As a result, citizen data scientists are found leveraging machine learning models that end up generating predictions from a large number of data types. No wonder, SQL always sounds effective, but Python statistical libraries and Jupyter notebooks helps you further.

 A majority of industries leverages SQL; it has been data’s lingua franca for years. The sheer knowledge of how to write a SQL query to unravel a quiver of answers out of relational databases still remains a crucial element of company’s data management system as a whole lot of business data of companies are stored in their relational databases. Nevertheless, advanced machine learning tools are widely gaining importance and acceptance.

A wide array of job titles regarding citizen data scientists exists in the real world, and some of them are mutation of business analyst job profile. Depending on an organization’s requirements, the need for experienced analysts and data scientists varies.

Looking for a good analytics training institute in Delhi? Visit DexLab Analytics.

DataRobot, a pioneering proprietary data science and machine learning automation platform developer is recently found helping citizen data scientists through the power of automation. “There’s a lot happening behind the scenes that folks don’t realize necessarily is happening,” Jen Underwood, a BI veteran and the recently hired DataRobot’s director of product marketing said. “When I was doing data science, I would run one algorithm at a time. ‘Ok let’s wait until it ends, see how it does, and try another, one at a time.’ [With DataRobot] a lot of the steps I was taking are now automated, in addition to running the algorithms concurrently and ranking them.”

To everyone’s knowledge, Big Data Analytics is progressing, capabilities that were once restricted within certain domains of professionals are now being accessible by a wider pool of interested parties. So, if you are interested in this new blooming field of opportunities, do take a look at our business analyst training courses in Gurgaon. They would surely help you in charting down a successful analyst career.


The blog has been sourced fromdatanami.com/2018/08/13/empowering-citizen-data-science


Interested in a career in Data Analyst?

To learn more about Data Analyst with Advanced excel course – Enrol Now.
To learn more about Data Analyst with R Course – Enrol Now.
To learn more about Big Data Course – Enrol Now.

To learn more about Machine Learning Using Python and Spark – Enrol Now.
To learn more about Data Analyst with SAS Course – Enrol Now.
To learn more about Data Analyst with Apache Spark Course – Enrol Now.
To learn more about Data Analyst with Market Risk Analytics and Modelling Course – Enrol Now.

#TimeToReboot: 10 Random, Fun Facts You Must Know About IT Industry

#TimeToReboot: 10 Random, Fun Facts You Must Know About IT Industry

Indian IT sector is expected to grow at a modest rate this fiscal year, which started from April – companies are expanding their scopes and building new capabilities or enhancing the older ones. Demand for digital services is showing spiked up trends. The good news is that the digital component industry is flourishing, faster than expected. It’s forming a bigger part of tech-induced future, and we’re all excited!!

On that positive note, here we’ve culled down a few fun facts about IT industry that are bound to intrigue your data-hungry heart and mind… Hope you’ll enjoy the read as much as I did while scampering through research materials to compile this post!

Let’s get started…

Email is actually older than the World Wide Web.

Our very own, Hewlett Packard started in a garage… In fact, several other top notch US digital natives, including Microsoft, Google and Apple had such humble beginnings.

Bill Gates’ own house was designed using a MAC PC, yes you heard that right!

The very first computer mouse was carved out of wood. Invented by Dough Engelbart, first-ever mouse wasn’t made of any plastic or metal of any kind, but plain, rustic WOOD.

The QWERTY keyboard, which we use now, is simple, easy to use and effective. But, did you know: DVORAK keyboard was proven to be at least 20X faster?

The original name of Windows OS was Interface Manager.

Do you think 1GigaByte is enough? Well, the first 1 GB hard drive made news in 1980 with a price tag of $40.000 and gross weight of 550 pounds.

Very first PC was known as ‘Simon’ from Berkley Enterprise. It was worth $300, which was quite an ostentatious amount back in the 1950s, the year when this PC was launched.

In 1950’s computers were called ‘Electronic Brains’.

1 out of 8 marriages in the US happened between couples who’ve met online. Wicked?


Feeling excited to know all these stuffs… Now, on serious note, in the days to come, the Indian IT industry is all set to transform itself with high velocity tools and technology, and if you want to play a significant role in this digital transformation, arm yourself with decent data-friendly skill or tool.

The deal turns sweeter if you hail from computer science background or have a knack to play with numbers. If such is the case, we have high end business analyst training courses in Gurgaon to suit your purpose and career aspiration – drop by DexLab Analytics, being a top of the line analytics training institute, they bring to you a smart concoction of knowledge, aptitude and expertise in the form of student-friendly curriculum. For more details, visit their site today.


The blog has been sourced from:

qarea.com/blog/facts-from-the-it-industry

forbesindia.com/article/leaderboard/indian-it-services-sector-time-for-a-reboot/49671/1


Interested in a career in Data Analyst?

To learn more about Data Analyst with Advanced excel course – Enrol Now.
To learn more about Data Analyst with R Course – Enrol Now.
To learn more about Big Data Course – Enrol Now.

To learn more about Machine Learning Using Python and Spark – Enrol Now.
To learn more about Data Analyst with SAS Course – Enrol Now.
To learn more about Data Analyst with Apache Spark Course – Enrol Now.
To learn more about Data Analyst with Market Risk Analytics and Modelling Course – Enrol Now.

How To Incorporate Embedded Analytics In Your Products or Applications?

How To Incorporate Embedded Analytics In Your Products or Applications?

The adept R&D team shares a common responsibility – devising incredible products and solutions.  Right from VPs and directors of development to DevOps and system engineers – every professional is well aware about their customer expectations.

In today’s data-driven industry, customers desire to collect information regarding product use, numerous status updates, number of times they engaged with the product and so on. In short, they need access to data that not only help unravel crucial insights but also makes the product fetching.

Definitely, you can create your very own analytics solution, but what if it takes so much time that your competitors outgo you? So, what next?

Embedding analytics into your product or application can be your thing for the day, but how to do it effortlessly?

2

Collect Data from Various Sources

We are surrounded by IoT (Internet of Things) and IIoT (Industrial Internet of Things) revolution, where each connected device and sensor accumulates data and this collection and analysis of data is significant to customers. Teams need to sit together and discuss out options for creating an analytics overlay for the product, which will trigger a million questions – how can we get through it? Will our solution scale the growth of number of users? How can we go on improving our products? How do we keep up with all the developments happening in analytics?

Things to Consider While Embedding Analytics

“Start by looking for specific analytic applications that complement your ERP and BI platform investments. In the long term, review vendor capability to support reusable analytics artifacts (i.e., services) in a service-oriented architecture environment,” – says Gartner.

To this, we’ve listed a few functionalities waiting for your attention:

Data Access – How simple do you want your platform to be so as to integrate your data well across all sources and types?

Visualization – Does the platform you chose comprise widgets you need? If not, can you develop them using customization options?

Modeling – How much easier will it be to code for data preparation for user consumption?

Embeddability (iFrame, JS libraries, JavaScript) – Dashboards should be built in a way to suit your customer’s requirements either in mobiles or in web-based applications.

Extensibility (APIs, SDK, JavaScirpt) – No hard fact, for incorporating analytics workflow, solutions supporting API is the key. Otherwise, not getting extensibility will leave you tied to the same analytics platform and can cost you consulting fees and vendor-developed modifications.

Process integration – Generally, integration takes months – so find a vendor who is capable enough to integrate with your products in a week or two so that you remain focused on the benefits alone.

Security – Judge a vendor based on his security credentials – it’s one of the most crucial considerations to tick off your checklist.

As last thoughts, the consideration of these 7 functionalities is just the beginning of embedding analytics into your products or applications. To sail through, the most important thing to do is to choose a suitable vendor who will grow and start thinking of you as a partner and not just any customer. Let him offer you quick, easy and seamless integration, and you solely focus on your customer needs and preferences, and for this, they will LOVE YOU for sure!

If you are still confused about embedded analytics or related concept, let career-building business analyst training courses in Noida help you! For more information on business analyst training delhi, drop by DexLab Analytics.


This blog has been sourced from – https://www.sisense.com/blog/going-embedded-pillar-analytics-success


Interested in a career in Data Analyst?

To learn more about Data Analyst with Advanced excel course – Enrol Now.
To learn more about Data Analyst with R Course – Enrol Now.
To learn more about Big Data Course – Enrol Now.

To learn more about Machine Learning Using Python and Spark – Enrol Now.
To learn more about Data Analyst with SAS Course – Enrol Now.
To learn more about Data Analyst with Apache Spark Course – Enrol Now.
To learn more about Data Analyst with Market Risk Analytics and Modelling Course – Enrol Now.

Take Small Steps With Big Feet of Business Analytics

Take Small Steps With Big Feet of Business Analytics

Do these following questions clog your mind?

I aspire to become a business analytics professional, but I don’t know what skills to possess?

I am sceptical; which training should I opt for in order to establish my career in the sphere of business analytics?

I am looking forward to switch my career into data analytics, but I don’t know which skills to imbibe for better prospects?

Answer: Yes, they do.

Continue reading “Take Small Steps With Big Feet of Business Analytics”

Call us to know more