Business Intelligence Archives - DexLab Analytics | Big Data Hadoop SAS R Analytics Predictive Modeling & Excel VBA

Autocorrelation- Time Series – Part 3

Autocorrelation is a special case of correlation. It refers to the relationship between successive values of the same variables .For example if an individual with a consumption pattern:-

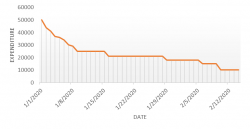
spends too much in period 1 then he will try to compensate that in period 2 by spending less than usual. This would mean that Ut is correlated with Ut+1 . If it is plotted the graph will appear as follows :

Positive Autocorrelation : When the previous year’s error effects the current year’s error in such a way that when a graph is plotted the line moves in the upward direction or when the error of the time t-1 carries over into a positive error in the following period it is called a positive autocorrelation.
Negative Autocorrelation : When the previous year’s error effects the current year’s error in such a way that when a graph is plotted the line moves in the downward direction or when the error of the time t-1 carries over into a negative error in the following period it is called a negative autocorrelation.

Now there are two ways of detecting the presence of autocorrelation
By plotting a scatter plot of the estimated residual (ei) against one another i.e. present value of residuals are plotted against its own past value.

If most of the points fall in the 1st and the 3rd quadrants , autocorrelation will be positive since the products are positive.

If most of the points fall in the 2nd and 4th quadrant , the autocorrelation will be negative, because the products are negative.
By plotting ei against time : The successive values of ei are plotted against time would indicate the possible presence of autocorrelation .If e’s in successive time show a regular time pattern, then there is autocorrelation in the function. The autocorrelation is said to be negative if successive values of ei changes sign frequently.
First Order of Autocorrelation (AR-1)
When t-1 time period’s error affects the error of time period t (current time period), then it is called first order of autocorrelation.
AR-1 coefficient p takes values between +1 and -1
The size of this coefficient p determines the strength of autocorrelation.
A positive value of p indicates a positive autocorrelation.
A negative value of p indicates a negative autocorrelation
In case if p = 0, then this indicates there is no autocorrelation.
To explain the error term in any particular period t, we use the following formula:-

Where Vt= a random term which fulfills all the usual assumptions of OLS
How to find the value of p?

One can estimate the value of ρ by applying the following formula :-

Time Series Analysis Part I


A time series is a sequence of numerical data in which each item is associated with a particular instant in time. Many sets of data appear as time series: a monthly sequence of the quantity of goods shipped from a factory, a weekly series of the number of road accidents, daily rainfall amounts, hourly observations made on the yield of a chemical process, and so on. Examples of time series abound in such fields as economics, business, engineering, the natural sciences (especially geophysics and meteorology), and the social sciences.

  • Univariate time series analysis- When we have a single sequence of data observed over time then it is called univariate time series analysis.
  • Multivariate time series analysis – When we have several sets of data for the same sequence of time periods to observe then it is called multivariate time series analysis.

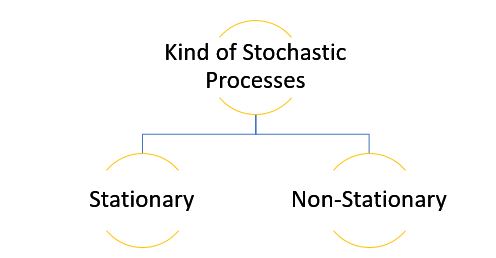
The data used in time series analysis is a random variable (Yt) where t is denoted as time and such a collection of random variables ordered in time is called random or stochastic process.

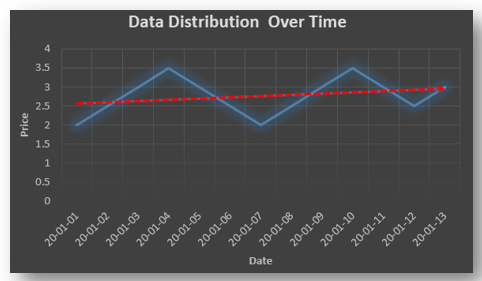
Stationary: A time series is said to be stationary when all the moments of its probability distribution i.e. mean, variance , covariance etc. are invariant over time. It becomes quite easy forecast data in this kind of situation as the hidden patterns are recognizable which make predictions easy.

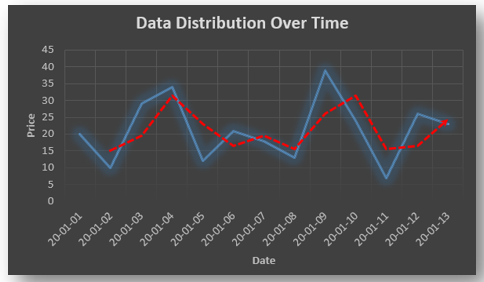
Non-stationary: A non-stationary time series will have a time varying mean or time varying variance or both, which makes it impossible to generalize the time series over other time periods.

Non stationary processes can further be explained with the help of a term called Random walk models. This term or theory usually is used in stock market which assumes that stock prices are independent of each other over time. Now there are two types of random walks:
Random walk with drift : When the observation that is to be predicted at a time ‘t’ is equal to last period’s value plus a constant or a drift (α) and the residual term (ε). It can be written as
Yt= α + Yt-1 + εt
The equation shows that Yt drifts upwards or downwards depending upon α being positive or negative and the mean and the variance also increases over time.
Random walk without drift: The random walk without a drift model observes that the values to be predicted at time ‘t’ is equal to last past period’s value plus a random shock.
Yt= Yt-1 + εt
Consider that the effect in one unit shock then the process started at some time 0 with a value of Y0
When t=1
Y1= Y0 + ε1
When t=2
Y2= Y1+ ε2= Y0 + ε1+ ε2
In general,
Yt= Y0+∑ εt
In this case as t increases the variance increases indefinitely whereas the mean value of Y is equal to its initial or starting value. Therefore the random walk model without drift is a non-stationary process.

So, with that we come to the end of the discussion on the Time Series. Hopefully it helped you understand time Series, for more information you can also watch the video tutorial attached down this blog. DexLab Analytics offers machine learning courses in delhi. To keep on learning more, follow DexLab Analytics blog.


.

Business Intelligence Software in the Key for an Organization to Gain Competitive Advantage

Business Intelligence, or BI, is crucial for organizations as strategic planning is heavily dependent on BI. BI tools are multi-purpose and used for indicating progress towards business goals, quantitatively analyzing data, distribution of data and developing customer insights.

Advanced computer technologies are applied in Business Intelligence to discover relevant business data and then analyze it. It not only spots current trends in data, but is also able to develop historical views and future predictions. This helps decision-makers to comprehend business information properly and develop strategies that will steer their organization forward.

BI tools transform raw business information into valuable data that increase revenue for organizations. The global business economy is completely data driven. Companies without BI software will be jeopardizing their success. It is time to shed the belief that BI software is superfluous. Rather, it is a necessity.

Here is a list of 10 important things that BI solutions can help your organization achieve. After reading these you will be convinced that BI is vital in taking your business forward.

  1. Provide speedy and competent information for your business

Nowadays, there isn’t much time to ponder over data sheets and then come to a conclusion. Decisions have to be taken on the spot. Valuable information doesn’t include business data alone, but also what the data implies for your business. BI gives you a competitive lead as it provides valuable information with the push of a button.

  1. Provide KPIs that boost the performance of your business.

Business Intelligence software provides KPIs (Key Performance Indicators), which are metrics aligned with your business strategies. Thus, businesses can make decisions based on solid facts instead of intuition. This makes business proceedings more efficient.

  1. Employees have data-power

BI solutions help employees to make informed decisions backed by relevant data. Access to information across all levels ensures company-wide integration of data. This helps employees nurture their skills. A competitive workforce will help a company gain global recognition.

  1. Determine the factors that generate revenue for your business

Business intelligence is able to determine where and how potential customers consume data, how to convert them to paying customers, and chalk out an appropriate plan that will help increase revenue for your business.

  1. Avoid blockages in markets

There are many BI applications that can be incorporated with accounting software. Business intelligence provides information about the real health of an organization, which cannot be determined from a profit and loss sheet. BI includes predictive features that help avoid blockages in markets and determine the right time for important decisions, like hiring new employees. Easy-to understand dashboards enable decision-makers to stay informed.

  1. Create an efficient business model

As explained by Jeremy Levi, Director of Marketing, MarsWellness.com, ‘’ Why is BI more important than ever? In one word: oversaturation. The internet and the continued growth of e-commerce have saturated every market…For business owners, this means making smart decisions and trying to know where to put your marketing dollars and where to invest in infrastructure. Business intelligence lets you do that, and without it, you’re simply fumbling around for the light switch in the dark.”

  1. Improved customer insights

In the absence of BI tools, one can spend hours trying to make sense out of previous reports without coming to a satisfactory conclusion. It is crucial for businesses to meet customer demands. BI tools help map patterns in customer behavior so businesses can prioritize loyal customers and improve customer satisfaction.

  1. Helps save money

BI tools help spot areas in your business where costs can be minimized. For example, there is unnecessary spending occurring in the supply chain. BI can identify whether it is inefficient acquisition or maintenance that is translating to increased costs. Thus, it enables businesses to take the necessary actions to cut costs.

  1. Improve efficiency of workers

Business intelligence solutions can monitor the output of members and functioning of teams. These help improve efficiency of the workers and streamline the business processes.

  1. Protects businesses from cyber threats

Cyber crimes like data breaches and malware attacks are very common. Cyber security has become the need of the hour. Businesses should invest in BI solutions equipped with security tools that help protect their valuable data from hackers and other cyber attacks.

Businesses will progress rapidly through the use of smart BI solutions. Organizations small or big, can use BI tools in a variety of areas, starting from budgets to building relationship with customers.

If you want to empower your business through BI then enroll yourself for the Tableau BI certification course at DexLab Analytics, Delhi. DexLab is a premium institute providing business analysis training in Delhi.

Interested in a career in Data Analyst?

To learn more about Machine Learning Using Python and Spark – click here.
To learn more about Data Analyst with Advanced excel course – click here.
To learn more about Data Analyst with SAS Course – click here.
To learn more about Data Analyst with R Course – click here.
To learn more about Big Data Course – click here.

How Credit Unions Can Capitalize on Data through Enterprise Integration of Data Analytics

credit risk analysis

To get valuable insights from the enormous quantity of data generated, credit unions need to move towards enterprise integration of data. This is a company-wide data democratization process that helps all departments within the credit union to manage and analyze their data. It allows each team member easy-access and proper utilization of relevant data.

However, awareness about the advantages of enterprise-wide data analytics isn’t sufficient for credit unions to deploy this system. Here is a three step guide to help credit unions get smarter in data handling.

Improve the quality of data

A robust and functional customer data set is of foremost importance. Unorganized data will hinder forming correct opinions about customer behavior. The following steps will ensure that relevant data enters the business analytics tools.

  • Integration of various analytics activity- Instead of operating separate analytics software for digital marketing, credit risk analytics, fraud detection and other financial activities, it is better to have a centralized system which integrates these activities. It is helpful for gathering cross-operational cognizance.
  • Experienced analytics vendors should be chosen- Vendors with experience can access a wide range of data. Hence, they can deliver information that is more valuable. They also provide pre-existing integrations.
  • Consider unconventional sources of data- Unstructured data from unconventional sources like social media and third-parties should be valued as it will prove useful in the future.
  • Continuous data cleansing that evolves with time- Clean data is essential for providing correct data. The data should be organized, error-free and formatted.

Data structure customized for credit unions

The business analytics tools for credit unions should perform the following analyses:

  • Analyzing the growth and fall in customers depending on their age, location, branch, products used, etc.
  • Measure the profit through the count of balances
  • Analyze the Performances of the staffs and members in a particular department or branch
  • Sales ratios reporting
  • Age distribution of account holders in a particular geographic location.
  • Perform trend analysis as and when required
  • Analyze satisfaction levels of members
  • Keep track of the transactions performed by members
  • Track the inquires made at call centers and online banking portals
  • Analyze the behavior of self-serve vs. non-self serve users based on different demographics
  • Determine the different types of accounts being opened and figure out the source responsible for the highest transactions.

User-friendly interfaces for manipulating data

Important decisions like growing revenue, mitigating risks and improving customer experience should be based on insights drawn using analytics tools. Hence, accessing the data should be a simple process. These following user-interface features will help make data user-friendly.

Dashboards- Dashboards makes data comprehensible even for non-techies as it makes data visually-pleasing. It provides at-a glance view of the key metrics, like lead generation rates and profitability sliced using demographics. Different datasets can be viewed in one place.

Scorecards- A scorecard is a type of report that compares a person’s performance against his goals. It measures success based on Key Performance Indicators (KPIs) and aids in keeping members accountable.

Automated reports- Primary stakeholders should be provided automated reports via mails on a daily basis so that they have access to all the relevant information.

Data analytics should encompass all departments of a credit union. This will help drawing better insights and improve KPI tracking. Thus, the overall performance of the credit union will become better and more efficient with time.

Technologies that help organizations draw valuable insights from their data are becoming very popular. To know more about these technologies follow Dexlab Analytics- a premier institute providing business analyst training courses in Gurgaon and do take a look at their credit risk modeling training course.

Interested in a career in Data Analyst?

To learn more about Machine Learning Using Python and Spark – click here.
To learn more about Data Analyst with Advanced excel course – click here.
To learn more about Data Analyst with SAS Course – click here.
To learn more about Data Analyst with R Course – click here.
To learn more about Big Data Course – click here.

Business Intelligence: Now Every Person Can Use Data to Make Better Decisions

The fascinating world of Business Intelligence is expanding. The role of data scientists is evolving. The mysticism associated with data analytics is breaking off, making a way for non-technical background people to understand and dig deeper into the nuances and metrics of data science.
 
Business Intelligence: Now Every Person Can Use Data to Make Better Decisions
 

“Data democratization is about creating an environment where every person who can use data to make better decisions, has access to the data they need when they need it,” says Amir Orad, CEO of BI software company Sisense. Data is not to be limited only in the hands of data scientists, employees throughout the organization should have easy access to data, as and when required.

Continue reading “Business Intelligence: Now Every Person Can Use Data to Make Better Decisions”

Role of R In Business Intelligence

To put it simply Business Intelligence is the action of extracting and to derive information that may be of use from the available data. As might be evident the process is a broad one where the quality and the source of the data structure is variable. Transformations like this might in technical terms be described as ETL or extract, transform and load in addition to the presentation of information that is of use.


role of r in business intelligence

R Programming in Business Intelligence

Some R Programming Experts hold that R is fully able to take on the role of the engine for processes related to BI. Here we will focus only on the BI function of R i.e. to extract, transform load and present information and data. The following packages correspond to indicated processes in Business Intelligence.


Extract


Extraction


  •  RODBC
  • DBI
  • data.table’s fread
  • RJDBC


In addition to these, there are several other packages that support data in a variety of formats.


Transform


  • data.table
  • dplyr


Load


  • DBI
  • RODBC
  • RJDBC


Let’s Take Your Data Dreams to the Next Level


Prsentation


Presenting data is a wholly different ball game than the previously mentioned process of ETL. Never fear, it may be outsourced with ease to tools of BI dashboard with ease by populating the structure of data according to the expectations of the particular data tool. R is able to create a dashboard of a web app directly from within itself through packages like:


  •  shiny
  • httpuv
  • opencpu
  • rook


These packages let you play host to interactive web apps. They have the ability to query the data in an interactive manner and generate interactive plots. The basis for all of these is an R session engine and is able to execute all functions of R and may leverage the capabilities of statistics of all packages in R.


2


Extras


The above mentioned packages serve as the core whose functionality may be simplified through the use of the packages mentioned below:


  • db.r
  • ETLUtils
  • Sqldf
  • Dplyr
  •  shinyBI
  • dwtools


The following factors are critical while R is adopted by businesses:


  • Extraction / Loading
  • Performance and scalability
  • Presentation
  • Support and licensing


For more details on R Programming, get yourself enrolled in superior R programming courses in Pune. R programming certification in Pune by DexLab Analytics is extremely popular.


Interested in a career in Data Analyst?

To learn more about Machine Learning Using Python and Spark – click here.
To learn more about Data Analyst with Advanced excel course – click here.
To learn more about Data Analyst with SAS Course – click here.
To learn more about Data Analyst with R Course – click here.
To learn more about Big Data Course – click here.

Success factors for Business Intelligence program

Success factors for Business Intelligence program

To implement a successful Business Intelligence program, one needs to understand the dimensions that are critical to success of the BI program. Here we will discuss six critical success factors for the BI program.

Critical Dimension 1 – Strong Executive Support

If there is one dimension or critical attribute that has major influence on successfully implementing the BI program would be strong executive support. If there is any lack of enthusiasm at the top will filter downwards. A key component of obtaining strong executive support is a convincing and detailed business case for BI.

bc237409f3248ab18758b8ba3d22d3ee

Critical Dimension 2 – Key Stakeholder Identification

Early identification and prioritisation of the key stakeholders are crucial. If we do not know who will benefit from a BI solution, it is unlikely that we can persuade anyone that is in their best interest to support the BI initiative.

5

Critical Dimension 3 – Creation of Business Intelligence Competency Center (BICC) Many organizations have created a separate BICC to manage the lifecycle of analytics processes. Organizations must keep in mind while creating a BICC is that the need of Business Intelligence. They should ask all the strategic and tactical question before creating a BICC. Some of the key objective of BICC shall be


  • Maximise the efficiency, deployment and quality of BI across all lines of business.
  • Deliver more value at less cost and in less time through more successful BI deployments.
Also read: Business Intelligence: Now Every Person Can Use Data to Make Better Decisions

Critical Dimension 4 – Clear Outcome Identification

This dimension determines what outcomes the organization desires, and whether they are tactical or strategic.

  • Knowledge – What knowledge is needed for desired outcomes and where is it?
  • Information – What information structures can be identified from knowledge gathering and how can these same structures be beneficial.
  • Data – What sources of raw data are needed to populate the information structures?

Pursuing the answers to these questions requires both logic and creativity. We also need specific information at various steps in the BI process.

Also read: Trends to Watch Out – Global Self-service Business Intelligence (BI) Market 2017

Critical Dimension 5 – Integrating CSFs (Critical Success Factors) and KPIs to Business Drivers

Many business initiatives aim to obtain benefits – greater efficiency, quicker access to information that are hard to quantify. We can easily accept that greater efficiency is a good thing, but trying to quantify its precise cash value to the organization can be a challenge. These benefits are essentially intangible but need to be measured.

Therefore, when identifying these key values, they can be classified as “driving” strategy, organization or operations.

Strategic Drivers Influence:
  • Market attractiveness
  • Competitive strengths
  • Market share
Organisational Drivers Influence:
  • Culture
  • Training and development
Operational Drivers Influence:
  • Customer satisfaction
  • Product Excellence
Also read: Role of R In Business Intelligence

Critical Dimension 6 – Analytics Awareness

Organizations have a tendency to measure what is easy to measure – internal transactional data. Extending the sensitivity of the organization to external and internal data presents a fuller picture to decision makers of the organization and the competitive environment. If measures are appropriate, the organisation can start to improve the processes.

When the above mentioned six critical dimension of BI solution are place. Organizations can benefit the value from the BI solutions are exponential in manner.

6

For better implementation of BI Program, why not take up effective market risk courses offered by DexLab Analytics! Market Risk Analytics is a growing field of study; for more details visit the site.


Interested in a career in Data Analyst?

To learn more about Data Analyst with Advanced excel course – Enrol Now.
To learn more about Data Analyst with R Course – Enrol Now.
To learn more about Big Data Course – Enrol Now.

To learn more about Machine Learning Using Python and Spark – Enrol Now.
To learn more about Data Analyst with SAS Course – Enrol Now.
To learn more about Data Analyst with Apache Spark Course – Enrol Now.
To learn more about Data Analyst with Market Risk Analytics and Modelling Course – Enrol Now.

Call us to know more