business analytics Archives - Page 7 of 8 - DexLab Analytics | Big Data Hadoop SAS R Analytics Predictive Modeling & Excel VBA

Introduction To Credit Score Cards: Its Use in Crisis

The incident we are about to describe took place during 2009 circa at a party, a year in which the world was going through one of its worst financial crisis for the longest time. Every average bloke on the streets was aware of terms like mortgage-backed securities (MBS), sub-prime lending and credit crisis, after all these are the reasons for his plight.


Introduction To Credit Score Cards: Its Use in Crisis


But at this party we are speaking of, I was fortunate enough to meet with an informed and highly compassionate elderly woman, and after a few minutes of discussion the topic came to what we here do for a living. She wanted to know more about credit scorecard systems. As I further went on to explain the details of how this system works, her expression changed from being just plainly curious to angry to pained. Continue reading “Introduction To Credit Score Cards: Its Use in Crisis”

Are Regular Kali-Peelis Fighting Their Impending Antiquation?

A large amount of regular commuters of about 94%, feel that they have been harassed by the refusal of the usual Kali-peeli taxis. And about 80 percent of them say that the app-based services like Ola and Uber offer better options and convenience for travelling.


A survey conducted by the Mumbai Grahak Panchayat (MGP), during August 27-31, concluded that 29 percent of app-based cab systems have a very good rating system, while 28 percent of them said they are good. Only 19 percent of consumers revealed they were unsatisfied with the feedback system of such app-based services.


Here is an infographic that further elucidates how consumers. Continue reading “Are Regular Kali-Peelis Fighting Their Impending Antiquation?”

Can Creative AI Predict The Future?

Can Creative AI Predict The Future?

Artificial Intelligence is reaching new heights, as the researchers at Massachusetts Institute of Technology (MIT) have come up with a program that can estimate the future. The machines can predict the possible events that may occur in a given scenario. The scientists have programmed the machines in such a manner that they can transform a still image into a video. However, the experiment is in its initial stage and researchers wish that it would just get better with time.

Predicting the future

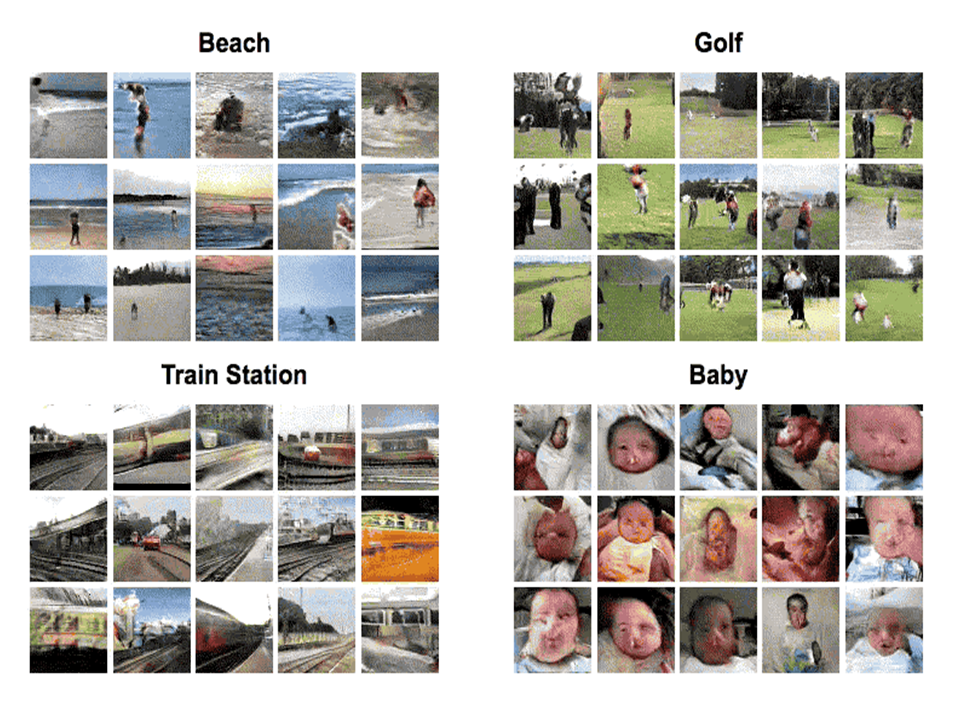
According to the researchers at MIT, this computer can view an image and figure out what may happen next. To be able to do so, the data scientists have fed the computers with humungous amounts of images and videos. All the videos and images were similar in terms of category. For example, videos of sea waves and beaches of previous years were input into the machines. So, the next time, when the computer is shown an image of a sea beach, it automatically generated a video from the still, which replicated how waves are hitting the shore and people are playing in the water. Similar experiments were conducted using images of newborn babies, golf players, and train stations. And in each case, the computer produced videos resembling the expression of these babies, movement of the golf clubs and trains approaching towards the platforms, respectively.

Predicting the future

But how does this machine do it?

As soon as enormous amounts of data are fed into the machine, it starts learning just as humans can. In this experiment by MIT, computers became familiar with the happenings at a sea beach. Therefore, the next time it is shown the picture of a sea beach, the machine analysed the image and eventually, showed what happens there. However, the scientists say that these videos have certain limitations.

According to Carl Vondrick, a Ph.D. student at the MIT, “AI can be trained to produce output just like human beings. They can recall an event and more importantly, AI can predict the possible outcomes of the event based on past records.” Thus, the deep learning programs are able to spot the similarity in several events and make predictions according to the past results, which may not be accurate in many times. From another perspective, these AI generated videos are too short, as their duration does not exceed 1 second. Moreover, the videos seem like some animated movements created during the 90’s.

Despite such limitations, scientists are hopeful about the future of AI because this experiment was just the beginning and the results were better than what was estimated. Vondrick expressed his views on how AI can help us stop any negative incident from happening. He said, “A machine can study the movements of an old man, which may enable it to forecast whether the person has a chance of falling. In that case, adequate measures can be taken in order to prevent the accident.”

Progress of the AI

Progress of the AI

Apart from MIT, there are several companies including the search engine giant Google that are working on AI. At the Google Cultural Institute (GCI) in Paris, computers are programmed to create new images and art forms. The GCI has developed an application that helps users to search artworks from the dataset of several museums across the world. What is fascinating is that algorithms solely administer the entire app. It can search the dataset of almost 7 million images and artworks and provide search results that match the search criteria. The most important feature of the program is that the application can figure out the difference between the emotions embedded in different pictures.  It can differentiate a peaceful picture from the rest by analysing its content. In addition, this program, also known as the ‘Deep Dream Project’ can create artworks on its own, which adds to the creativity of AI. Google is also working on the ‘Magenta Project’, which has recently created a piano melody on its own. The duration of the melody is 90-seconds and it is the first tangible music sample ever produced by AI.

Therefore, we can find that AI is enabling the computers to make judgements based on their intuition and at the same time, they are developing a sense of creativity. Days are not far when human beings will depend on AI to make their next move.

To get into the depth of the prowess of AI, opt for Machine Learning course online. DexLab Analytics is a leading Machine Learning training institute in Gurgaon. Go through their course itinerary.


Interested in a career in Data Analyst?

To learn more about Data Analyst with Advanced excel course – Enrol Now.
To learn more about Data Analyst with R Course – Enrol Now.
To learn more about Big Data Course – Enrol Now.

To learn more about Machine Learning Using Python and Spark – Enrol Now.
To learn more about Data Analyst with SAS Course – Enrol Now.
To learn more about Data Analyst with Apache Spark Course – Enrol Now.
To learn more about Data Analyst with Market Risk Analytics and Modelling Course – Enrol Now.

5 Analytics Tools To Improve Your Business Decisions

5 Analytics Tools To Improve Your Business Decisions

Big Data has proved to be inevitable for business organisations in the quest for stepping ahead of their competitors. Nevertheless, only having Big Data at hand does not solve problems. You also need the availability of efficient analytics software that can put your data to the best use.

A business analytics tool is responsible for analysing massive amounts of data in order to extract valuable information. Such information in turn, can be used for improving operational efficiency and for taking better decisions.

2

So, let us here go through the top 10 data analytics tools available in the market.

  • Yellowfin BI

Yellowfin Business Intelligence (BI) is a reporting, dashboard and data analysis software. The software is able to conduct analysis of huge amounts of database, in order to figure out appropriate information. With Yellowfin, your dashboard can be easily accessible from everywhere including company intranet, mobile device or web page.

  • Business Intelligence & Reporting Tools (BIRT)

BIRT is open source software programmed for JAVA and JAVA EE platforms. It consists of a runtime component and a visual report designer, which can be used for creating reports, visual data, and charts and so on. Information gathered from this software can be used for tracking historical data and analysing it and as well as for monitoring ongoing developments in various fields. BIRT can also be used for real-time decision-making purposes.

  • Clear Analytics

Clear Analytics is quite easy to manage as the software is based on Excel spreadsheets. While the software allows you to continue managing data using Excel, it also adds some extra features like reports scheduling, administrative capabilities, version control, governance etc. for better decision making. In short, Clear Analytics can be your choice in case you want high-end performance in exchange of minimal effort.

  • Tableau

Tableau is BI software that provides insight into the data that a business organisation requires for connecting the dots, in order to make clear and effective decisions. Data visualisation in Tableau is much dynamic and elaborative as compared to the other programmes available. Besides, it also provides easier access to data given its extended mobile device support. Additionally, the costs of implementing this program as well as its upgrade are relatively low.

  • GoodData

GoodData is a service BI platform. It takes into account both internal and external datasets (cloud) of an organisation to analyse and provide better governance. The platform is programmed for managing data security and governance thereby, consequently providing the user with the desired results. The most important feature of this platform is that it can analyse datasets of any size, thus making it effective for its users. Recently, the company rebranded their software as an Open Analytics platform.

These are some of the major analytics tools used by organisations irrespective of their scale in order to enhance their business intelligence. Whether you are looking to enhance your career or take better business decisions, a Data analyst certification course can help you to achieve such objectives. Data Analysis helps you to track the competitive landscape and figure out the essentials that needs to be done, in order to get ahead of your competitors. If you are a manager, you can take precise decisions based on quantitative data. Since big data is potential of driving your success, it is your job to master the science and use it for your advantage.


Interested in a career in Data Analyst?

To learn more about Data Analyst with Advanced excel course – Enrol Now.
To learn more about Data Analyst with R Course – Enrol Now.
To learn more about Big Data Course – Enrol Now.

To learn more about Machine Learning Using Python and Spark – Enrol Now.
To learn more about Data Analyst with SAS Course – Enrol Now.
To learn more about Data Analyst with Apache Spark Course – Enrol Now.
To learn more about Data Analyst with Market Risk Analytics and Modelling Course – Enrol Now.

Tell Your Kids To Be a Data Scientist Instead of a Doctor/Lawyer/Banker!

Back in the days of yore, parents would tell their kids that if you do not eat your veggies or study hard then your friends will be doctors, lawyers and bankers and you would have to cut grass!


Tell Your Kids To Be a Data Scientist Instead of a Doctor/Lawyer/Banker!


My parents also told me to work hard and get good grades so that one day I become a successful doctor/engineer! But now times have changed and while the definition of true success may differ from one person to another. The title of a truly successful professional surely has seen a paradigm shift. Continue reading “Tell Your Kids To Be a Data Scientist Instead of a Doctor/Lawyer/Banker!”

Latest Open Source Tools in Data Analytics Beyond Apache Spark

Latest Open Source Tools in Data Analytics Beyond Apache Spark

In the IT world change is always in the air, but especially in the realm of data analytics, profound change is coming up as open source tools are making a huge impact. Well you may already be familiar with most of the stars in the open source space like Hadoop and Spark. But with the growing demand for new analytical tools which will help to round up the data holistically within the analytical ecosystem. A noteworthy point about these tools is the fact that they can be customized to process streaming data.

With the emergence of the IoT (Internet of things) that is giving rise to numerous devices and sensors which will add to this stream of data production, this forms one of the key trends why we need more advanced data analytics tools. The use of streaming data analysis is used for enhanced drug discovery, and institutes like SETI and NASA are also collaborating with each other to analyze terabytes of data, that are highly complex and stream deep in space radio signals.

2

The Apache Hadoop Spark software has made several headlines in the realm of data analytics that allowed billions of development funds to be showered at it by IBM along with other companies. But along with the big players several small open source projects are also on the rise. Here are the latest few that grabbed our attention:

Apache Drill:

This open source analytics tool has had quite good impact on the analytics realm, so much so that companies like MapR have even included it into their Hadoop distribution systems. This project is a top-level one at Apache and is being leveraged along with the star Apache Spark in many streaming data analytics scenarios.

Like at the New York Apache Drill meeting in January this year, the engineers at MapR system showed how Apache Spark and Drill could be used in tandem in a use cases that involve packet capture and almost real-time search and query.

But Drill is not ideal for streaming data application because it is a distributed schema free SQL engine. People like IT personnel and developers can use Drill to interactively explore data in Hadoop and NoSQL databases for things such as HBase and MongoDB. There is no need to explicitly describe the schemas or maintain them because the Drill has the ability to automatically leverage the structure which is embedded in the data. It is capable of streaming the data in memory between operators and minimizes the use of disks unless you need to complete a query.

Grappa:

Both big and small organizations are constantly working on new ways to cull actionable insights from their data streaming in constantly. Most of them are working with data that are generated in clusters and are relying on commodity hardware. This puts a premium label on affordable data centric work processes. This will do wonders to enhance the functionality and performance of tools such as MapReduce and even Spark. With the open source project Grappa that helps to scale the data intensive applications on commodity clusters and will provide a new type of abstraction which will trump the existing distributed shared memory (DSM) systems.

Grappa is available for free on the GitHub under a BSD license. And to use Grappa one can refer to its quick start guide that is available readily on the README file to build and execute it on a cluster.

These were the latest open source data analytics tools of 2017. For more such interesting news on Big Data analytics and information about analytics training institute follow our daily uploads from DexLab Analytics.


Interested in a career in Data Analyst?

To learn more about Data Analyst with Advanced excel course – Enrol Now.
To learn more about Data Analyst with R Course – Enrol Now.
To learn more about Big Data Course – Enrol Now.

To learn more about Machine Learning Using Python and Spark – Enrol Now.
To learn more about Data Analyst with SAS Course – Enrol Now.
To learn more about Data Analyst with Apache Spark Course – Enrol Now.
To learn more about Data Analyst with Market Risk Analytics and Modelling Course – Enrol Now.

Understanding Time Series Method of Forecasting

The dictionary meaning of the word forecasting is to estimate what could possibly be the future outcomes within a business or operation. But when it comes to the sector of data analysis this method is used for translating the past data or experiences into future possible outcomes. This is a highly useful analytics tool that helps any company management to cope with uncertainty of the future. For both short term and long term decisions forecasts are highly important.

 
Understanding Time Series Method of Forecasting
 

Forecasting can be used by businesses in several areas, which may include: economic forecasts, technological forecasts, and also demand forecasts. Forecasting techniques can be classified into 2 broad techniques: quantitative analysis (objective approach) and qualitative analysis (subjective approach). For the quantitative method of forecasting technique an analysis of historical data is conducted and the past patterns in data are assumed to predict future data points. While on the other hand in the qualitative forecasting technique, the judgment of experts is employed in the specific field to generate probable forecasts.  These are mostly educated guesses or opinions of experts in that specific area of expertise. Continue reading “Understanding Time Series Method of Forecasting”

The Best Analytics Tools for Business And How to Make The Most of Them

The Best Analytics Tools for Business And How to Make The Most of Them

All companies are awash with useable data about their customers, prospects and internal business operations as well as suppliers and partners. But most of them are also ill-equipped with the requisite understanding to leverage this streaming flood of data and cannot convert it to actionable insights to increase their revenue by growing their revenue thus, increasing their efficiency. Business intelligence tools are technology that allows businesses to transform their data into actions for generating better business.

The Business Intelligence and analytics industry has been around for decades now and is considered by most analytics personnel as a mature industry. But this BI market is never static with constant evolution and innovation to prepare for meeting the ever expanding needs of businesses of all sizes and from a diverse range of industries. So, it is imperative that people gather an understanding of the different Business Analytics tools for better operation of their companies.

2

Business Intelligence tools can be categorised in three different groups:

  • Guided analysis and reporting
  • Self-service Business Intelligence and Analysis
  • Advanced Analytics

The first category of guided analysis and reporting includes Business Intelligence tools of traditional styles that have long been used for years to perform recurrent data analyses of specified data groups. This system of data analysis was only used for predefined static reporting several years ago, but today it is possible for data analysts to select, compare, visualize and analyse data using various tools and features.

Tool styles in this category include the following:

  • Reports
  • Scorecards and dashboards
  • Spreadsheet integration
  • BI Search
  • Corporate Performance Management

The second category of BI tools which falls under the category of self-service BI and analysis includes the tools BI users utilize to make ad hoc analysis of data. Such analytical practices may be a one-time analysis or building of a recurring analytical system that may with shared by others.

Usually the users of such Bi tools have a dual role to play – consumer of information and producer of analytical systems. They usually share or publish their BI application which they build with the self-service BI tool. The users of such tools will always have the term analyst in their job title. Staff members of the management department may also make use of such tools when they need to perform similar tasks as that of a business analyst, for their peers even if their job title does not imply that.

The Business Intelligence tools include in this category includes the following:

  • Ad hoc analyses and reporting
  • OLAP cubes i.e. online analytical processing
  • Data visualization
  • Data discovery

The third category of advanced analytics includes the tools that a data scientist uses to build predictive and prescriptive models of analysis. These are tools for predictive modelling, statistical modelling and data mining along with rigorous use of big data analytics software. In these cases data analyst spend a huge chunk of their time performing tasks like data ingestion, cleansing and integration.

To understand the full spectrum of different Business Intelligence tool classes here is a visual explanation:

dexlab

Who should invest in BI tools?

For a long time now investment and use of BI tools has been growing gradually regardless of the economic conditions. And it has especially accelerated in the recent times as companies crave for data for better growth and more organized operations. While data analytics tools were mainly associated with large enterprises due to their cost, complexity and demand of high skilled personnel, but those factors have now been grossly transformed as more and more SMBs (small and medium sized businesses) now being significant customers of BI tools and software.

Now that you have a good understanding of the different tool categories and how they should be deployed, the next step for you is to understand your  company specific needs and make the best use of these tools that are optimized for so.


Interested in a career in Data Analyst?

To learn more about Data Analyst with Advanced excel course – Enrol Now.
To learn more about Data Analyst with R Course – Enrol Now.
To learn more about Big Data Course – Enrol Now.

To learn more about Machine Learning Using Python and Spark – Enrol Now.
To learn more about Data Analyst with SAS Course – Enrol Now.
To learn more about Data Analyst with Apache Spark Course – Enrol Now.
To learn more about Data Analyst with Market Risk Analytics and Modelling Course – Enrol Now.

A Few Key Business Analytics Tricks Every Manager Must Know

The main objective behind using any analytics tool is to analyze data and gather commercially relevant and actionable insights to accelerate results and performances of any organization. But currently there are a variety of tools available so, it often becomes difficult for managers to know which ones to use and when. You may be considering an online certificate in business analytics so reviewing and understanding these key tools may be of great value.


A few key business analytics tricks every manager must know


So, we thought you may want to know a few of the key analytics tools in use today and how they can be helpful for different business organizations.

Continue reading “A Few Key Business Analytics Tricks Every Manager Must Know”

Call us to know more