business analytics Archives - Page 5 of 8 - DexLab Analytics | Big Data Hadoop SAS R Analytics Predictive Modeling & Excel VBA

More Than Fifty Percent Companies Lack Required Tools and Investment for Efficient Business Analytics

More Than Fifty Percent Companies Lack Required Tools and Investment for Efficient Business Analytics

Fifty-nine percent of the companies around the world are not using Predictive Models or Advanced Analytics – says Forbes Insights/Dun & Bradstreet Study.

A recent study by Forbes Insights and Dun & Bradstreet, “Analytics Accelerates Into the Mainstream: 2017 Enterprise Analytics Study,” elucidates the ever-increasing indispensable role that analytics play in today’s business world, all the way from devising strategies to operations. The gloomy Forbes study highlights the crucial need for immediate investment, implementation and prioritization of analytics within companies.

5

The survey was carried on more than 300 senior executives in Britain, Ireland and North America and the report illuminates that the leading corporate giants need to invest more on the people, the processes they use and technologies that authorize decision support and decision automation.

Bruce Rogers, chief insights officer at Forbes Media was found quoting, “This study underlines the need for continued focus and investment,” he further added, “Without sophisticated analysis of quality data, companies risk falling behind.”

“All analytics are not created equal,” said Nipa Basu, chief analytics officer, Dun & Bradstreet.  She explained, “This report shows a critical opportunity for companies to both create a solid foundation of comprehensive business data – master data – and to utilize the right kind of advanced analytics. Those that haven’t yet begun to prioritize implementation of advanced analytics within their organizations will be playing catch-up for a long while, and may never fully recover.”


Key findings revealed:

Need for tools and best practices

Though data usage and consumption growth brags about success, little sophistication is observed in how data are analysed. Only 23% of the surveyed candidates are found to be using spreadsheets for all sorts of data work, while another 17% uses dashboards that are a little more efficient than spreadsheets.

The survey says mere 41% rely on predictive models and/or advanced analytical and forecasting techniques, and 19% of the respondents implement no analytical tools that are more complicated than fundamental data models and regressions.

Skill deficiency stalling analytics success

Twenty seven percent of respondents diagnosed with skill gaps as a major blocker between current data and analytics efforts. Fifty two percent were found to be working with third-party data vendors to tackle such lacks of skills. Moreover, 55% of the surveyed contestants said that third-party analytics partners performs better than those who works in-house, exhibiting both a shortage of analytics capabilities among in-house analysts and a dearth in skilled workers.

Investment crunch

Survey respondents ticked lack of investment and problems with technology as the top hindrances to fulfilling their data strategy goals. Despite the increasing use of data, investment in deft personnel and technology is lagging behind.

CFO’s introspect into data for careful insights

According to the survey, 63% of those who are in the financial domains shared they are using data and analytics to discover opportunities to fund business growth. Further, 60% of the survey respondents revealed they rely on data to boost long-term strategic planning.

For more interesting blogs and data-related stuffs, follow us on DexLab Analytics. We are a leading Data Science training institute in Delhi offering high-in demand Business analyst training courses in Gurgaon. Reach us today!


Interested in a career in Data Analyst?

To learn more about Data Analyst with Advanced excel course – Enrol Now.
To learn more about Data Analyst with R Course – Enrol Now.
To learn more about Big Data Course – Enrol Now.

To learn more about Machine Learning Using Python and Spark – Enrol Now.
To learn more about Data Analyst with SAS Course – Enrol Now.
To learn more about Data Analyst with Apache Spark Course – Enrol Now.
To learn more about Data Analyst with Market Risk Analytics and Modelling Course – Enrol Now.
Skills required during Interviews for a Data Scientist @ Facebook, Intel, Ebay. Square etc.

Skills required during Interviews for a Data Scientist @ Facebook, Intel, Ebay. Square etc.

Basic Programming Languages: You should know a statistical programming language, like R or Python (along with Numpy and Pandas Libraries), and a database querying language like SQL

Statistics: You should be able to explain phrases like null hypothesis, P-value, maximum likelihood estimators and confidence intervals. Statistics is important to crunch data and to pick out the most important figures out of a huge dataset. This is critical in the decision-making process and to design experiments.

Machine Learning: You should be able to explain K-nearest neighbors, random forests, and ensemble methods. These techniques typically are implemented in R or Python.  These algorithms show to employers that you have exposure to how data science can be used in more practical manners.

Data Wrangling: You should be able to clean up data. This basically means understanding that “California” and “CA” are the same thing – a negative number cannot exist in a dataset that describes population. It is all about identifying corrupt (or impure) data and and correcting/deleting them.

Data Visualization: Data scientist is useless on his or her own. They need to communicate their findings to Product Managers in order to make sure those data are manifesting into real applications. Thus, familiarity with data visualization tools like ggplot is very important (so you can SHOW data, not just talk about them)

Software Engineering: You should know algorithms and data structures, as they are often necessary in creating efficient algorithms for machine learning. Know the use cases and run time of these data structures: Queues, Arrays, Lists, Stacks, Trees, etc.

2

What they look for? @ Mu-Sigma, Fractal Analytics

    • Most of the analytics and data science companies, including third party analytics companies such as Mu-sigma and Fractal hire fresher’s in big numbers (some time in hundreds every year).
    • You see one of the main reasons why they are able to survive in this industry is the “Cost Arbitrage” benefit between the US and other developed countries vs India.
    • Generally speaking, they normally pay significantly lower for India talent in India compared to the same talent in the USA. Furthermore, hiring fresh talent from the campuses is one of the key strategies for them to maintain the low cost structure.
    • If they are visiting your campuses for interview process, you should apply. In case if they are not visiting your campus, drop your resume to them using their corporate email id that you can find on their websites.
    • Better will be to find someone in your network (such as seniors) who are working for these companies and ask them to refer you. This is normally the most effective approach after the campus placements.

Key Skills that look for are-

  • Love for numbers and quantitative stuff
  • Grit to keep on learning
  • Some programming experience (preferred)
  • Structured thinking approach
  • Passion for solving problems
  • Willingness to learn statistical concepts

Technical Skills

  • Math (e.g. linear algebra, calculus and probability)
  • Statistics (e.g. hypothesis testing and summary statistics)
  • Machine learning tools and techniques (e.g. k-nearest neighbors, random forests, ensemble methods, etc.)
  • Software engineering skills (e.g. distributed computing, algorithms and data structures)
  • Data mining
  • Data cleaning and munging
  • Data visualization (e.g. ggplot and d3.js) and reporting techniques
  • Unstructured data techniques
  • Python / R and/or SAS languages
  • SQL databases and database querying languages
  • Python (most common), C/C++ Java, Perl
  • Big data platforms like Hadoop, Hive & Pig

Business Skills

  • Analytic Problem-Solving: Approaching high-level challenges with a clear eye on what is important; employing the right approach/methods to make the maximum use of time and human resources.
  • Effective Communication: Detailing your techniques and discoveries to technical and non-technical audiences in a language they can understand.
  • Intellectual Curiosity: Exploring new territories and finding creative and unusual ways to solve problems.
  • Industry Knowledge: Understanding the way your chosen industryfunctions and how data are collected, analyzed and utilized.


Interested in a career in Data Analyst?

To learn more about Data Analyst with Advanced excel course – Enrol Now.
To learn more about Data Analyst with R Course – Enrol Now.
To learn more about Big Data Course – Enrol Now.

To learn more about Machine Learning Using Python and Spark – Enrol Now.
To learn more about Data Analyst with SAS Course – Enrol Now.
To learn more about Data Analyst with Apache Spark Course – Enrol Now.
To learn more about Data Analyst with Market Risk Analytics and Modelling Course – Enrol Now.
When Machines Do Everything – How to Survive?

In the coming years, jobs and businesses are going to be impacted; reason AI. Today’s generation is very much concerned about how the bots will consume everything; from jobs to skills, the smart machines will spare nothing! It is true that machines are going to replace man-powered jobs – by using robots, mundane jobs can be performed in a flick of an eye freeing people working in bigger organisations to innovate and succeed.


Machine Learning training course Pune

Continue reading “When Machines Do Everything – How to Survive?”

Go Harder, Longer, Faster, And Stronger With Impressive Corporate Training Programs

Let’s acknowledge, we are living in a digital world. Whether you attend a business dinner, work in the oil fields or inspect warehouse records, the claws of digital technology grips you daily. Today’s digital world revolves around communications, and Avaya is a pioneer in delivering brilliant communications experiences.

 
Go Harder, Longer, Faster, And Stronger With Impressive Corporate Training Programs
 

The expert consultants at DexLab Analytics – a top-notch big data training institute in India is conducting a three-month long training program for selected officials of Avaya at the company’s Pune branch. The consummate team of Business Intelligence, Data Warehousing and Analytics representatives from Avaya will stay in Pune, till the session is completed.


Headquartered in Delhi, DexLab Analytics feels extremely honoured in heading such an inspiring event with an acute vision of imparting knowledge and skills to individuals. The diligent team of consultants is going to share deeper insights on subjects, like R Programming, Data Science using R, Statistical Modeling using R, Advance Microsoft Excel – VBA, Macros, Dashboards and Tableau BI & Visualization. The sole purpose of this training is to equip the team of Avaya with modern state-of-the-art data technology so as to give them a certain edge over their rival tailing companies.  


In this age of digitisation, and when Modijee is in his endeavour to make India Digital India, how can we ignore the reverberating importance of analytical skills! One of the prime advantages of great analytical skills is that you can take crucial decisions to fulfil your organization’s aims and objectives. The vast amount of real time data is at your disposal, and with them, you can easily achieve success and growth in the future.  Therefore, it is evident that the need for analytical skills is going to swell in the coming years, and DexLab Analytics is a reputable business-analytics training institute, which strongly believes in the growing significance of digitisation using data science and analytics.


In the context of the above discussion, the spokesperson from DexLab Analytics has this to say –


“DexLab Analytics with its team of seasoned corporate trainers offering valuable insights about the high-in-demand skills, like Big Data Hadoop, Business Analytics, R Programming, Machine Learning, SAS Programming, Data Science, Visualization using Tableau and Excel are seeking ways to fabricate a path towards corporate training excellence in the wide-encompassing field of Big Data and Data Analytics. Our intensive training module will help officials confer an exhaustive analysis of a newer domain of data science, which will make them more data-efficient and data-friendly.”


Recently, the expertise in big data has been recognised as a major component for achieving success in the advanced digital world and the concerned representatives are acknowledging this impressive view. So, let’s hope this take on data analytics motivates more people, paving new roads for data-centric ideas and modules in the near future.


Are you looking for intensive SAS courses in Pune? Visit DexLab Analytics and scan through a list of encompassing SAS training courses in Pune.


Interested in a career in Data Analyst?

To learn more about Machine Learning Using Python and Spark – click here.
To learn more about Data Analyst with Advanced excel course – click here.
To learn more about Data Analyst with SAS Course – click here.
To learn more about Data Analyst with R Course – click here.
To learn more about Big Data Course – click here.

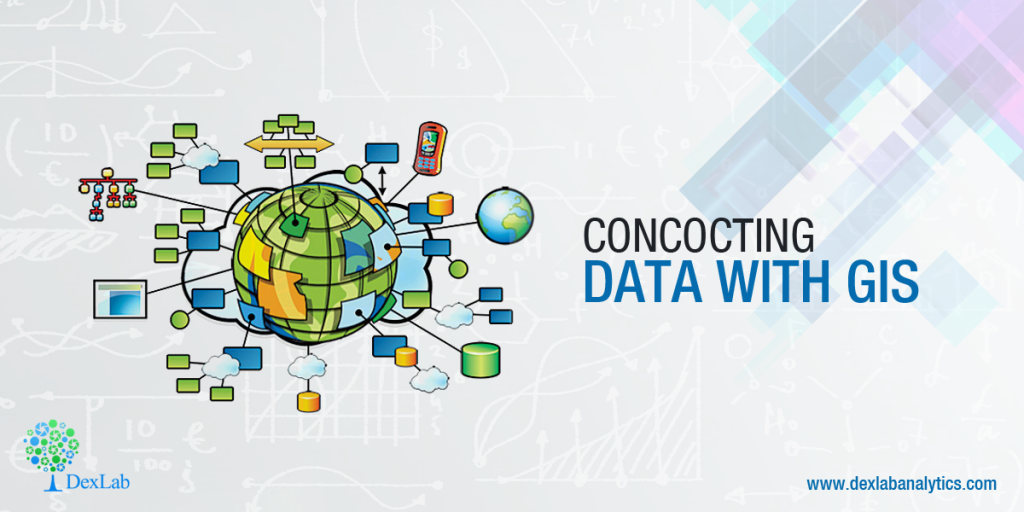
Concocting Data with GIS

Concocting Data with GIS

In supreme and sophisticated geospatial realm, data have been predominant. Or, should I say it is the matured fosterling of Geographic Information Systems (GIS). Choose, whatever suits you; subject to whom you work for or what you need to work on. The meat and potatoes? To excel on location analytics, concentrate only on the best most current data.

big-data-visualization-e1456688631506-1024x671

In today’s world, data is valuable. It is vital and veritable. It is indispensable in Geographic Information Systems (GIS).

To second that, today’s tech-efficient society is anchored on location-based data, than ever, especially with the rise in Twitter, Google, Facebook and other social media apps, which collects and stores data from their highly-valued users to sell them off to money-grubbing advertisers.  Though secretly. On the other hand, cell phones go a step ahead in broadcasting your current location data 24/7. Otherwise, how would your friends know that you are safe when a severe earthquake rattled your neighbouring city! (Thanks to location settings)

Feisty Predicaments

sap_ipad_google_maps

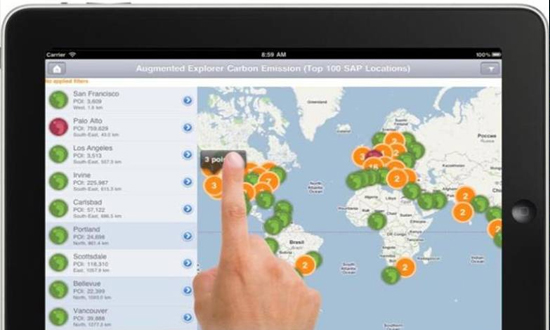
However, the real challenge lies in data identification and consumption. Countless number of users gets baffled when it comes to finding data, and if found, how to consume it to set off their business determinations. To solve this, many imminent think tanks of tech industry came out with direct and decisive solutions. Some of them were loaded with an abundance of data, i.e. digestible and disintegrated. By disintegration, they meant that the data was categorized into: points of interest, roads, boundaries and demographics, for easy comprehensibility. Furthermore, industry data bundles concerning telecommunications, retail and insurance fields were added to make the coverage global and profitable. To top it off, quality content and sprawling file formats boosted the results and mechanisms, both.

Conflux of GIS and BI

Location technology – Does this ring a bell? Yes? Then you would be familiar with GIS but others, particularly new Business Intelligence users and consumers must have just started taking baby steps on basic mapping. For BI, maps are the backdrop against which business analysts project their business data, stats and analytical information. Analysing the data to understand the insights of consumers is crucial, directly affecting the business decisions and revenues thereby. For example, heat maps, used to see the concentration of installations, customers and IoT devices provides an unparalleled accurateness of spatial relationships, which is impossible to obtain from the spreadsheets.


Seeking data analytics certification courses to boost your business growth? Go through our comprehensive Online Courses in data science at DexLab Analytics.

One of the integral location analytics issues is to help in identifying the high-risk zones at the time of natural disasters, like tornadoes, earthquakes, floods, hurricanes or mudslides. For example, in the US, the East Coast is vulnerable to a lot of hurricanes and floods, whereas earthquakes and mudslides snap the West Coast time to time. Assessment of these location problems is intrinsically important for mortgage underwriters, insurance agents and public safety departments. And best data along with effective geo-coding is the solution to all the inconveniences. 

Discover easy Data Science Courses Online by logging in to DexLab Analytics. To know more on Business Analytics Online Certification, contact us.


Interested in a career in Data Analyst?

To learn more about Machine Learning Using Python and Spark – click here.
To learn more about Data Analyst with Advanced excel course – click here.
To learn more about Data Analyst with SAS Course – click here.
To learn more about Data Analyst with R Course – click here.
To learn more about Big Data Course – click here.

Take Small Steps With Big Feet of Business Analytics

Take Small Steps With Big Feet of Business Analytics

Do these following questions clog your mind?

I aspire to become a business analytics professional, but I don’t know what skills to possess?

I am sceptical; which training should I opt for in order to establish my career in the sphere of business analytics?

I am looking forward to switch my career into data analytics, but I don’t know which skills to imbibe for better prospects?

Answer: Yes, they do.

Continue reading “Take Small Steps With Big Feet of Business Analytics”

Understanding The Core Components of Data Management

Understanding The Core Components of Data Management

Ever wondered why many organizations often find it hard to implement Big Data? The reason often is poor or non-existent data management strategies which works counterproductive.

Data cannot be delivered or analysed without proper technology systems and procedural flows data can never be analysed or delivered. And without an expert team to manage and maintain the setup, errors, and backlogs will be frequent.

Before we make a plan of the data management strategies we must consider what systems and technologies one may need to add and what improvements can be made to an existing processes; and what do these roles bring about in terms of effects with changes.

However, a much as is possible any type of changes should be done by making sure a strategy is going to be integrated with the existing business process.

And it is also important to take a holistic point of view, for data management. After all, a strategy that does not work for its users will never function effectively for any organization.

With all these things in mind, in this article we will examine each of the three most important non-data components for a successful data management strategy – this should include the process, the technology and the people.

2

Recognizing the right data systems:

There is a lot of technology implemented into the Big Data industry, and a lot of it is in the form of a highly specific tool system. Almost all of the enterprises do need the following types of tech:

Data mining:

This will isolate specific information from a large data sets and transform it into usable metrics. Some o the familiar data mining tools are SAS, R and KXEN.

Automated ETL:

The process of ETL is used to extract, transform, and also will load data so that it can be used. ETL tools also automate this process so that human users will not have to request data manually. Moreover, the automated process is way more consistent.

Enterprise data warehouse:

A centralised data warehouse will be able to store all of an organization’s data and also integrate a related data from other sources, this is an indispensible part of any data management plan. It also keeps data accessible, and associates a lot of kinds of customer data for a complete view.

Enterprise monitoring:

These are tools, which provide a layer of security and quality assurance by monitoring some critical environments, with problem diagnosing, whenever they arise, and also to quickly notify the team behind analytics.

Business intelligence and reporting, Analytics:

These are tools that turn processed data into insights, that are tailored to extract roles along with users. Data must go to the right people and in the right format for it to be useful.

Analytics:

And in analytics highly specific metrics are combined like customer acquisition data, product life cycle, and tracking details, with intuitive user friendly interfaces. They often integrate with some non-analytics tools to ensure the best possible user experience.

So, it is important to not think of the above technologies as simply isolated elements but instead consider them as a part of a team. Which must work together as an organized unit.

For business analyst training courses in Gurgaon and other developmental updates about the Big data industry, follow our regular uploads from DexLab Analytics.


Interested in a career in Data Analyst?

To learn more about Data Analyst with Advanced excel course – Enrol Now.
To learn more about Data Analyst with R Course – Enrol Now.
To learn more about Big Data Course – Enrol Now.

To learn more about Machine Learning Using Python and Spark – Enrol Now.
To learn more about Data Analyst with SAS Course – Enrol Now.
To learn more about Data Analyst with Apache Spark Course – Enrol Now.
To learn more about Data Analyst with Market Risk Analytics and Modelling Course – Enrol Now.

Power BI is The New Revolutionary Tool For Business! This is Why

Power BI is The New Revolutionary Tool For Business! This is Why

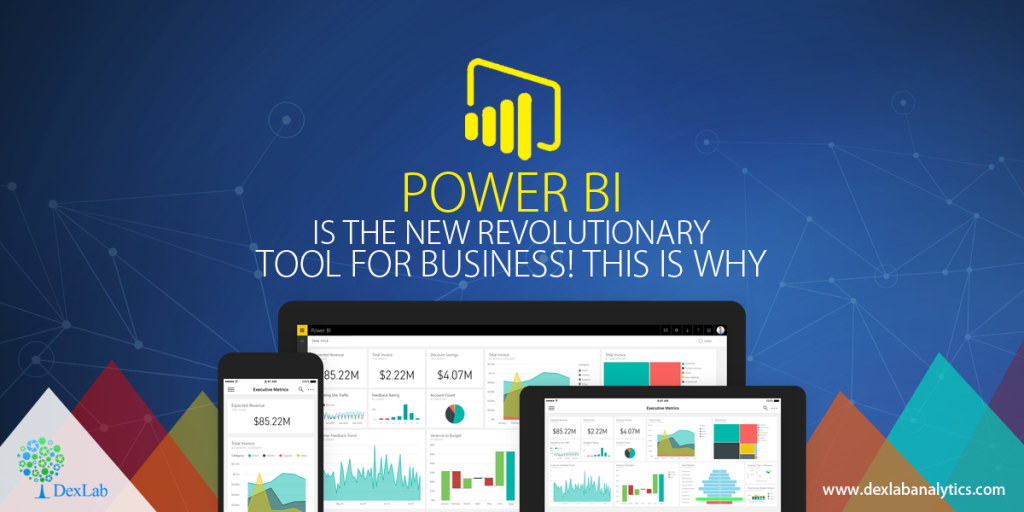
Microsoft launched its Power BI tool quite some time ago now, and the way things seem to advance is pretty amazing to say the least. This is a great Business Intelligence and analytics tool and it seems it is only a matter of time before the Power BI becomes the tool of choice for Business Intelligence and analytical works in almost all of the foresighted corporations.

This is a powerful BI tool now available in the hands of enterprises, who are looking to extract data from multiple disparate sources in order to derive meaningful insights from it. The tool offers unprecedented interactive visualization opportunities along with true self-servicing analytical capacities.

With all of these it helps the whole look of the same data to appear from varying angles and also allows the reports and dashboards to be made by anybody within the organization without assistance from IT administrators and developers.

The international analytics and BI market is to reach the mark of  USD 16.9 Billion in 2016 says Gartner!

Are you keen on acquiring a Big Data certification then check out DexLab Analytic’s Machine Learning courses in Delhi now!

Power BI is leading the way in cloud business analytics and intelligence. It offers the services, which can directly be harnessed from the cloud, and it is a huge advantage when it comes to how BI can be utilized. The desktop version of power BI is also available and is known as the Power BI desktop.

The entire range of ordinary tasks can be performed with this Power BI like – data discovery, data preparation, designing of the interactive dashboards. Microsoft also went a step ahead by putting up the embedded version of Power BI in its highly revered Azure cloud platform.

The company already has a pretty good presence in the analytics environment with its popular products like SSAS – SQL Server Analysis Service. However, it did not have any strong presence in the BI delivery system and OLAP segment i.e. Online Analytical Processing.

Excel for a long time has been Microsoft’s attempt at being a presentation layer for its data analysis tools. However, Excel has a lot of disadvantages like limited memory, integrity issues with data which are the main reasons why it is often not very appealing to the corporate clients who want something more malleable for business analytics.

You can give your career a powerful boost with Big Data training from the leading Big Data training institute in Delhi NCR.

Data Science Machine Learning Certification

However, a really powerful BI tool is what takes Excel to a great new level; it helps to offer a whole new experience to working with tools like Power Query for data extraction and its transformation. The Power Pivot tool which, is deployed for data analysis and modelling and lastly, the Power View which, is used to map the data and visualize it distinctly in unprecedented ways. With Power Bi one can put all of these tools into a consolidated manner and will make it easier to work without having to depend on to MS Office solely.

In closing thoughts, thus, it is safe to say that Power Bi is putting the right use of power in the right hands of the customers. so, a power BI training can be a good decision for one’s career at this point, for those who consider themselves as a forward-thinking IT professional.  


.

Tax department leans on Big Data analytics to mark out multiple PAN holders

To plug tax loopholes, the income tax (IT) department will use Big Data analytics to track tax evaders by collecting financial information about them, such as – common address, mobile number and e-mail to establish relationships between their multiple PANs. The department with support from various private firms will analyse the voluminous big data available post-demonetisation for checking transactional relationships between PAN holders.

 Tax department leans on Big Data analytics to mark out multiple PAN holders

  • The Managed Service Provider (MSP), which the IT department plans to hire, will design and operate analytical solutions that will in turn help in collating data, matching it and identifying relationships as well as clustering of the PAN and non-PAN data, an official said.
  • The analytical solutions would help the department gather data from banks, post offices and other sources for linking of information and identification of duplicate details. It will also identify records with errors or other defects for resubmission.

Continue reading “Tax department leans on Big Data analytics to mark out multiple PAN holders”

Call us to know more