Big Data Archives - Page 16 of 17 - DexLab Analytics | Big Data Hadoop SAS R Analytics Predictive Modeling & Excel VBA

The Pros and Cons of HIVE Partitioning

The Pros and Cons of HIVE Partitioning Hive organizes data using Partitions. By use of Partition, data of a table is organized into related parts based on values of partitioned columns such as Country, Department. It becomes easier to query certain portions of data using partition.

Partitions are defined using command PARTITIONED BY at the time of the table creation.

We can create partitions on more than one column of the table. For Example, We can create partitions on Country and State.

2

Syntax:

CREATE [EXTERNAL] TABLE table_name (col_name_1 data_type_1, ….)

PARTITIONED BY (col_name_n data_type_n , …);

Following are features of Partitioning:

  • It’s used for distributing execution load horizontally.
  • Query response is faster as query is processed on a small dataset instead of entire dataset.
  • If we selected records for US, records would be fetched from directory ‘Country=US’ from all directories.

Limitations:

  • Having large number of partitions create number of files/ directories in HDFS, which creates overhead for NameNode as it maintains metadata.
  • It may optimize certain queries based on where clause, but may cause slow response for queries based on grouping clause.

It can be used for log analysis, we can segregate the records based on timestamp or date value to see the results day wise / month wise.

Another use case can be, Sales records by Product –type , Country and month.


Interested in a career in Data Analyst?

To learn more about Data Analyst with Advanced excel course – Enrol Now.
To learn more about Data Analyst with R Course – Enrol Now.
To learn more about Big Data Course – Enrol Now.

To learn more about Machine Learning Using Python and Spark – Enrol Now.
To learn more about Data Analyst with SAS Course – Enrol Now.
To learn more about Data Analyst with Apache Spark Course – Enrol Now.
To learn more about Data Analyst with Market Risk Analytics and Modelling Course – Enrol Now.

The Professional Career Graph of a Data Scientist

It is indeed not a hard task to get hold of surveys of salaries of data scientists at senior and junior levels alike according to the place of work as well as the skill set possessed by the individual there are few readily available analysis of how the salary of a data scientist progressed over the course of careers than spanned over 25 years. This post seeks to fill in that gap by examining the career of Vincent Granville, a data scientist considered with high esteem in the Big Data industry.
The Professional Career Graph of a Data Scientist

Continue reading “The Professional Career Graph of a Data Scientist”

HIVE – User Defined Functions

Though, Hive has a list of built in functions, in some scenarios we need user defined functions to be written in Java for some specific use cases.
HIVE User Defined Functions.

We can use two interfaces which can be used to write UDFs for apache Hive.

  • The simple API (apache.hadoop.hive.ql.exec.UDF) can be used as long as our function reads and returns primitive types. Means, basic Hadoop & Hive writable types – Text, LongWritable, IntWritable and DoubleWritable etc.
  • If you plan to write a UDF that deals with embedded data structures, such asList, Mapand Set, then you need to useapache.hadoop.hive.ql.udf.generic.GenericUDF, which is a little more involved.
  • Simple API – apache.hadoop.hive.ql.exec.UDF
  • Complex API – apache.hadoop.hive.ql.udf.generic.GenericUDF

Steps to create Hive-UDF

Step 1:-

Open your Eclipse then create a java Class Name

Step 2:-

Add Jar files to project folder

Step 3 :-

Extend UDF Abstract Class

public class classname extends UDF and you return the value.

Step 4 :-

Implement evaluate() method . This method is called once for every row of data being processed

Step 5:-

Compile and create jar file.

Step 6:-

Add jar file to hive class path.

In hive terminal – add jar <jar file path>

Step 7 :-

Create temporary function in Hive Terminal.

CREATE temporary function Convert as ‘udf.Convert′;

udf represents the package name and Convert represents the program name .

For example:

packageudf

importorg.apache.hadoop.hive.ql.exec.UDF;

importorg.apache.hadoop.io.Text;

publicclassConvertextends UDF{

private Text result =new Text();

public Text evaluate(String str){

int number;

number=Integer.parseInt(str);

float fno=(float) number;

String res=Float.toString(fno);

result.set(res);

return result;

}

}

Here, We have extended UDF abstract class.

This code converts Int to Float.

Assuming a hive table Demo contains column ID with following data:

1

2

3

5

Select Convert(ID) from Demo gives following output :

1.0

2.0

3.0

5.0

Big Data and the Cloud- An Eclectic Mix

Big Data and the Cloud- An Eclectic Mix
The FINRA or The Financial Industry Regulatory Authority, Inc. makes analysis of up to no less than 75 billion events each and every day. It is little wonder then that it finds its data center nearly filled to capacity. FINRA is looking forward to migrating to the cloud in order to continue to provide the protection for investors and continually respond to the market that it is famed for.

According to Matt Cardillo who is the Senior Director at FINRA, they are eyeing the elasticity that is enabled by cloud storage. He further continued also on their radar was an approach change in order to respond to market and volume data change along with changes in the behavior of users. Volatile markets result in usage spikes and also attract a whole lot more of users in their system.

2

The surveillance program undertaken by FINRA performs analysis of data for suspicious activities as well as potential fraud. Their algorithms go through and analyze the data for any abnormalities or activities that might not be normal. They have in place alerts and exceptions that take stock of situations and then have access to analytics that help to determine if there is indeed a problem or whether it is a false call.

Stay Ahead of the Big Data Curve

Almost every day a new tool emerges to take stock of Analytics in the brave new world of Big Data Tech. According to Cardillo the kudos for staying ahead of the big data curve goes to the skilled staff at FINRA. He says that his people are innovative and are only too keen to embrace the latest advancements in technology. He confesses that after reverting to the cloud some of their present tech as well as tools will become irrelevant. But they are banking big on open source especially frameworks like Hive, Hadoop and Spark to get most out of the elasticity needed by their business.


Interested in a career in Data Analyst?

To learn more about Data Analyst with Advanced excel course – Enrol Now.
To learn more about Data Analyst with R Course – Enrol Now.
To learn more about Big Data Course – Enrol Now.

To learn more about Machine Learning Using Python and Spark – Enrol Now.
To learn more about Data Analyst with SAS Course – Enrol Now.
To learn more about Data Analyst with Apache Spark Course – Enrol Now.
To learn more about Data Analyst with Market Risk Analytics and Modelling Course – Enrol Now.

The Rise of the AI in Big Data

The Rise of the AI in Big Data

The researchers working at the MIT “Computer Science and Artificial Intelligence Laboratory” or abbreviated simply as CSAIL are all set to make human intuition out of the analysis of big data equation by enabling computers to choose from the set of features that are put into use in order to identify patterns in the data that may be considered to be predictive. This is dubbed as the “Data Science Machine” and as things have progressed so far the software prototype has managed to beat 615 of 908 competing teams vying for the same ability across no less than three competitions of data science.

2

Big Data may be considered as a complex and huge ecosystem that combines innovative processes from fields as diverse as storage, data analysis, curation, networking as well as search in addition to other functions and processes. As things stand much of analysis of big data is already algorithmic and automated but at the end of the day it is business users and data scientists who are needed in order to determine the particular dataset and analysis features which are required for visualization in the end and take action on the communicated data.

To put it simply at the end of the whole process humans are needed in order to make choices about data point combinations to chart out the relevant information.

The Data Science Machine is intended to naturally complement human intelligence and to make the most of the Big Data that is available for us waiting to be used.

The analysis of Big Data and Engineering of Features

As mentioned earlier actionable information lies at the hands of the big data scientist who is writing the code for analysis. It is this code that guides the analysis of the big data engine. In essence the advancement made by the MIT researchers is that not only does it serve to provide answers to questions regarding the data but also suggests additional questions accordingly.

This may be put into varied uses like to estimate the capacity of wind farms to generate power or making predictions about students who are likely to drop out of online courses.

5 Hottest Online Applications Inspired by Artificial Intelligence – @Dexlabanalytics.

The ultimate destination for all your data-related queries and assistance is DexLab Analytics. Being a premier Data Science training institute Gurgaon, DexLab Analytics takes pride in offering excellent data analytics courses for aspiring candidates.


Interested in a career in Data Analyst?

To learn more about Data Analyst with Advanced excel course – Enrol Now.
To learn more about Data Analyst with R Course – Enrol Now.
To learn more about Big Data Course – Enrol Now.

To learn more about Machine Learning Using Python and Spark – Enrol Now.
To learn more about Data Analyst with SAS Course – Enrol Now.
To learn more about Data Analyst with Apache Spark Course – Enrol Now.
To learn more about Data Analyst with Market Risk Analytics and Modelling Course – Enrol Now.

The Possibilities of Big Data

It is no secret that Big Data has some wonderful applications that may change the way we interact with businesses, and even more how they interacts with us through other facets of this rapidly growing field. But, what can it do concretely? This blog post shares insights of this question.
 
The Possibilities of Big Data

Endless Possibilities of Big Data

 It can tell you what may most probably happen

Continue reading “The Possibilities of Big Data”

Top 10 Best Hadoop EBooks That You Should Start Reading Now

Top 10 Best Hadoop EBooks That You Should Start Reading Now

Based on Java, Hadoop is a free open source framework for programming where dealings with huge amounts of processed data in a computing environment is said to be distributed. None other than the Apache Software Foundation is sponsoring it. If you are looking for information about Hadoop, you will like to get in-depth information about the framework and its associated functions. To get you up to the mark with the concepts, the eBooks listed below will prove to be of invaluable help.

2

MapReduce

If you are looking forward to get started with Hadoop, and maximize your knowledge about Hadoop clusters, this book is of right fit. The book is loaded with information on how t o effectively use the framework to scale apps of the tools provided by Hadoop. This ebook lets you get acquainted with the intricacies of Hadoop with instructions provided on a step-by-step basis and guides you from being a Hadoop newbie to efficiently run and tackle complex Hadoop apps across a large number of machine clusters.

Also read: Big Data Analytics and its Impact on Manufacturing Sector

Programming Pig

Prog_pig_comp.indd

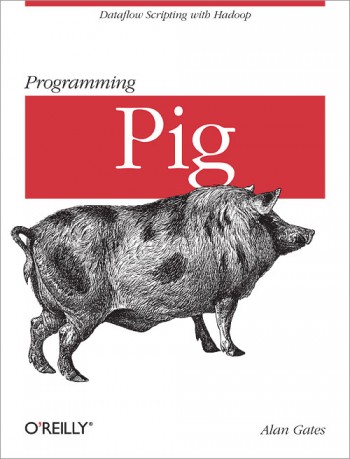
If you are looking for a reference from which you may learn more about Apache Pig, which happens to be the engine powering executions of parallel flows of data on the Hadoop framework which also is open source, the Programming Pig is meant for you. Not only does it serve the interests of new users but also provides advanced users coverage on the most important functions like the “Pig Latin” scripting language, the “Grunt” shell and the functions defined by users for extending Pig even further. After reading this book, analyzing terabytes of data is a far less tedious task.

Also read: What Sets Apart Data Science from Big Data and Data Analytics

Professional Hadoop Solutions

51gb9XbHEmL._SX396_BO1,204,203,200_

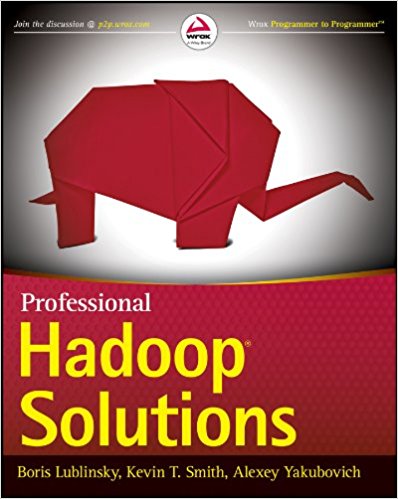
This book covers a gamut of topics such as that how to store data with Hbase and HDFS, processing the data with the help of MapReduce and data processing automation with Oozie. Not limiting to that the book further covers the security features of Hadoop, how it goes along with Amazon Web Services, the best related practices and how to automate in real time the Hadoop processes. It provides code examples in XML and Java and refers to them in-depth along with what has been added to the Hadoop ecosystem of late. The eBook positions itself as comprehensive resource with API coverage and exposition of the deeper intricacies, which allow developers and architects to better customize and leverage them.

Also read: How To Stop Big Data Projects From Failing?

Apache Sqoop cookbook

9781449364625

This guide allows the user to use Sqoop from Apache with emphasis on application of parameters that are enabled by the Command Line Interface when dealing with cases that are used commonly. The authors offer Oracle, MySQL as well as PostgreSQL examples of databases on GitHub that lend themselves to be easily adapted for Netezza, SQL Server, Teradata etc relational systems.

Also read: Why Getting a Big Data Certification Will Benefit Your Small Business

Hadoop MapReduce Cookbook

51CBDiRJBPL._SX342_QL70_

The preface of the book claims that the book enables readers to know how to process complex and large datasets. The book starts simple but still gives detailed knowledge about Hadoop. Further, the book claims to be a simple guide on getting things done in one place. It consists of 90 recipes that are offered simply and in a straightforward manner, coupled with systematic instructions and examples from the real world.

Also read: How to Code Colour Values Within SAS Enterprise Guide

Hadoop: The Definitive Guide, 2nd Ed

9200000035483086

If you want to know how to maintain and build distributed systems that are both scalable and reliable within the framework of Hadoop then this book is for you. It is intended for – programmers who want to analyze datasets, irrespective of size; and – administrators, who seek to know the setting up and running of Hadoop Clusters, alike. New features like Sqoop, Hive as well as Avro are dealt with in the new second edition. Case studies are also included that may help you out with specific problems.

Also read: How to Use PUT and %PUT Statements in SAS: 6 Tips

MapReduce Design Pattern

19057545

If one is to go by the book’s preface, the book is a blend of familiarity and uniqueness. The book is dedicated to design patterns by which we refer to the general guides or templates for solving problems. It is however more open-ended in nature than a “cookbook” as problems are not specified. You have to delve more in the subject matter than mere copying and pasting, but a pattern will get you covered about 90% of the whole way regardless of the challenge at hand.

Also read: SAS Still Dominates the Market After Decades of its Inception

Hadoop Operations

lrg (1)

This book is necessary for those who seek to maintain complex and large clusters of Hadoop. Map Reduce, HDFS, Hadoop Cluster Planning. Hadoop Installation as well as Configuration, Authorization and authentication, Identity, Maintenance of clusters and management of resources are all dealt in it.

Also read: Things to judge in SAS training centres

Programming Hive

programming-hive-repost-5332.jpeg

Knowledge on programming in Hive provides an SQL dialect in order to query data, which is stored in HDFS, which makes it an indispensable tool at the hands of Hadoop experts. It also works to integrate with other file systems, which may be associated with Hadoop. Examples of such file systems may be MapR-FS and the S3 from Amazon as well as Cassandra and HBase.

Hadoop Real World Solutions CookBook

Hadoop-Real-World-Solutions-Cookbook

The preface of this eBook illustrates its use. It lets developers get acquainted and become proficient at problem solving in the Hadoop space. The reader will also get acquainted with varied tools related to Hadoop and the best practices to be followed while implementing them. The tools included in this cookbook are inclusive of Pig, Hive, MapReduce, Giraph, Mahout, Accumulo, HDFS, Ganglia and Redis. This book intends to teach readers what they need to know to apply Hadoop knowledge to solve their own set of problems.


So, happy reading!


Enjoy 10% Discount, As DexLab Analytics Launches #BigDataIngestion

DexLab Analytics Presents #BigDataIngestion


Besides, feeding knowledge through eBooks, it is vital to be enrolled for an excellent Big data hadoop certification in Gurgaon. DexLab Analytics is here for you; it offers a gamut of high-end big data hadoop training in Delhi, courses that will surely hone your data skills.


Interested in a career in Data Analyst?

To learn more about Data Analyst with Advanced excel course – Enrol Now.
To learn more about Data Analyst with R Course – Enrol Now.
To learn more about Big Data Course – Enrol Now.

To learn more about Machine Learning Using Python and Spark – Enrol Now.
To learn more about Data Analyst with SAS Course – Enrol Now.
To learn more about Data Analyst with Apache Spark Course – Enrol Now.
To learn more about Data Analyst with Market Risk Analytics and Modelling Course – Enrol Now.

Oil Price Crash – What Big Data Has To Do With It

It was presumed that the oil price collapse would result in giving the U.S. economy a boost and encourage consumer spending. But from the economic data it appeared that they are more interested in saving the money instead. But the Big Data from JP Morgan Chase Institute suggests otherwise. It seems to provide considerable evidence that consumers did spend most of what they saved. The result is arouses curiosity and demonstrates how the changes in the availability of data and computing power can affect the kind of energy research that is possible.

Education Key to Removing Inequality

The Questions That Arose

Till the recent past conventional wisdom stated that consumers refrained from spending what they saved from the collapse of oil prices. This was initially reflected by the numbers of their savings with fall in oil prices being accompanied by the rates of personal savings suggesting that customers were depositing the savings in bank accounts. Consumer survey data further confirmed the speculation. But most were still guessing at the reason. Was it due to the cold winter or was it a reaction to the financial crisis. But the question that mattered the most was whether consumers would eventually get to spending the excess money.

The New Answer

However as of now the conclusion reached by the JPMC research team is that 80% of the amount saved was were spent by consumers. They put into use records of transactions from over 25 million credit cards. This database alone provides them with a comprehensive window into the patterns of consumption. That along with some pretty smart analyses that enabled them to distinguish increase in spending lower prices of oil from the normal ones enabled them to complete this analysis. This would not even have been possible in absence of detailed records and the sheer computing power.

The Consequences

Though apparently, that is harbinger of good news, the economy is being stimulated due to a decrease in the prices of gasoline that makes other data harder to comprehend. If the consumers were adding up their savings it might be presumed that possibly they would get around to spending it as well. But according to JPMC that is not the case. It also raises questions on how reliable the consumer survey data really is. The increase in savings rate is also a puzzle facing researchers.

Big Data

The research may also be seen as an example of what may be made possible through the use of Big Data especially when it concerns research in Energy. The future portends well for gaining much more insight in to the general field of business and consumer decisions and much, much more. So it is necessary to stay up to date with the developments in this brave new world of Big Data.

Munich Re Bets its Big Data on SAS

Munich Re which one of the leading reinsurers in the world, has opted to deploy SAS in order to achieve the goal of its Big Data strategy. Business units and specialist departments across verticals are all set to use the SAS platform in order to carry out critical functions like forecasts, analyses, pattern recognition and simulations.

Quotes

The SAS software suite automates the whole process of acquisition as well as analysis of content derived from complex contracts as well as claim notifications. Having access to a large pool of data the company is better placed to innovate by making use of Big Data analytics. This will let it offer new and customized offers or proposals, Put in place for access throughout the world, the Analytics platform from SAS comes into play by accessing a considerable number of internal and external sources of data. Its flagship in-memory tech makes it possible to analyze huge data quantities of data interactively so as to be able to find new correlations that would otherwise be impossible to recognize in the absence of highly advanced tools for analytics. The in-database processing model allows development and management of data models to be directly run from the database itself. This in simple terms translates to that the analyses are our in the platform SAP HANA or its open-source counterpart, the Hadoop framework. These tools enable analysis of unstructured text data in massive quantities.

The factors which turned the decision for Munich Re in favor of SAS were the speed at which the analyses were carried out, the upward graph in the tech graph, the performance of the team for SAS overall and the ability of the system to deliver and deploy results swiftly.

The CEO for Munich Re Torsten Jeworrek attributed the success of their analysis of data to it and added that it contributed significantly to the value gotten by their customers. He also forecasted that with the adaptation of these new technologies the ability of Munich Re to combine the customer data and compare it with the expert knowledge and findings of the company.

Call us to know more