Big Data Archives - Page 13 of 17 - DexLab Analytics | Big Data Hadoop SAS R Analytics Predictive Modeling & Excel VBA

The Worst Techniques To Build A Predictive Model

While some of these techniques may be a little out of date and most of them have evolved over time greatly, for the past 10 years rendering most of these tools completely different and much more efficient to use. But here are few bad techniques in predictive modelling that are still widely in use in the industry:


Predictive Model


1. Using traditional decision trees: usually too large decision trees are usually really complex to handle and almost impossible to analyze for even the most knowledgeable data scientist. They are also prone to over-fitting which is why they are best avoided. Instead we recommend that you combine multiple small decision trees into one than using a single large decision tree to avoid unnecessary complexity.

Continue reading “The Worst Techniques To Build A Predictive Model”

What we mean by the phrase “being data driven”?

It is only understandable that most corporations these days are submerged with data that forms the invaluable asset for them, which can lead them to insights worth the big bucks. It may be a good idea to think about the name Big Data which has been named so for being big in volume, but can also be correlated to Big Money when used wisely. But do all data open gates to gaining insights? Not entirely true, as data usually opens gates for obtaining more data and thus, creating opportunities to gain more insights. The main point of differentiation with data driven organizations is to put data at their focal point and use the insights derived from them to amplify their business gains with effective strategies and business decisions. Data in these companies are actually treated as valuable assets for the company, and they know how to use and protect them well. Intelligence obtained from data is embedded into their core business processes.


What we mean by the phrase “being data driven”?


What differentiates the data driven companies are that they are able to achieve a sustainable competitive advantage and can deliver greater customer satisfaction to their clients. The main pillars of work is a cohesive business model with a data aware culture that inspires its customer base as well employees to look through newer perspectives, challenge the status quo of their business environment, take greater risks and optimize their usage of data.

Continue reading “What we mean by the phrase “being data driven”?”

The Limitation of R Programming

R Programming is sort of the darling of the academia and researchers as well due to the cutting edge tools of data science and analytics that it offers. Not only does its open source nature ensure that contributors to the project are able to come out with packages that facilitates in making R Programming be able to sport the latest advances in its field but also make it a option that may be implemented with burning a hole in ones pockets.


The Limitation of R Programming

The Disadvantages of R

In spite of all its flexibility, R is found want in a number of specific situations. R cannot scale properly with large sets of data. There have been a number of efforts to overcome this significant disadvantage of R, but these efforts have not met with much success and the bottleneck remains an issue which needs to be dealt with seriously.

Continue reading “The Limitation of R Programming”

Interesting Statistics of Employment: 5 Figures

Interesting Statistics of Employment: 5 Figures

It is a common sight to see the old and young talking about the job market that is going through a slump, regardless of the time or the economic conditions of the country; this picture usually is accompanied with some “cutting chai” at tea stalls on busy streets or cool cafes at the malls with the slurp of espresso with a tiny straw where the average upper-middle class youth talk about their first-world dreams while breathing progressive third-world air.

But is that really always the case? Data management or statistical analysis as we have established several times before, is sending the job market into hyper-drive, attracting millions of MNCs into the Indian soil and populating the job search portals with millions of opportunities in data.  But dare we only make statements, we are statisticians and we know that numbers do speak louder than simple statements.

So, in keeping with our love for figures and facts backed by data, DexLab Analytics has compiled a list of interesting statistics about the job market and the process of hiring.

#1 Each and every major corporate job position attracts a minimum of 250 applications!

Out of all these applications only 4 to 6 resumes get shortlisted and are called for interviews. Out of these 4 to 6 people only 1 lucky candidate is selected.

#2 Every job seeker takes into account 5 factors before accepting the position at a firm.

They are –

  • The company culture, values and overall work environment
  • Distance, ease of commute, location
  • Prospects of maintaining work/life balance
  • Growth prospects in career and
  • Pay package and compensation.

#3 Almost 94 percent of sales personnel revealed that base salary is the most important determining factor in the compensation package for them.

But 62 percent of sales personnel say that commission is the most important element.

#4 Out of 3 employees at least 2 say that most employers do not do or do not know how to use social media platforms for promoting job openings.

And 3 out of 4 employees also believe that most companies and employers do not know how to promote their brand on social media networks as well.

#5 Social media platforms are used to search for jobs by 79 percent of jobseekers.

This figure rises to 86 percent for younger job seekers who are in their initial 10 years of job search.

To learn more about statistical analysis and for Data analyst certification in Gurgaon drop by our website at DexLab Analytics.


Interested in a career in Data Analyst?

To learn more about Data Analyst with Advanced excel course – Enrol Now.
To learn more about Data Analyst with R Course – Enrol Now.
To learn more about Big Data Course – Enrol Now.

To learn more about Machine Learning Using Python and Spark – Enrol Now.
To learn more about Data Analyst with SAS Course – Enrol Now.
To learn more about Data Analyst with Apache Spark Course – Enrol Now.
To learn more about Data Analyst with Market Risk Analytics and Modelling Course – Enrol Now.

The evolution of Big Data in business decision making

The evolution of Big Data in business decision making

Big Data is big. We have all established that, and now we know that all the noise about Big Data is not just hype but is reality. The data generated on earth is doubling in every 1.2 years and the mountainous heap of data keep streaming in from different sources with the increase in technology.

Let us look at some data to really understand how big, Big Data is growing:

  • The population of the world is 7 billion, and out of these 7 billion, 5.1 billion people use a smart phone device
  • On an average every day almost 11 billion texts are sent across the globe
  • 8 million videos are watched on YouTube alone
  • The global number of Google searches everyday is 5 billion

But the balance has long been tipped off as we have only been creating data but not consuming it enough for proper use. What we fail to realize is the fact that we are data agents, as we generate more than 25 quintillion bytes of data everyday through our daily online activities. The behaviors that add more numbers to this monstrous hill of data are – online communications, consumer transactions, online behavior, video streaming services and much more.

The numbers of 2012 suggest that world generated more than 2 Zetabytes of data. In simpler terms that is equal to 2 trillion gigabytes. What’s more alarming is the fact that by the year 2020, we will generate 35 trillions of data. To manage this growing amount of data we will need 10 times the servers we use now by 2020 and at least 50 times more data management systems and 75 times the files to manage it all.

The industry still is not prepared to handle such an explosion of data as 80 percent of this data is mainly unstructured data. Traditional statistical tools cannot handle this amount of data, as it is not only too big, but is also too complicated and unorganized to be analyzed with the limited functions offered by traditional statistical analysis tools.

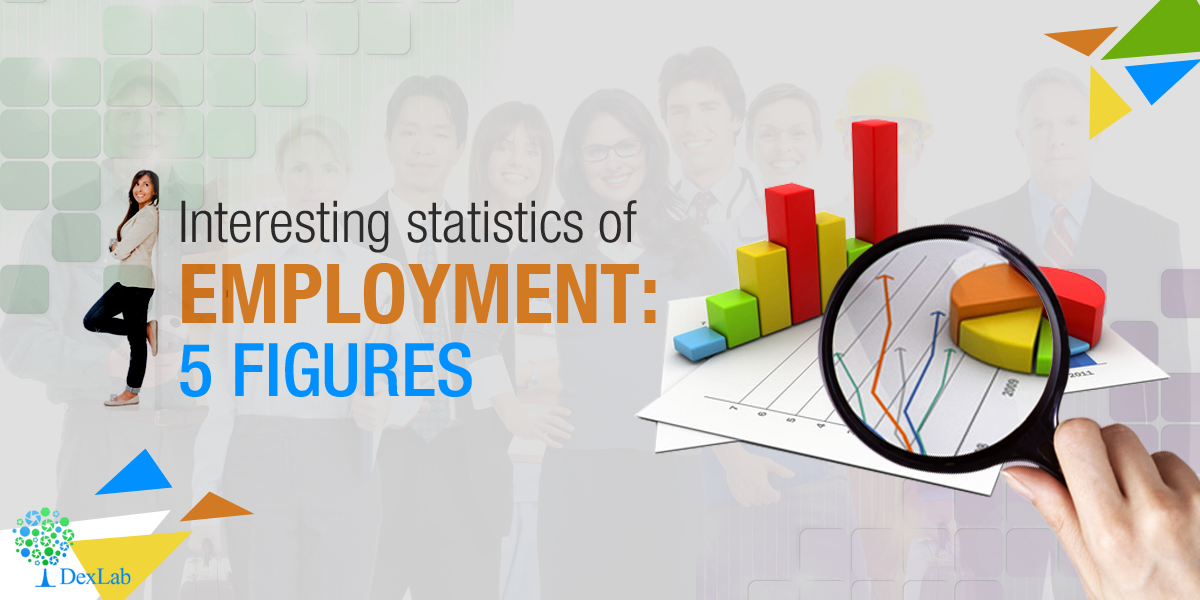
In the realm of data analysts there are only 500 thousand computer scientists, but less than 3000 mathematicians. Thus, the talent pool required to effectively manage Big Data will fall short by at least 100 thousand minds prepared to untangle the complex knots of intertwined data hiding useful information.

But to truly harness the complete potential of Big Data we need more human resource and more tools. For finding value we need to mine all this data.

Then what is the solution to this even bigger problem of tackling Big Data? We need Big Data Analytics. This is more than just a new technological avenue, but on the contrary this is fresh new way of thinking about the company objectives and the strategies created to achieve them. True understanding of Big data will help organizations understand their customers. Big Data analytics is the answer behind where the hidden opportunities lie.

2

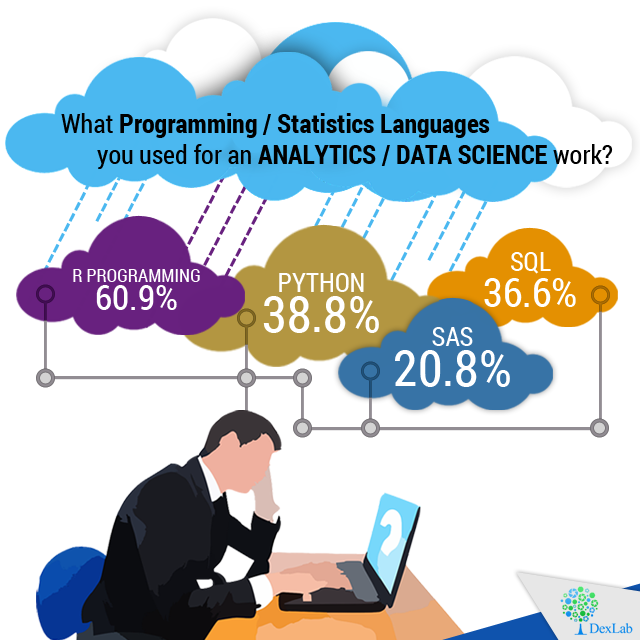
A few advanced tools that are currently in use in the data analysis industry are: SAS, R Programming, Hadoop, Pig, Spark and Hive. SAS is slowly emerging to be an increasingly popular tool to handle data analysis problems, which is why SAS experts are highly in-demand in the job market presently. To learn more about Big Data training institutes follow our latest posts in DexLab Analytics.


Interested in a career in Data Analyst?

To learn more about Data Analyst with Advanced excel course – Enrol Now.
To learn more about Data Analyst with R Course – Enrol Now.
To learn more about Big Data Course – Enrol Now.

To learn more about Machine Learning Using Python and Spark – Enrol Now.
To learn more about Data Analyst with SAS Course – Enrol Now.
To learn more about Data Analyst with Apache Spark Course – Enrol Now.
To learn more about Data Analyst with Market Risk Analytics and Modelling Course – Enrol Now.

Python Vs R- Which You Want To Learn First

Python Vs R- Which You Want To Learn First

If Big Data interests you as a career choice and you are pretty much aware of the skills you need in order to be proficient in this field, in all likelihood you must be aware that R and Python are two leading languages used for analyzing data. And in case you are not really sure as to learn which of the mentioned articles first, this post will help you in making that decision.

2

In the field of analysis of data, R and Python both are free solutions that are easy to install and get started with. And it is normal for the layman to wonder which to learn first. But you may thank the heavens as both are excellent choices.

Let’s Make Visualizations Better In Python with Matplotlib – @Dexlabanalytics.

A recent poll on the most widely used programming languages for analytics and data science reveal the following:

Python Vs R- Which You Want To Learn First


Reasons to Choose R

R has an illustrious history that stretches for a considerable period of time. In addition you receive support from an active, dedicated and thriving community. That translates to the fact that you are more likely to be helped in case you are in need of some assistance or have any queries to resolve. In addition another factor that works in the favor of R is the abundance of packages that contribute greatly to increasing its functionality and make it more accessible which put R as one of the front runners to being the data science tool of choice. R works well with computer languages like Java, C and C++.

How to Parse Data with Python – @Dexlabanalytics.

In situations that call for heavy tasks in statistical analysis as well as creating graphics R programming is the tool that you want to turn to. In R, you are able to perform convoluted mathematical operations with surprising ease like matrix multiplication. And the array-centered syntax of the language make the process of translating the math into lines of code far easier which especially true of persons with little or no coding knowledge and experience.

Reasons to Opt for Python

In contrast to the specialized nature of R, Python is a programming language that serves general purposes and is able to perform a variety of tasks like munging data, engineering and wrangling data, building web applications and scraping websites amongst others. It is also the easier one to master among the two especially if you have learned an OOP or object-oriented programming language previously. In addition the Code written in Python is scalable and may be maintained with more robust code than it is possible in case of R.

The Choice Between SAS Vs. R Vs. Python: Which to Learn First? – @Dexlabanalytics.

Though the data packages available are not as large and comprehensive as R, Python when used in conjunction with tools like Numpy, Pandas, Scikit etc it comes pretty close to the comprehensive functionality of R. Python is also being adopted for tasks like statistical work of intermediate and basic complexity as well as machine learning.


Interested in a career in Data Analyst?

To learn more about Data Analyst with Advanced excel course – Enrol Now.
To learn more about Data Analyst with R Course – Enrol Now.
To learn more about Big Data Course – Enrol Now.

To learn more about Machine Learning Using Python and Spark – Enrol Now.
To learn more about Data Analyst with SAS Course – Enrol Now.
To learn more about Data Analyst with Apache Spark Course – Enrol Now.
To learn more about Data Analyst with Market Risk Analytics and Modelling Course – Enrol Now.

Why the Job Market is Going Gaga over Big Data

We will start off this post with a little bit of trivia.

  • The advertised median salary on offer for technically inclined professionals with expertise in Big Data, which today is a highly sought-after skill is no less than $124,000 inclusive of compensation and bonuses.
  • Cisco, IBM and Oracle together had 26,488 positions that were open during the previous year which required expertise in Big Data.
  • EMC or Dell required 25.1% of all positions in Big Data to have analytics tracks.
  • Data Warehousing, VMWare and developing programming expertise in Python are the fastest growing skill sets that are in demand by companies that are on an expansion of their development teams in Big Data.

why the job market is going gaga over big data

Continue reading “Why the Job Market is Going Gaga over Big Data”

Decades On, SAS is Still the Market Leader

In the 2016 February report by Gartner, SAS bagged the top slot in its execution ability and was once again placed in the quadrant of leaders in the Magic Quadrant for Advanced Analytics Platforms.According to the description, as provided by Gartner, advanced analytics involves various sorts of data analysis through the use of quantitative methods of great sophistication like machine learning, statistics, simulation, data mining in its both predictive and descriptive forms as well as optimization.


Decades On , SAS Still The Leader


The goal is come up with insights that are unlikely to be discovered through approaching business intelligence traditionally like query and reporting.

Continue reading “Decades On, SAS is Still the Market Leader”

How Can Big Data Impact the Lives of Students?

According to figures released by IBM opine that no less than 2.5 quintillion bytes created on a daily basis. Also it is worthwhile to note that a whopping 90% of the total data in the world have been created only in last two years.

In simple terms data is just pieces of information. The highly prominent concept of our times owes its origins to large data amounts which are derived from all sorts of computing devices. This data is then stored, collated and combined with the sophisticated tools for analytics available today.

Big Data is helpful to a broad spectrum of people from marketers to researchers. It helps them to understand the world around them and take optimized action through insights. Students too stand to benefit from Big Data a great deal and in this post we look at two ways through which Big Data may affect the lives of students.

It Helps To Be More Effective

Teachers have always been an informed lot, using data in order to optimize the practices and methods, Big Data facilitates the creation of far more powerful ways through which teachers and students may connect. As the focus shifts towards personalized learning, teachers are in a position to utilize more data than ever before.

This may be achieved through monitoring of study materials and how they are used by students in order to deliver more targeted instruction. With Big Data teachers will be able to better understand the needs of students and adapt lessons effectively and swiftly and in the end make decisions about enhanced learning for students, driven on the basis of data.

2

There is a Huge Demand for Data Scientists

Data Science was dubbed as the sexiest job of this century by Harvard Business Review and with good reason. People are just beginning to explore the possibilities enabled by Big Data and the need of skilled people in the field will only continue to increase in the years to come. Data Scientists have the ability to mine through data to the benefit of their employers including but not restricted to governments, businesses and of course, the academia.

McKinsey Global Institute reported that by 2018 there will be a shortage of no less than 190,000 persons with skills in deep analytics in the United States of America alone. There is no shortage for opportunities in this field and there are numerous programs all over the world that smooth out the career transition to Big Data. Work arrangements that display flexibility, more than decent compensation packages and the opportunity to make a significant impact are the added bonuses that go along being a data scientist.

We may conclude by saying that though Big Data is still emerging it held by most experts to be the undeniable future not only for those pursuing studies in data science and making careers in the field but to all the people whose lives are changed for the better through Big Data.


Interested in a career in Data Analyst?

To learn more about Data Analyst with Advanced excel course – Enrol Now.
To learn more about Data Analyst with R Course – Enrol Now.
To learn more about Big Data Course – Enrol Now.

To learn more about Machine Learning Using Python and Spark – Enrol Now.
To learn more about Data Analyst with SAS Course – Enrol Now.
To learn more about Data Analyst with Apache Spark Course – Enrol Now.
To learn more about Data Analyst with Market Risk Analytics and Modelling Course – Enrol Now.

Call us to know more