Big Data Archives - Page 11 of 17 - DexLab Analytics | Big Data Hadoop SAS R Analytics Predictive Modeling & Excel VBA

The Best Analytics Tools for Business And How to Make The Most of Them

The Best Analytics Tools for Business And How to Make The Most of Them

All companies are awash with useable data about their customers, prospects and internal business operations as well as suppliers and partners. But most of them are also ill-equipped with the requisite understanding to leverage this streaming flood of data and cannot convert it to actionable insights to increase their revenue by growing their revenue thus, increasing their efficiency. Business intelligence tools are technology that allows businesses to transform their data into actions for generating better business.

The Business Intelligence and analytics industry has been around for decades now and is considered by most analytics personnel as a mature industry. But this BI market is never static with constant evolution and innovation to prepare for meeting the ever expanding needs of businesses of all sizes and from a diverse range of industries. So, it is imperative that people gather an understanding of the different Business Analytics tools for better operation of their companies.

2

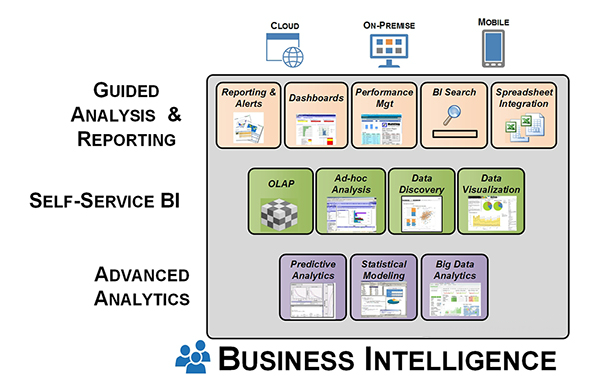
Business Intelligence tools can be categorised in three different groups:

  • Guided analysis and reporting
  • Self-service Business Intelligence and Analysis
  • Advanced Analytics

The first category of guided analysis and reporting includes Business Intelligence tools of traditional styles that have long been used for years to perform recurrent data analyses of specified data groups. This system of data analysis was only used for predefined static reporting several years ago, but today it is possible for data analysts to select, compare, visualize and analyse data using various tools and features.

Tool styles in this category include the following:

  • Reports
  • Scorecards and dashboards
  • Spreadsheet integration
  • BI Search
  • Corporate Performance Management

The second category of BI tools which falls under the category of self-service BI and analysis includes the tools BI users utilize to make ad hoc analysis of data. Such analytical practices may be a one-time analysis or building of a recurring analytical system that may with shared by others.

Usually the users of such Bi tools have a dual role to play – consumer of information and producer of analytical systems. They usually share or publish their BI application which they build with the self-service BI tool. The users of such tools will always have the term analyst in their job title. Staff members of the management department may also make use of such tools when they need to perform similar tasks as that of a business analyst, for their peers even if their job title does not imply that.

The Business Intelligence tools include in this category includes the following:

  • Ad hoc analyses and reporting
  • OLAP cubes i.e. online analytical processing
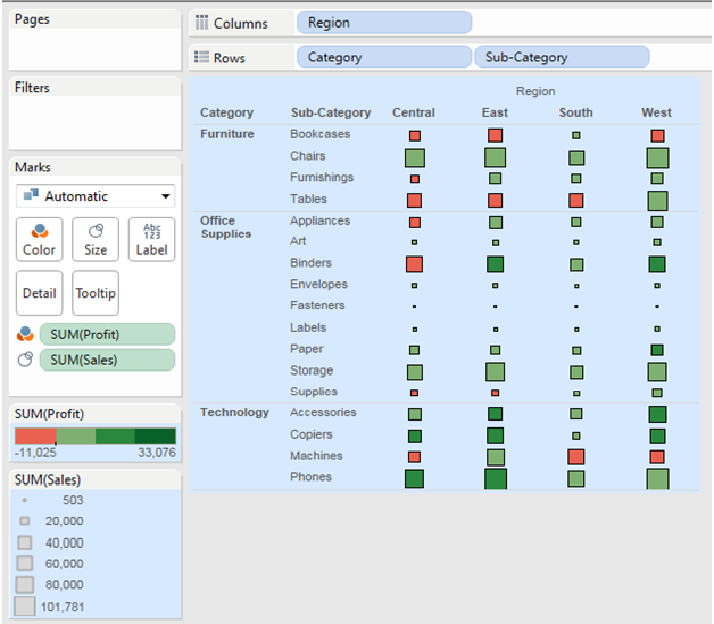
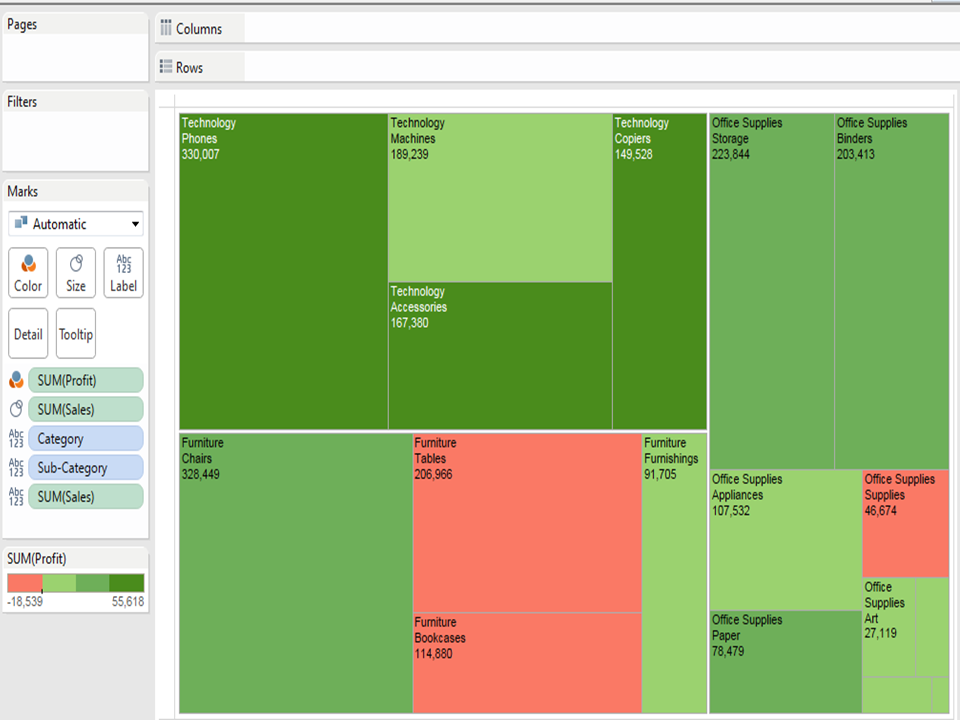
  • Data visualization
  • Data discovery

The third category of advanced analytics includes the tools that a data scientist uses to build predictive and prescriptive models of analysis. These are tools for predictive modelling, statistical modelling and data mining along with rigorous use of big data analytics software. In these cases data analyst spend a huge chunk of their time performing tasks like data ingestion, cleansing and integration.

To understand the full spectrum of different Business Intelligence tool classes here is a visual explanation:

dexlab

Who should invest in BI tools?

For a long time now investment and use of BI tools has been growing gradually regardless of the economic conditions. And it has especially accelerated in the recent times as companies crave for data for better growth and more organized operations. While data analytics tools were mainly associated with large enterprises due to their cost, complexity and demand of high skilled personnel, but those factors have now been grossly transformed as more and more SMBs (small and medium sized businesses) now being significant customers of BI tools and software.

Now that you have a good understanding of the different tool categories and how they should be deployed, the next step for you is to understand your  company specific needs and make the best use of these tools that are optimized for so.


Interested in a career in Data Analyst?

To learn more about Data Analyst with Advanced excel course – Enrol Now.
To learn more about Data Analyst with R Course – Enrol Now.
To learn more about Big Data Course – Enrol Now.

To learn more about Machine Learning Using Python and Spark – Enrol Now.
To learn more about Data Analyst with SAS Course – Enrol Now.
To learn more about Data Analyst with Apache Spark Course – Enrol Now.
To learn more about Data Analyst with Market Risk Analytics and Modelling Course – Enrol Now.

The Dark Data on Why Crime Against Women are on The Rise in India

India, a land known for its diversity, rich heritage, culture, colourful and flavoursome food, a never-ending list of occasions and holidays and the slightly recent addition of rape and other violent crimes against women!


The Dark Data on Why Crime Against Women are on The Rise in India


We though enraged by the death toll of Nibhayas’ in Delhi and the rest of the country are not here to write an infuriating open letter to the World Wide Web. When India’s daughter, the documentary made by a British film-maker made big news after its release on YouTube, the country’s protectors and ‘patriots’ jumped right in with a concoction of nicely cooked data showcasing how the rate of crime against women are similar in the UK as it is in India! But we as a data-friendly nation often forget the main utility of data analysis. Continue reading “The Dark Data on Why Crime Against Women are on The Rise in India”

A Deeper Look at Rajnikanth’s Movie Kabali from the Perspective of a Data Analyst

A Deeper Look at Rajnikanth’s Movie Kabali from the Perspective of a Data Analyst

As we can see from the above analytical assessment that while sultan needed the help of other factors like a special occasion such as Eid, Kabali’s success which is almost unmatchable to the success of Sultan needed no such push. The numbers suggest that Kabali was able to make a bigger splash in the overseas fan base Sultan was only able to rule its own country’s fan base.


These were simply the statistical reports on the comparison of the above mentioned two films done with the help of SAS. We in no intend to spark a war between the fan-bases of respective actors and respect both their talents in their own domain. Who’s to say who the real Sultan of Indian Film Industry is still a question too big for simple data folks to ascertain. May be you could help us find an answer to this unique analytical problem? Feel free to add your thoughts in the comments below. 


Interested in a career in Data Analyst?

To learn more about Data Analyst with Advanced excel course – click here.
To learn more about Data Analyst with SAS Course – click here.
To learn more about Data Analyst with R Course – click here.
To learn more about Big Data Course – click here.

The 1st Clinical Trial Predictive Model By Pfizer is Here

Joining the data analytics bandwagon, the pharmaceutical giant Pfizer has launched their first clinical trial predictive modelling system which is aimed at reducing study risk during protocol design and to better study execution phases. In a recent interview Jonathan Rowe, the Executive Director and Head of Clinical Development Quality Performance and Risk Management of Pfizer shed some light on these predictive modelling systems.


The 1st Clinical Trial Predictive Model By Pfizer is Here


When asked in the interview about the purpose of their predictive model and what it is meant to achieve, Rowe responded as follows…


It is true that there are quite a few models in the realm of GCP quality performance which we have developed and continue to refine. A relatively straightforward one is the correlation model where we correlate our clinical trial process performance to select the results of the GCP as is defined in the ICH E6. Continue reading “The 1st Clinical Trial Predictive Model By Pfizer is Here”

Difference between a Heat Map and a Tree Map

Difference between a Heat Map and a Tree Map

Are you planning to pursue a Tableau training course in Delhi? Then you must be well aware of this common confusion about the difference between these two widely used maps. There are two very useful charts which help in analyzing data, heat maps and tree maps. Heat maps and tree maps are highly insightful visualizations. However, many a times, there is a confusion between the two due to which analysts either use misuse it or totally avoid using it.

This article will help to draw a clear line between heat maps and tree maps, thus enabling analysts pursuing tableau certification, Gurgaon to create better visualizations.

We the faculty at Dexlab Analytics, the premiere Tableau Training Institute in Gurgaon aim to clarify this common doubt with this brief discussion on these two maps.

Data Science Machine Learning Certification

What are heat maps?

Heat map is a type of visualization tool that is very apt to compare different categories. It helps to visualize measures against dimensions with the help of colors and size to compare one or more dimensions & up to two measures. The layout is similar to a text table with variations in values encoded as colors. In heat map, you can quickly see a wide array of information.

In a heat map, one measure can be assigned to the color and another measure can be assigned to the size.

 Quick Hands-On: Shows the sales and profit in all regions for different products category and sub-Category.

Analysis of visualization: The profit is represented by the color and ranges from red for loss to green for profit. The total sales are represented by the size.

Analysis of visualization

Hence, it is very easy to understand the performance of different products in different regions, at one glance, just by looking at the heat map.

What are tree maps?

Tree maps are a relatively new feature in Tableau, first appearing in version 8.0. The ‘tree map’ is a chart type that displays hierarchical or part-to-whole relationships via rectangles. In case of hierarchical (tree-structured) data these rectangles are nested. The space in the view is divided into rectangles that are sized and ordered by a measure. Nested rectangles mean that hierarchy levels in the data are expressed by larger rectangles (above in the hierarchy) containing smaller ones (below in the hierarchy). The rectangles in the tree map range in size from the top left corner of the chart to the bottom right corner, with the largest rectangle positioned in the top left corner and the smallest rectangle in the bottom right corner.

In a tree map 1 or more dimensions & up to 2 measures are used to create such a map.

Quick Hands- On: Show the sales and profit in all regions for different products category and Sub-Category.

Analysis of the visualization: The profit (color) and sales (size) of products are given at a Category and Sub- Category level. Bigger the size of the node, greater is the sales in that state. Similarly, the greener the node, more is the profit in that state.

Dexlab-2nd-images

Summary: A slight disadvantage of using tree maps in Tableau is that, as the number of items increase, the amount of space allocated for each item decreases. Hence, the area available to print the labels, become small.  As a result, usually, in a tree map almost all the squares or nodes will appear blank. This defect can be overcome by providing appropriate tooltips for each node. Like in heat maps, measures can be assigned to give different   colors and sizes to the nodes in the tree map.

To learn the right use of these two maps in Tableau we recommend seeking a corporate Tableau Training in Delhi NCR for better understanding of this complex statistical application.


Interested in a career in Data Analyst?

To learn more about Data Analyst with Advanced excel course – Enrol Now.
To learn more about Data Analyst with R Course – Enrol Now.
To learn more about Big Data Course – Enrol Now.

To learn more about Machine Learning Using Python and Spark – Enrol Now.
To learn more about Data Analyst with SAS Course – Enrol Now.
To learn more about Data Analyst with Apache Spark Course – Enrol Now.
To learn more about Data Analyst with Market Risk Analytics and Modelling Course – Enrol Now.

Statistics of Workforce Inequality & Life After Work

Online companies and IT firms have been frequently criticized for their lack of diversity and gender inequality in the work force. So, we researched about some facts and statistics to understand these claims as after all we are data-driven being the premiere Analytics training institute, Pune. We found a gap in several US-based internet firms which have published diversity reports since, 2014 but what they claim has been starkly different from what the truth in the numbers happened to be. Surprisingly, being a developing nation, India has fared quite well in this realm with most of IT MNCs having addressed the issue of gender inequality in their workplace.


Statistics of workforce inequality & life after work


Here are some statistical facts about workplace diversity in internet companies in the US that show lack of diversity:


With majority of people that account for the AP (Advanced Placement) test takers in total only 20 percent were female in the tests for AP computer science test takers as of the data from 2014. Various US-based online corporations have been criticized for their apparent lack of tolerance and unwelcoming nature against females and non-Caucasians. Continue reading “Statistics of Workforce Inequality & Life After Work”

Aspiring Data Analysts Must Know the Answer to These Interview Questions

Aspiring data analysts must know the answer to these interview questions

You have recently completed Data analyst certification and are hunting vigorously for a job as a data scientist. But the prospect of sitting for such an important job role at a corporate firm in front of a room full of C-suite interviewers is an intimidating prospect. But fear not as we at DexLab Analytics have got you covered both inside the class room as well out.

This megatrend on Big Data analysts started first in 2013, when the leading universities of the world began to realize the gap in between the demand and supply of Big Data professionals. And soon several , Data analyst training institutes cropped up here and there and rooms transformed into classrooms with several students being keen to learn about the steps to handle Big Data  and to join the ranks of data scientists which is a highly sought after profession of these days. Continue reading “Aspiring Data Analysts Must Know the Answer to These Interview Questions”

Banking Business and Banking Instruments

Having discussed some amount of mandatory regulatory compliances for banks over the past couple of blogs, let us now focus on the bank’s lines of business. Understanding the different banking products is inevitable for credit risk management and analytics. One has to be well versed with the nature of banking products before they step in to develop model for any of them.  Each banking product has its own characteristics and its own set of risk exposure. Hence, understanding these products is the top priority. In this blog we discuss three of the major banking products: Checking Accounts, Savings accounts and Certificate of Deposits.


BANKING BUSINESS AND BANKING INSTRUMENTS- Part 1


Checking Accounts: This is a transactional deposit account held at a financial institution that allows for withdrawal and deposits. Money held in a checking account is liquid, and can be easily withdrawn using checks, automated cash machines, and electronic debits among other methods. It allows for numerous withdrawals, unlimited deposits etc. These accounts are known as current accounts in UK. These are often loss leaders for large commercial banks since they become highly commotized. Because money held in checking accounts is so liquid, aggregate balances nationwide are used in the calculation of M1 money supply. Continue reading “Banking Business and Banking Instruments”

How Amazon Uses Big Data for Success

How Amazon uses Big Data for success

Taking a stroll around the lanes of Big Data is no cake walk. The main problem being that well, Big Data is big to tackle and on top of that complex to analyze and draw insights from. That is why the world needs more data analysts. Also the many nuances of Big Data architecture make it especially difficult for the concerned personnel to grasp its requirements. Also the concept is relatively new there is a lack of understanding and experience in the field of Big Data which is often the management of major corporations misuse their Big Data.

The best way to learn about how you can use your company’s Big Data effectively is by paying a close attention to how other companies have used their data and by effectively implementing similar practices. One such company who has done so is Amazon.com.

2

There is no hint of doubt about the data expertise of Amazon.com as it is one of the key innovators in the realm of Big Data technology. This is a giant that has given us a great idea on how to collect, analyze and then successfully implement data analytical reports. Moreover, in addition to using Big Data successfully for its own purpose the company has also leveraged its own data usage tools for helping others with tools like Amazon Elastic MapReduce.

Amazon has taught us several lessons on how to successfully implement Big Data to amplify revenue generation:

Get your eyes on the customer:

The premier uses of Amazon’s Big Data are with its customer recommendations. If one has an Amazon account they use on a regular basis then you will notice that all the recommendations on your homepage are based on your browsing history. Everything including sale items to special discount offers is based on your previous purchases and your product browsing history. Now you may argue that even several other sites including the whole of internet works like that, but while they might a frequent occurrence today Amazon was among the first ones to start this trend.

It was one of the first organizations to provide its customers with a focused and personalized buying recommendation that made them buy more. Who knew the best way to make people buy more than they want was just to tell them that with an enticing deal?! This solution is a simple one and works for several problems.

This is the best lesson that Amazon has taught the business world. For any business to succeed and to use Big Data well the main focus should be on the customers. If your customers are happy then you will be better off at your business. That is the basic rule of thumb when it comes to business after all.

Sniff out all the data you can:

This retailing giant uses Big Data gathering tools and uses it to the best of its advantages. The company gathers a lot of data by the hour or better put by the second. So, it might be easy to lose focus on why data is being gathered and which type is necessary or how it can be useful to the customers. But this company does not let those parts slide. The company gathers and analyzes its data diligently and never fails to upgrade its workings with the findings.

Big Data has worked for Amazon now make sure it works for you take Big Data courses to better handle your data.


Interested in a career in Data Analyst?

To learn more about Data Analyst with Advanced excel course – Enrol Now.
To learn more about Data Analyst with R Course – Enrol Now.
To learn more about Big Data Course – Enrol Now.

To learn more about Machine Learning Using Python and Spark – Enrol Now.
To learn more about Data Analyst with SAS Course – Enrol Now.
To learn more about Data Analyst with Apache Spark Course – Enrol Now.
To learn more about Data Analyst with Market Risk Analytics and Modelling Course – Enrol Now.

Call us to know more