Big data training Archives - Page 3 of 15 - DexLab Analytics | Big Data Hadoop SAS R Analytics Predictive Modeling & Excel VBA

Big Data Analytics: 10 Data-Slurping Things Everyone Should Know

Big Data Analytics: 10 Data-Slurping Things Everyone Should Know

Big Data is no more a fleeting obsession. With numbers. It’s the beginning of a cognitive revolution that’s touching every facet of life and business on this planet.

Thanks to technological advancement, we’re churning more data than ever before. In fact, a lot more. And for good reason.

Every second we create new data – Don’t believe me?

Here are 10 mindboggling stats about big data – how it’s created, ways it’s being used and how much of it is still out there waiting to AMAZEEE us!!!

In short, this convinces us why we can’t afford to ignore big data and analytics:

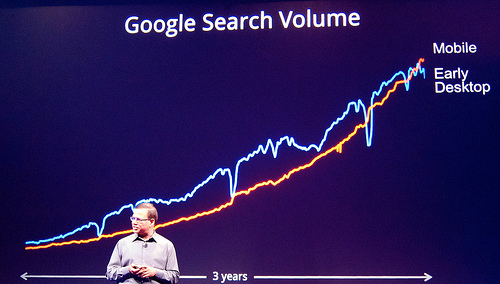
Data volumes are exploding – the way it’s growing, by the end of 2020, it would generate 1.7 megabytes of new data every second for every human being living on this planet.

In a couple of years, our aggregated digital reservoir of data will expand from 4.4 zettabytes to approximately 44 zettabytes, or 44 trillion gigabytes.

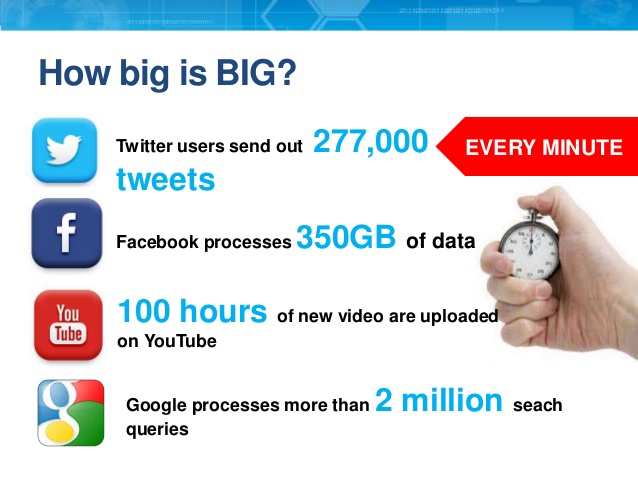
Facebook users view 2.77 million videos and send 31.25 million messages, on an average every minute.

Whaaaat??!!!

Too much to process??

Wait, till you hear this!

Every minute up to 300 hours of video are being uploaded on YouTube, alone.

 Yes, while you are reading this blog, loads of users are already uploading chunks of content online.

For that reason or other, within the next 5 years, there will be more than 50 billion smart connected devices in the world, all powered by cutting edge data analysis technology.

Be ready to collect, analyze and share data without batting eyelids.

By 2020, one third of total data will roll over to the cloud (a concentrated network of servers all connected through the Internet)

Distributed Computing is the future. Google uses it involving 1000 computers to solve a single search query within 0.2 seconds. Woah!!!

Hadoop market is expected to grow at a compound annual growth rate 58% beating $1 billion mark by 2020.

The White House is heard to have invested more than $200 million in big data projects.

Now, the most spectacular fact is that less than 0.5% of all data is analyzed and used till now… So, just imagine the potential it withholds!!

In the next five years, big data is going to touch the moon, and what about you?! Don’t you feel like joining the data-inspired bandwagon?

Go, grab a quick Big Data Hadoop training in Gurgaon — and fill in oodles of knowledge, skill and expertise for improving your career graph and business performance. For more information on big data hadoop certification, drop by our expert website of DexLab Analytics.

The blog has been sourced from 

https://www.forbes.com/sites/bernardmarr/2015/09/30/big-data-20-mind-boggling-facts-everyone-must-read/#6a5cef7817b1

https://www.datasciencecentral.com/profiles/blogs/15-astonishing-tweetable-facts-about-analytics


Interested in a career in Data Analyst?

To learn more about Data Analyst with Advanced excel course – Enrol Now.
To learn more about Data Analyst with R Course – Enrol Now.
To learn more about Big Data Course – Enrol Now.

To learn more about Machine Learning Using Python and Spark – Enrol Now.
To learn more about Data Analyst with SAS Course – Enrol Now.
To learn more about Data Analyst with Apache Spark Course – Enrol Now.
To learn more about Data Analyst with Market Risk Analytics and Modelling Course – Enrol Now.

6 Mind-Blowing Facts on Big Data Everyone Must Know

6 Mind-Blowing Facts on Big Data Everyone Must Know


The hot topic in today’s business world is Big Data. The ability to access and analyze the massive amount of data generated every second is crucial for the growth of a business. In this blog, we highlight the rapid growth in data and its significance in business decisions through some incredible statistics.

Data Science Machine Learning Certification

  1. The amount of information man created from the dawn of civilization until 2003 is currently created every two days!

    And the instant messages, tweets and pictures you exchange every second contributes to this data. Ex CEO of Google, Eric Schmidt wonders if the world is ready for the big data-driven technological revolution that is imminent.

  1. 5 quintillion bytes of data are generated by internet users on a daily basis.

    If the data generated in a day was burned onto DVDs, the number would be so massive that it could be piled on top of each other to reach the moon twice!

  1. Out of all the data we create, only about 0.5% is analyzed and put to use.

There’s a huge amount of data that remains untapped. For all the Silicon Valley big shots, like Google, LinkedIn and Facebook, the aim is to link big data with personal data and create products that are highly personalized.

  1. 40,000 search queries are processed by Google every second and these add up to 3.5 billion searches each day and 1.2 trillion searches every year globally.

Google was founded in 1998 and back then it was catering to only ten thousand search queries every day. However, you shall be astonished after knowing that since 2006 more than ten thousand search queries have been performed through Google per second!

  1. Big data has the potential to create 6 million jobs in the U.S.

    LinkedIn’s head of data recruiting, Sherry Shah, described the big data job market as being ‘’very hot right now’’.

  1. A 10% increase in the data accessibility for Fortune 1000 companies is likely to increase their income by $65 million!

    And this is exactly why companies care so much about big data.

The job market for big data and analytics looks promising. Especially if you are fresher skilled in big data Hadoop then there’s a lot of scope for you. Compared to the current demand for professionals with Hadoop training, the number of available candidates is low. So, what are you waiting for? Enroll for Hadoop training in Gurgaon and grab amazing discounts on big data certifications.


This article has been sourced from:

ediscovery.co/ediscoverydaily/electronic-discovery/date-fun-facts-big-data-ediscovery-trends


Interested in a career in Data Analyst?

To learn more about Data Analyst with Advanced excel course – Enrol Now.
To learn more about Data Analyst with R Course – Enrol Now.
To learn more about Big Data Course – Enrol Now.

To learn more about Machine Learning Using Python and Spark – Enrol Now.
To learn more about Data Analyst with SAS Course – Enrol Now.
To learn more about Data Analyst with Apache Spark Course – Enrol Now.
To learn more about Data Analyst with Market Risk Analytics and Modelling Course – Enrol Now.

How Can Big Data Tools Complement a Data Warehouse?

How Can Big Data Tools Complement a Data Warehouse?

Every person believes that he/she is above average. Businesses feel the same way about their best asset— data. They want to believe that their big data is above average and perfect for implementing advanced big data tools. But, that’s not the case always.

Do you really need big data tools?

In the data world, big data tools like Hadoop Spark and NoSQL are like freight trains delivering goods. Freight trains are powerful, but they’ve limited routes and a slow start. They are great for delivering goods in bulk regularly. However, if you need a swift delivery, freight train might not be the best choice.

So firs of all, it is important to understand if there’s a big data scenario in your business or not.

A 100 times increase in data velocity, volume or variety indicates that you have a big data situation at hand. For example, if data velocity increases to hundreds of thousands of transactions per hour from thousands of transactions, or if the data sources shoot up from dozens to hundreds, you can safely conclude that your business is dealing with big data.

In such scenarios, you are likely to get frustrated with traditional SQL tools. A complete revamp or moderate tuning of existing big data tools is needed to effectively handle such massive data sets.

2

What tools to use?

The tool to be used depends on the task at hand. For main business outcomes like sales, payments, etc., traditional reporting tools employed within the data warehouse architecture are suitable. For secondary business outcomes like following the customer journey in detail, tracking browsing history and monitoring device activity, big data tools within data warehouse are necessary. In a data warehouse these events are aggregated into models that show the summarized business processes.

Incorporating Big Data Tools in Data Warehouse

Consider an alarm company with sensors that are connected though the internet across an entire country. Storing the response of individual sensors in a SQL data warehouse would incur huge expenses, but no value. An alternative storage solution is retaining this information in data lake environments that are cheaper and later aggregating them in a data warehouse. For example, the company could define sensor events that constitute a person locking up a house. A fact table recording departures and arrivals could be stoked up in a data warehouse as an aggregate event.

There are many other use cases. Some are given below:

Sum up and filter IoT data:  A leading bed manufacturing company uses biometric sensors in their range of luxury mattresses. Apache Hadoop could be used to store individual sensor readings and Apache Spark can be employed to amass and filter signals. The aggregated data in data warehouses can be used to create time-trended reports once the boundary metrics are surpassed.

Merge real-time data with past data: Financial institutes need live access to market data. However, they also need to store that data and use it for identifying historical trends in future. Merging these two types of data with tools like Apache Kafka or Amazon Kinesis is important because, with these tools the data can be directly streamed to visualization tools and there’s hardly any delay.

The ultimate goal is to form a balance between the two sides of the data pipeline. While it is important to collect as much raw data about customers as possible, it is equally important to use the right tool for the right job.

To read more blogs on the latest developments in the field of big data, follow DexLab Analytics. We are a premier Hadoop training institute in Gurgaon. To aid your big data dreams, we have started a new admission drive #BigDataIngestion where we offer flat 10% discount to all students interested in our big data Hadoop courses. Enroll now!


Reference: https://tdwi.org/articles/2018/07/20/arch-all-5-use-cases-integrating-big-data-tools-with-data-warehouse.aspx


Interested in a career in Data Analyst?

To learn more about Data Analyst with Advanced excel course – Enrol Now.
To learn more about Data Analyst with R Course – Enrol Now.
To learn more about Big Data Course – Enrol Now.

To learn more about Machine Learning Using Python and Spark – Enrol Now.
To learn more about Data Analyst with SAS Course – Enrol Now.
To learn more about Data Analyst with Apache Spark Course – Enrol Now.
To learn more about Data Analyst with Market Risk Analytics and Modelling Course – Enrol Now.

The 8 Leading Big Data Analytics Influencers for 2018

The 8 Leading Big Data Analytics Influencers for 2018

Big data is one of the most talked about technology topics of the last few years. As big data and analytics keep evolving, it is important for people associated with it to keep themselves updated about the latest developments in this field. However, many find it difficult to be up to date with the latest news and publications.

If you are a big data enthusiast looking for ways to get your hands on the latest data news, then this blog is the ideal read for you. In this article, we list the top 8 big data influencers of 2018. Following these people and their blogs and websites shall keep you informed about all the trending things in big data.

2

Kirk Borne

Known as the kirk in the field of analytics, his popularity has been growing over the last couple of years.  From 2016 to 2017, the number of people following him grew by 30 thousand. Currently he’s the principal data scientist at Booz Allen; previously he has worked with NASA for a decade. Kirk was also appointed by the US president to share his knowledge on Data Mining and how to protect oneself from cyber attacks. He has participated in several Ted talks. So, interested candidates should listen to those talks and follow him on Twitter.

Ronald Van Loon

He is an expert on not only big data, but also Business Intelligence and the Internet of Things, and writes articles on these topics so that readers become familiar with these technologies. Ronald writes for important organizations like Dataconomy and DataFloq. He has over hundred thousand followers on Twitter. Currently, he works as a big data educator at Simplelearn.

Hilary Manson

She is a big data professional who manages multiple roles together. Hilary is a data scientist at Accel, Vice president at Cloudera, and a speaker and writer in this field. Back in 2014, she founded a machine learning research company called Fast Forward labs. Clearly, she is a big data analytics influencer that everyone should follow.

Carla Gentry

Currently working in Samtec Inc; she has helped many big shot companies to draw insights from complicated data and increase profits. Carla is a mathematician, an economist, owner of Analytic Solution, a social media ethusiat, and a must-follow expert in this field.

Vincent Granville

Vincent Granville’s thorough understanding of topics like machine learning, BI, data mining, predictive modeling and fraud detection make him one the best influencers of 2018. Data Science Central-the popular online platform for gaining knowledge on big data analytics has been cofounded by Vincent.

Merv Adrian

Presently the Research Vice President at Gartner, he has over 30 years of experience in IT sector. His current work focuses on upcoming Hadoop technologies, data management and data security problems. By following Merv’s blogs and twitter posts, you shall be informed about important industry issues that are sometimes not covered in his Gartner research publications.

Bernard Marr

Bernard has earned a good reputation in the big data and analytics world. He publishes articles on platforms like LinkedIn, Forbes and Huffington Post on a daily basis. Besides being the major speaker and strategic advisor for top companies and the government, he is also a successful business author.

Craig Brown

With over twenty years of experience in this field, he is a renowned technology consultant and subject matter expert. The book Untapped Potential, which explains the path of self-discovery, has been written by Craig.

If you have read the entire article, then one thing is very clear-you are a big data enthusiast! So, why not make your career in the big data analytics industry?

Enroll for big data Hadoop courses in Gurgaon for a firm footing in this field. To read more interesting blogs regularly, follow Dexlab Analytics– a leading big data Hadoop training center in Delhi. Interested candidates can avail flat 10% discount on selected courses at DexLab Analytics.


Reference: www.analyticsinsight.net/top-12-big-data-analytics-and-data-science-influencers-in-2018


Interested in a career in Data Analyst?

To learn more about Data Analyst with Advanced excel course – Enrol Now.
To learn more about Data Analyst with R Course – Enrol Now.
To learn more about Big Data Course – Enrol Now.

To learn more about Machine Learning Using Python and Spark – Enrol Now.
To learn more about Data Analyst with SAS Course – Enrol Now.
To learn more about Data Analyst with Apache Spark Course – Enrol Now.
To learn more about Data Analyst with Market Risk Analytics and Modelling Course – Enrol Now.

Top 5 Up-And-Coming Big Data Trends for 2018

Top 5 Up-And-Coming Big Data Trends for 2018

The big data market is constantly growing and evolving. It is predicted that by 2020 there will be over 400,000 big data jobs in the US alone, but only around 300,000 skilled professionals in the field. The constant evolution of the big data industry makes it quite difficult to predict trends. However, below are some of the trends that are likely to take shape in 2018.

Open source frameworks:

Open source frameworks like Hadoop and Spark are dominating the big data realm for quite some time now and this trend will continue in 2018. The use of Hadoop is increasing by 32.9% every year- according to Forrester forecast reports. Experts say that 2018 will see an increase in the usage of Hadoop and Spark frameworks for better data processing by organizations. As per TDWI Best Practices report, 60% of enterprises aim to have Hadoop clusters functioning in production by end of 2018.

As Hadoop frameworks are becoming more popular, companies are looking for professionals skilled in Hadoop and similar techs so that they can draw valuable insights from real-time data. Owing to these reasons, more and more candidates interested to make a career in this field are going for big data Hadoop training.

Visualization Models:

A survey was conducted with 2800 BI experts in 2017 where they highlighted the importance of data discovery and data visualization. Data discovery isn’t just about understanding, analyzing and discovering patterns in the data, but also about presenting the analysis in a manner that easily conveys the core business insights. Humans find it simpler to process visual patterns. Hence, one of the significant trends of 2018 is development of compelling visualization models for processing big data.

2

Streaming success:

Every organization is looking to master streaming analytics- a process where data sets are analyzed while they are still in the path of creation. This removes the problem of having to replicate datasets and provides insights that are up-to-the-second. Some of the limitations of streaming analytics are restricted sizes of datasets and having to deal with delays. However, organizations are working to overcome these limitations by end of 2018.

Dark data challenge

Dark data refers to any kind of data that is yet to be utilized and mainly includes non-digital data recording formats such as paper files, historical records, etc. the volume of data that we generate everyday may be increasing, but most of these data records are in analog form or un-digitized form and aren’t exploited through analytics. However, 2018 will see this dark data enter cloud. Enterprises are coming up with big data solutions that enable the transfer of data from dark environments like mainframes into Hadoop.

Enhanced efficiency of AI and ML:

Artificial intelligence and machine learning technologies are rapidly developing and businesses are gaining from this growth through use cases like fraud detection, pattern recognition, real-time ads and voice recognition. In 2018, machine learning algorithms will go beyond traditional rule-based algorithms. They will become speedier and more precise and enterprises will use these to make more accurate predictions.

These are some of the top big data trends predicted by industry experts. However, owing to the constantly evolving nature of big data, we should brace ourselves for a few surprises too!

Big data is shoving the tech space towards a smarter future and an increasing number of organizations are making big data their top priority. Take advantage of this data-driven age and enroll for big data Hadoop courses in Gurgaon. At DexLab Analytics, industry-experts patiently teach students all the theoretical fundamentals and give them hands-on training. Their guidance ensures that students become aptly skilled to step into the world of work. Interested students can now avail flat 10% discount on big data courses by enrolling for DexLab’s new admission drive #BigDataIngestion.


Reference: https://www.analyticsinsight.net/emerging-big-data-trends-2018


Interested in a career in Data Analyst?

To learn more about Data Analyst with Advanced excel course – Enrol Now.
To learn more about Data Analyst with R Course – Enrol Now.
To learn more about Big Data Course – Enrol Now.

To learn more about Machine Learning Using Python and Spark – Enrol Now.
To learn more about Data Analyst with SAS Course – Enrol Now.
To learn more about Data Analyst with Apache Spark Course – Enrol Now.
To learn more about Data Analyst with Market Risk Analytics and Modelling Course – Enrol Now.

Step-by-step Guide for Implementation of Hierarchical Clustering in R

Step-by-step Guide for Implementation of Hierarchical Clustering in R

Hierarchical clustering is a method of clustering that is used for classifying groups in a dataset. It doesn’t require prior specification of the number of clusters that needs to be generated. This cluster analysis method involves a set of algorithms that build dendograms, which are tree-like structures used to demonstrate the arrangement of clusters created by hierarchical clustering.

It is important to find the optimal number of clusters for representing the data. If the number of clusters chosen is too large or too small, then the precision in partitioning the data into clusters is low.

NbClust

The R package NbClust has been developed to help with this. It offers good clustering schemes to the user and provides 30 indices for determining the number of clusters.

Through NbClust, any combination of validation indices and clustering methods can be requested in a single function call. This enables the user to simultaneously evaluate several clustering schemes while varying the number of clusters.

One such index used for getting optimum number of clusters is Hubert Index.

2

Performing Hierarchical Clustering in R

In this blog, we shall be performing hierarchical clustering using the dataset for milk. The flexclust package is used to extract this dataset.

The milk dataset contains observations and parameters as shown below:

As seen in the dataset, milk obtained from various animal sources and their respective proportions of water, protein, fat, lactose and ash have been mentioned.

For making calculations easier, we scale down original values into a standard normalized form. For that, we use processes like centering and scaling. The variable may be scaled in the following ways:

Subtract mean from each value (centering) and then divide it by standard deviation or divide it by its mean deviation about mean (scaling)

Divide each value in the variable by maximum value of the variable

After scaling the variables we get the following matrix

The next step is to calculate the Euclidean distance between different data points and store the result in a variable.

Hierarchical average linkage method is used for performing clustering of different animal sources. The formula used for that is shown below.

We obtain 25 clusters from the dataset.

To draw the dendogram we use the plot command and we obtain the figure given below.


The Nbclust library is used to get the optimum number of clusters for partitioning the data. The maximum and minimum number of clusters that is needed is stored in a variable. The nbClust method finds out the optimum number of clusters according to different clustering indices and finally the Hubert Index decides the optimum value of the number of clusters.

The optimum cluster value is 3, as can be seen in the figure below.

Values corresponding to knee jerk visuals in the graph give the number of clusters needed.

The graph shows that the maximum votes from various clustering indices went to cluster 3. Hence, the data is partitioned into 3 clusters.

The graph is partitioned into 3 clusters as shown by the red lines.

Now, the points are portioned into 3 clusters as opposed to the 25 clusters we got initially.

Next, the clusters are assigned to the observations.

The clusters are assigned different colors for ease of visualization


That brings us to a close on the topic of Hierarchical clustering. In the upcoming blogs, we shall be discussing K-Means clustering. So, follow DexLab Analytics – a leading institute providing big data Hadoop training in Gurgaon. Enroll for their big data Hadoop courses and avail flat 10% discount. To more about this #SummerSpecial offer, visit our website.


Interested in a career in Data Analyst?

To learn more about Data Analyst with Advanced excel course – Enrol Now.
To learn more about Data Analyst with R Course – Enrol Now.
To learn more about Big Data Course – Enrol Now.

To learn more about Machine Learning Using Python and Spark – Enrol Now.
To learn more about Data Analyst with SAS Course – Enrol Now.
To learn more about Data Analyst with Apache Spark Course – Enrol Now.
To learn more about Data Analyst with Market Risk Analytics and Modelling Course – Enrol Now.

Study: Demand for Data Scientists is Sky-Rocketing; India Leads the Show

Study: Demand for Data Scientists is Sky-Rocketing; India Leads the Show

Last year, India witnessed a surging demand for data scientists by more than 400% – as medium to large-scale companies are increasingly putting their faith on data science capabilities to build and develop next generation products that will be well integrated, highly personalized and extremely dynamic.

Companies in the Limelight

At the same time, India contributed to almost 10% of open job openings for data scientists worldwide, making India the next data science hub after the US. This striking revelation comes at a time when Indian IT sector job creation has hit a slow mode, thus flourishing data science job creation is found providing a silver lining. According to the report, Microsoft, JPMorgan, Deloitte, Accenture, EY, Flipkart, Adobe, AIG, Wipro and Vodafone are some of the top of the line companies which hired the highest number of data scientists this year. Besides data scientists, they also advertised openings for analytics managers, analytics consultants and data analysts among others.

City Stats

After blue chip companies, talking about Indian cities which accounts for the most number of data scientists – we found that Bengaluru leads the show with highest number of data analytics and science related jobs accounting for almost 27% of the total share. In fact, the statistics has further increased from the last year’s 25%, followed by Delhi NCR and Mumbai. Even, owing to an increase in the number of start-ups, 14% of job openings were posted from Tier-II cities.

Notable Sectors

A large chunk of data science jobs originated from the banking and financial sector – 41% of job generation was from banking sector. Other industries that followed the suit are Energy & Utilities and Pharmaceutical and Healthcare; both of which have observed significant increase in job creation over the last year.

Get hands on training on data science from DexLab Analytics, the promising big data hadoop institute in Delhi.

2

Talent Supply Index (TSI) – Insights

Another study – Talent Supply Index (TSI) by Belong suggested that the demand in jobs is a result of data science being employed in some areas or the other across industries with burgeoning online presence, evident in the form of targeted advertising, product recommendation and demand forecasts. Interestingly, businesses sit on a massive pile of information collected over years in forms of partners, customers and internal data. Analyzing such massive volumes of data is the key.

Shedding further light on the matter, Rishabh Kaul, Co-Founder, Belong shared, “If the TSI 2017 data proved that we are in a candidate-driven market, the 2018 numbers should be a wakeup call for talent acquisition to adopt data-driven and a candidate-first approach to attract the best talent. If digital transformation is forcing businesses to adapt and innovate, it’s imperative for talent acquisition to reinvent itself too.”

Significantly, skill-based recruitment is garnering a lot of attention of the recruiters, instead of technology and tool-based training. The demand for Python skill is the highest scoring 39% of all posted data science and analytical jobs. In the second position is R skill with 25%.

Last Notes

The analytics job landscape in India is changing drastically. Companies are constantly seeking worthy candidates who are well-versed in particular fields of study, such as data science, big data, artificial intelligence, predictive analytics and machine learning. In this regard, this year, DexLab Analytics launches its ultimate admission drive for prospective students – #BigDataIngestion. Get amazing discounts on Big Data Hadoop training in Gurgaon and promote an intensive data culture among the student fraternity.

For more information – go to their official website now.


Interested in a career in Data Analyst?

To learn more about Data Analyst with Advanced excel course – Enrol Now.
To learn more about Data Analyst with R Course – Enrol Now.
To learn more about Big Data Course – Enrol Now.

To learn more about Machine Learning Using Python and Spark – Enrol Now.
To learn more about Data Analyst with SAS Course – Enrol Now.
To learn more about Data Analyst with Apache Spark Course – Enrol Now.
To learn more about Data Analyst with Market Risk Analytics and Modelling Course – Enrol Now.

The Power of Data: How the Industry Has Changed After Adding Data

The volume of data is expanding at an enormous rate, each day. No more are 1s and 0s are petty numerical digits, they are now a whole new phenomenon – known as Big Data. A fair assessment of the term helped us understand the massive volume of corporate data collected from a broad spectrum of sources is what big data is all about.

A recent report suggested that organizations are expected to enhance their annual revenues by an average of $5.2 million – thanks to big data.

More about Data, Rather Big Data

Back in the day, most of the company information used to be stored in written formats, like on paper. For example, if 80% of confidential information was kept on paper, 20% was stored electronically. Now, out of that 20%, 80% was kept in databases.

With time, things have changed. Across the business domain, more than 80% of companies store their data in electronic formats nowadays, and at least 80% of that is found outside databases, because most organizations prefer storing data in ad hoc basis in files at random places.

2

Now, the question is what kind of data is of crucial importance? Data, that impacts the most?

With that in mind, we’ve three kinds of data:

  • Customer Data
  • IT Data
  • Internal Financial Data

The Value of Data

For companies, data means dollars – the way data costs companies’ their time and resources, it also leads to increased revenue generation. However, the key factor to be noted here is – the data have to be RELEVANT. Despite potential higher revenues through advanced data skills and technology implementation, an average enterprise is only able to employ 51% of total accumulated and generated data, and less than 48% of decisions are based on that.

To say the least, unlike before, today’s organizations gather data from a wide array of sources – CCTV footage, video-audio files, social networking data, health metrics, blogs, web traffic logs and sensor feeds – previously companies were not as efficient and tech-savvy as they are now. In fact, five years ago, some of the sources from which data is accumulated did not even exist nor were they available on corporate radar.

With the rise of ingenious and connected technologies, companies are turning digital. It hardly matters if you are an automobile manufacturer, fashion collaborator or into digital marketing – being connected digitally and owning meaningful data is all to cash on. You can structure intricate database just with consumers’ details, both personal and professional, such as age, gender, interests, buying patterns, behavioral statistics and habits. Remember, accumulating and analyzing data is not only productive for your company but also becomes a saleable service in its own way.

Make Data the Bedrock of Your Business

Data has to be the life and blood of business plans and decisions you want to make. Ensure your employees learn about the value of data collection, make sure you align your IT resources properly and keep pace with the latest data tools and technologies as they tend to keep on changing, constantly.

Embrace the change – while physical assets are losing importance, data appears to be the most valuable asset a company can ever have.

For big data hadoop certification in gurgaon, look no further than DexLab Analytics. With the right skills in tow and adequate years of experience, this analytics training institute is the toast of the town. For more information, visit our official page. 


The blog has been sourced from:

https://www.digitaldoughnut.com/articles/2016/april/data-may-be-the-most-valuable-asset-your-company-h

https://www.techrepublic.com/blog/cio-insights/big-data-cheat-sheet/

https://www.techrepublic.com/article/the-3-most-important-types-of-data-for-your-business


Interested in a career in Data Analyst?

To learn more about Data Analyst with Advanced excel course – Enrol Now.
To learn more about Data Analyst with R Course – Enrol Now.
To learn more about Big Data Course – Enrol Now.

To learn more about Machine Learning Using Python and Spark – Enrol Now.
To learn more about Data Analyst with SAS Course – Enrol Now.
To learn more about Data Analyst with Apache Spark Course – Enrol Now.
To learn more about Data Analyst with Market Risk Analytics and Modelling Course – Enrol Now.

Analytics of Things is Transforming the Way Businesses Run

Analytics of Things is Transforming the Way Businesses Run

As Internet of Things (IoT) invades every aspect of our lives, big data analytics is likely to be utilized for many more things other than solving business problems. This growing popularity of big data analytics, which is altering the way businesses run, has given birth to a new term- ‘ Analytics of Things’.

Much before big data was identified as the most valuable asset for businesses, enterprises had expressed need for a system that could handle an ‘information explosion’. In 2006, an open source distributed storage and processing system was developed. This system called Hadoop spread across commodity hardware and encouraged the nurturing of many more open source projects that would target different aspects of data and analytics.

Growth of Hadoop:

The primary objective with which Hadoop was developed was storing large volumes of data in a cost effective manner. Enterprises were clueless how to handle their ever increasing volumes of data. So, the first requirement was to dump all that data in a data lake and figure out the use cases gradually. Initially, there used to be a standard set of open source tools for managing data and the data architecture lacked variety.

Prior to adopting big data, companies managed their reporting systems through data warehouses and different types of data management tools. The telecom and banking industry were among the first to step into big data. Over time, some of them completely shifted their reporting work to Hadoop.

2

Evolution of big data architecture:

Big data tools have witnessed drastic evolution. This encouraged enterprises to employ a new range of use cases on big data using the power of real-time processing hubs. This includes fraud detection, supply chain optimization and digital marketing automation among other things. Since Hadoop’s birth in 2006, big data has developed a lot. Some of these developments include intelligent automation and real-time analytics.

To keep up with the demands for better big data architecture, real-time analytics was incorporated in Hadoop and its speed was also improved. Different cloud vendors developed Platform as a Service (PaaS) component and this development was a strong driving force behind big data architectures becoming more diverse.

As companies further explored ways to extract more meaning from their data, it led to the emergence of two major trends: Analytics as a service (AaaS) and data monetization.

AaaS platforms provided a lot of domain experience and hence gave generic PaaS platforms a lot more context. This development made big data architecture more compact.

Another important development came with data monetization. Some sectors, like healthcare and governance, depend heavily on data collected through a range of remote IoT devices. To make these processes speedier and reduce network load, localized processing was needed and this led to the emergence of ‘edge analytics’. Now, there is good sync between edge and centralized platforms, which in turn enhances the processes of data exchange and analysis.

The above mentioned developments show how much big data has evolved and that currently a high level of fine-tuning is possible in its architecture.

Often enterprises struggle with successful implementation of big data. The first step is to define your big data strategy. Instead of going for full blown implementation, undertake shorter implementation cycles.

It is highly likely that our future will become completely driven by big data and ground-breaking innovations like automated analysts and intelligent chatbots. Don’t be left behind. Enroll for big data Hadoop certification courses and take full advantage of the power big data holds in today’s world of work. The big data Hadoop training in Gurgaon ensures that every student becomes proficient enough to face real challenges in the industry. Enroll now and get flat 10% discount on all big data certification courses.


Reference: www.livemint.com/AI/bRwVnGBm6hH78SoUIccomL/Big-Data-Analytics-of-Things-upend-the-way-biz-gets-done.html


Interested in a career in Data Analyst?

To learn more about Data Analyst with Advanced excel course – Enrol Now.
To learn more about Data Analyst with R Course – Enrol Now.
To learn more about Big Data Course – Enrol Now.

To learn more about Machine Learning Using Python and Spark – Enrol Now.
To learn more about Data Analyst with SAS Course – Enrol Now.
To learn more about Data Analyst with Apache Spark Course – Enrol Now.
To learn more about Data Analyst with Market Risk Analytics and Modelling Course – Enrol Now.

Call us to know more