Big Data Programming Language Archives - Page 2 of 3 - DexLab Analytics | Big Data Hadoop SAS R Analytics Predictive Modeling & Excel VBA

Step-by-step Guide for Implementation of Hierarchical Clustering in R

Step-by-step Guide for Implementation of Hierarchical Clustering in R

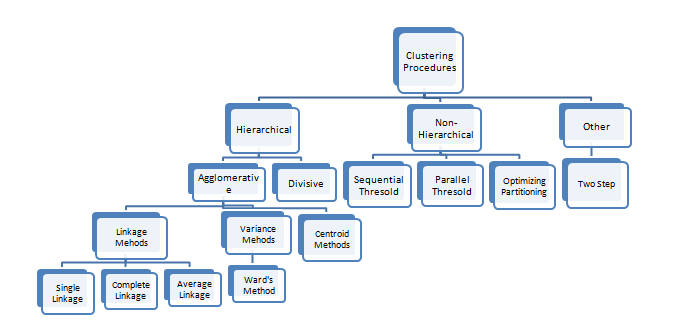
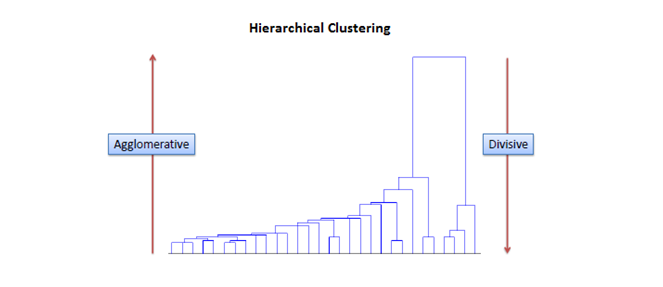
Hierarchical clustering is a method of clustering that is used for classifying groups in a dataset. It doesn’t require prior specification of the number of clusters that needs to be generated. This cluster analysis method involves a set of algorithms that build dendograms, which are tree-like structures used to demonstrate the arrangement of clusters created by hierarchical clustering.

It is important to find the optimal number of clusters for representing the data. If the number of clusters chosen is too large or too small, then the precision in partitioning the data into clusters is low.

NbClust

The R package NbClust has been developed to help with this. It offers good clustering schemes to the user and provides 30 indices for determining the number of clusters.

Through NbClust, any combination of validation indices and clustering methods can be requested in a single function call. This enables the user to simultaneously evaluate several clustering schemes while varying the number of clusters.

One such index used for getting optimum number of clusters is Hubert Index.

2

Performing Hierarchical Clustering in R

In this blog, we shall be performing hierarchical clustering using the dataset for milk. The flexclust package is used to extract this dataset.

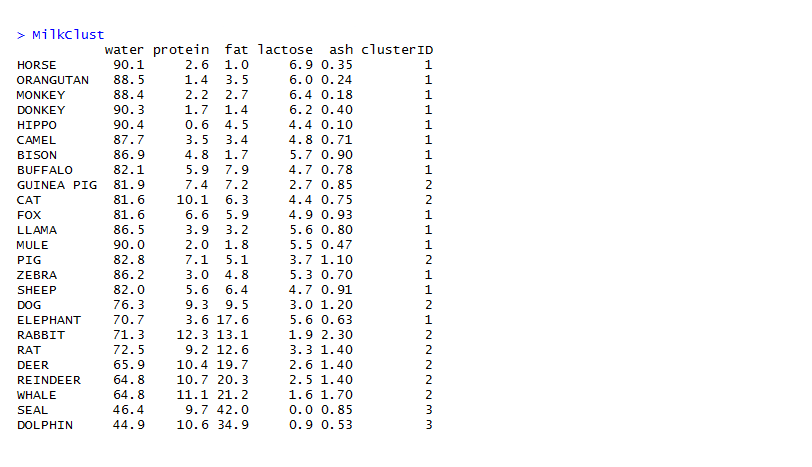
The milk dataset contains observations and parameters as shown below:

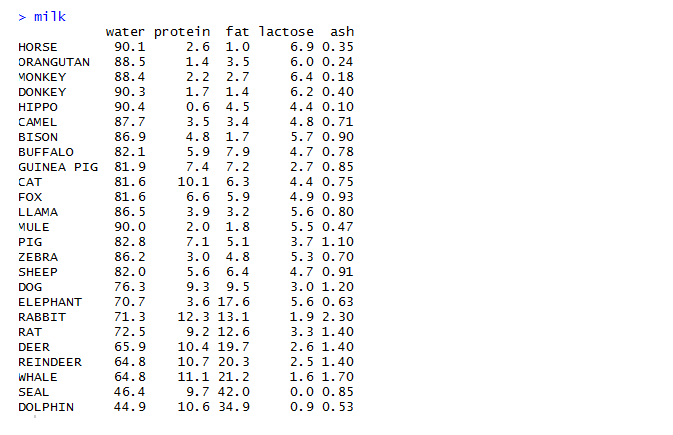
As seen in the dataset, milk obtained from various animal sources and their respective proportions of water, protein, fat, lactose and ash have been mentioned.

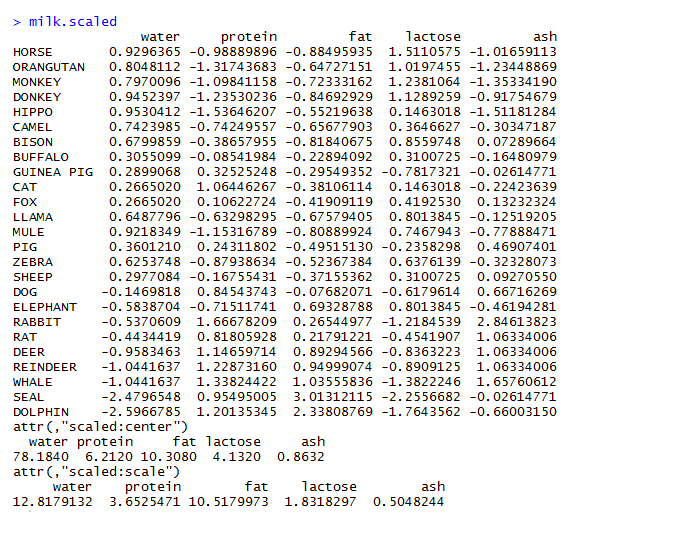
For making calculations easier, we scale down original values into a standard normalized form. For that, we use processes like centering and scaling. The variable may be scaled in the following ways:

Subtract mean from each value (centering) and then divide it by standard deviation or divide it by its mean deviation about mean (scaling)

Divide each value in the variable by maximum value of the variable

After scaling the variables we get the following matrix

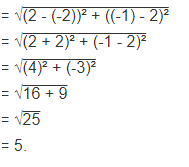
The next step is to calculate the Euclidean distance between different data points and store the result in a variable.

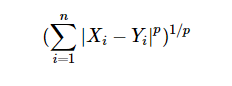
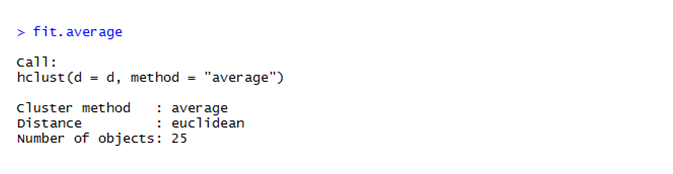
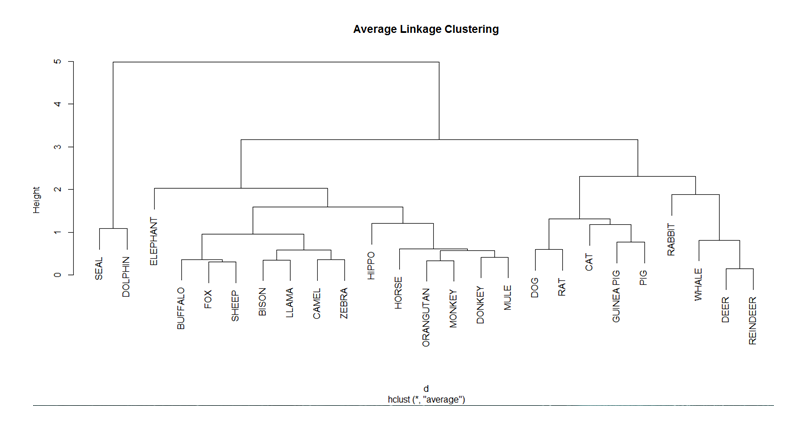
Hierarchical average linkage method is used for performing clustering of different animal sources. The formula used for that is shown below.

We obtain 25 clusters from the dataset.

To draw the dendogram we use the plot command and we obtain the figure given below.


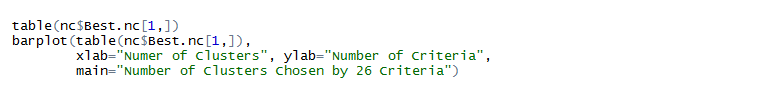
The Nbclust library is used to get the optimum number of clusters for partitioning the data. The maximum and minimum number of clusters that is needed is stored in a variable. The nbClust method finds out the optimum number of clusters according to different clustering indices and finally the Hubert Index decides the optimum value of the number of clusters.

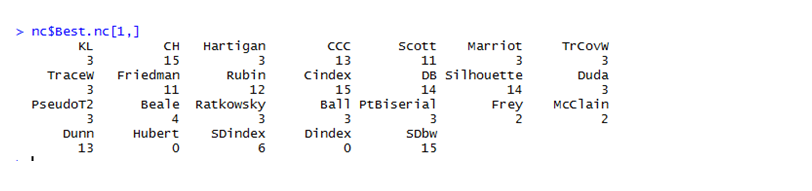
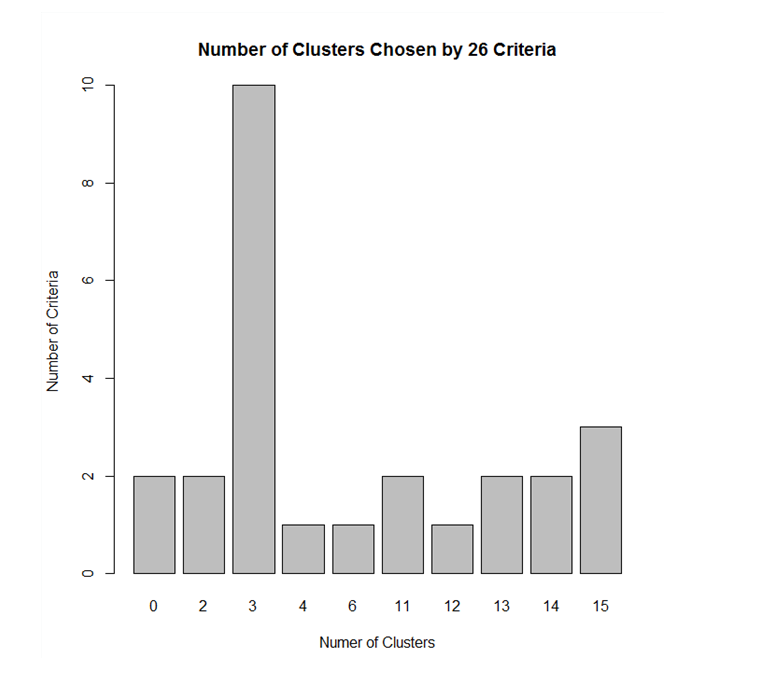
The optimum cluster value is 3, as can be seen in the figure below.

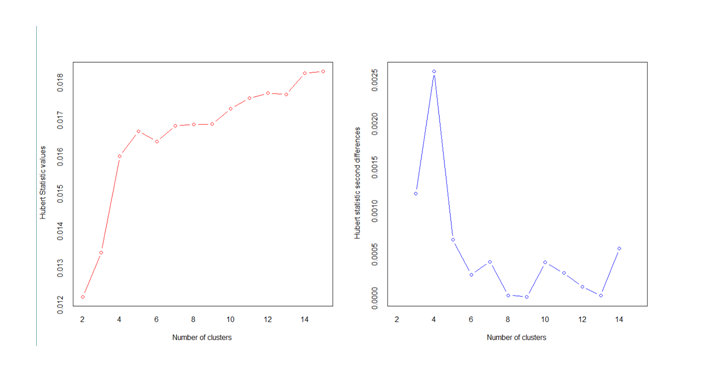
Values corresponding to knee jerk visuals in the graph give the number of clusters needed.

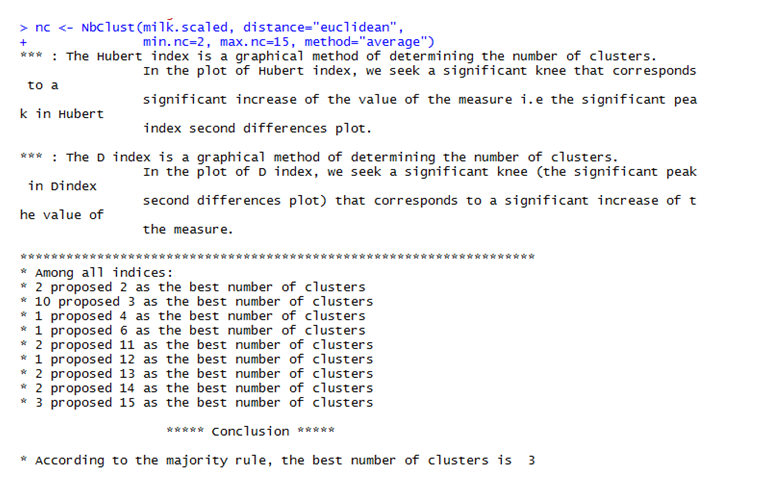
The graph shows that the maximum votes from various clustering indices went to cluster 3. Hence, the data is partitioned into 3 clusters.

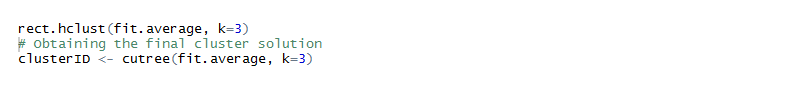
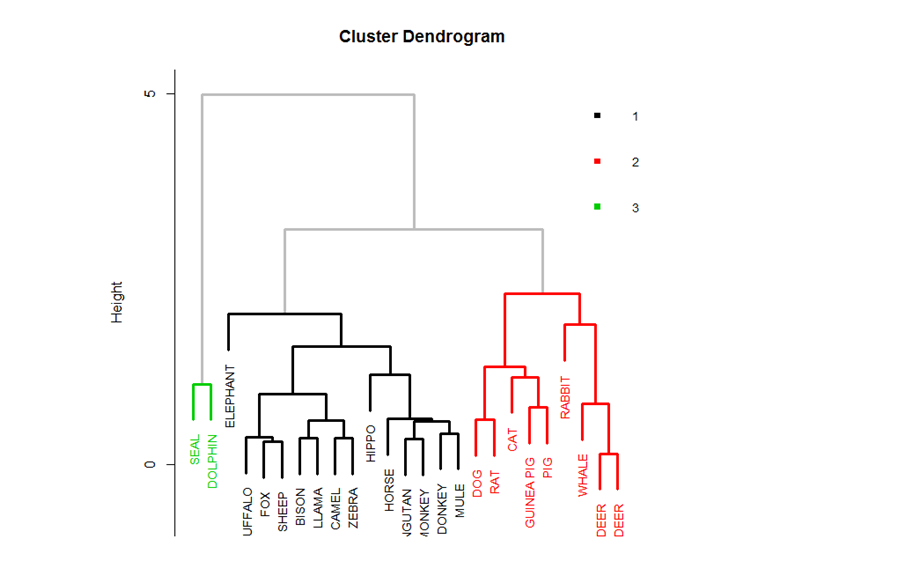
The graph is partitioned into 3 clusters as shown by the red lines.

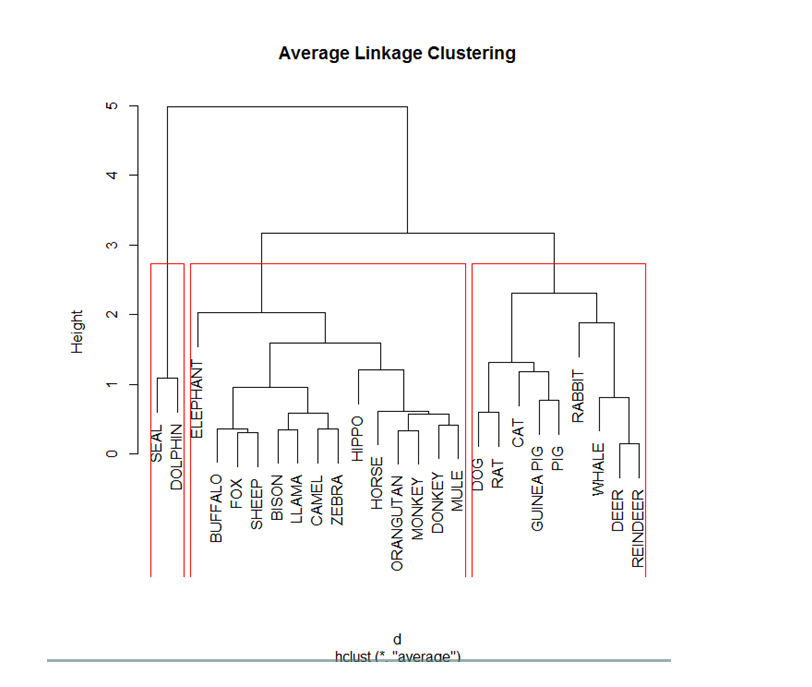
Now, the points are portioned into 3 clusters as opposed to the 25 clusters we got initially.

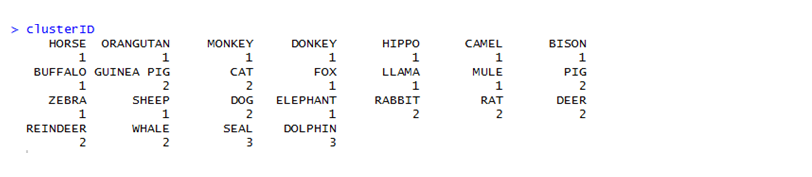
Next, the clusters are assigned to the observations.

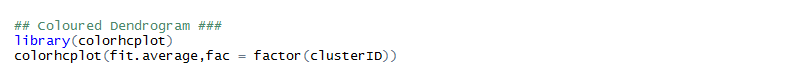
The clusters are assigned different colors for ease of visualization


That brings us to a close on the topic of Hierarchical clustering. In the upcoming blogs, we shall be discussing K-Means clustering. So, follow DexLab Analytics – a leading institute providing big data Hadoop training in Gurgaon. Enroll for their big data Hadoop courses and avail flat 10% discount. To more about this #SummerSpecial offer, visit our website.


Interested in a career in Data Analyst?

To learn more about Data Analyst with Advanced excel course – Enrol Now.
To learn more about Data Analyst with R Course – Enrol Now.
To learn more about Big Data Course – Enrol Now.

To learn more about Machine Learning Using Python and Spark – Enrol Now.
To learn more about Data Analyst with SAS Course – Enrol Now.
To learn more about Data Analyst with Apache Spark Course – Enrol Now.
To learn more about Data Analyst with Market Risk Analytics and Modelling Course – Enrol Now.

Industry Use Cases of Big Data Hadoop Using Python – Explained

Industry Use Cases of Big Data Hadoop Using Python – Explained

Welcome to the BIG world of Big Data Hadoop – the encompassing eco-system of all open-source projects and procedures that constructs a formidable framework to manage data. Put simply, Hadoop is the bedrock of big data operations. Though the entire framework is written in Java language, it doesn’t exclude other programming languages, such as Python and C++ from being used to code intricate distributed storage and processing framework. Besides Java architects, Python-skilled data scientists can also work on Hadoop framework, write programs and perform analysis. Easily, programs can be written in Python language without the need to translate them into Java jar files.

Python as a programming language is simple, easy to understand and flexible. It is capable and powerful enough to run end-to-end advanced analytical applications. Not to mention, Python is a versatile language and here we present a few popular Python frameworks in sync with Hadoop:


  • Hadoop Streaming API
  • Dumbo
  • Mrjob
  • Pydoop
  • Hadoopy


Now, let’s take a look at how some of the top notch global companies are using Hadoop in association with Python and are bearing fruits!

Amazon

Based on the consumer research and buying pattern, Amazon recommends suitable products to the existing users. This is done by a robust machine learning engine powered by Python, which seamlessly interacts with Hadoop ecosystem, aiding in delivering top of the line product recommendation system and boosting fault tolerant database interactions.

Facebook

In the domain of image processing, Facebook is second to none. Each day, Facebook processes millions and millions of images based on unstructured data – for that Facebook had to enable HDFS; it helps store and extract enormous volumes of data, while using Python as the backend language to perform a large chunk of its Image Processing applications, including Facial Image Extraction, Image Resizing, etc.

Rightfully so, Facebook relies on Python for all its image related applications and simulates Hadoop Streaming API for better accessibility and editing of data.

Quora Search Algorithm

Quora’s backend is constructed on Python; hence it’s the language used for interaction with HDFS. Also, Quora needs to manage vast amounts of textual data, thanks to Hadoop, Apache Spark and a few other data-warehousing technologies! Quora uses the power of Hadoop coupled with Python to drag out questions from searches or for suggestions.

2

End Notes

The use of Python is varied; being dynamically typed, portable, extendable and scalable, Python has become a popular choice for big data analysts specializing in Hadoop. Mentioned below are a couple of other notable industries where use cases of Hadoop using Python are to be found:


  • YouTube uses a recommendation engine built using Python and Apache Spark.
  • Limeroad functions on an integrated Hadoop, Apache Spark and Python recommendation system to retain online visitors through a proper, well-devised search pattern.
  • Iconic animation companies, like Disney depend on Python and Hadoop; they help manage frameworks for image processing and CGI rendering.


Now, you need to start thinking about arming yourself with big data hadoop certification course – these big data courses are quite in demand now – as it’s expected that the big data and business analytics market will increase from $130.1 billion to more than $203 billion by 2020.


This article first appeared on – www.analytixlabs.co.in/blog/2016/06/13/why-companies-are-using-hadoop-with-python


Interested in a career in Data Analyst?

To learn more about Data Analyst with Advanced excel course – Enrol Now.
To learn more about Data Analyst with R Course – Enrol Now.
To learn more about Big Data Course – Enrol Now.

To learn more about Machine Learning Using Python and Spark – Enrol Now.
To learn more about Data Analyst with SAS Course – Enrol Now.
To learn more about Data Analyst with Apache Spark Course – Enrol Now.
To learn more about Data Analyst with Market Risk Analytics and Modelling Course – Enrol Now.

Why Portability is Gaining Momentum in the Field of Data

Why Portability is Gaining Momentum in the Field of Data

Ease and portability are of prime importance to businesses. Companies want to handle data in real-time; so there’s need for quick and smooth access to data. Accessibility is often the deciding factor that determines if a business will be ahead or behind in competition.

Data portability is a concept that is aimed at protecting users by making data available in a structured, machine-readable and interoperable format. It enables users to move their data from one controller to another. Organizations are required to follow common technical standards to assist transfer of data instead of storing data in ‘’walled gardens’’ that renders the data incompatible with other platforms.

Now, let’s look a little closer into why portability is so important.

Advantages:

Making data portable gives consumers the power to access data across multiple channels and platforms. It improves data transparency as individuals can look up and analyze relevant data from different companies. It will also help people to exercise their data rights and find out what information organizations are holding. Individuals will be able to make better queries.

From keeping a track of travel distance to monitoring energy consumption on the move, portable data is able to connect with various activities and is excellent for performing analytical examinations on. Portable data may be used by businesses to map consumers better and help them make better decisions, all the while collecting data very transparently. Thus, it improves data personalization.

For example, the portable data relating to a consumers grocery purchases in the past can be utilized by a grocery store to provide useful sales offers and recipes. Portable data can help doctors find quick information about a patient’s medical history- blood group, diet, regular activities and habits, etc., which will benefit the treatment. Hence, data portability can enhance our lifestyle in many ways.

Struggles:

Portable data presents a plethora of benefits for users in terms of data transparency and consumer satisfaction. However, it does have its own set of limitations too. The downside of greater transparency is security issues. It permits third parties to regularly access password protected sites and request login details from users. Scary as it may sound; people who use the same password for multiple sites are easy targets for hackers and identity thieves. They can easily access the entire digital activity of such users.

Although GDPR stipulates that data should be in a common format, that alone doesn’t secure standardization across all platforms. For example, one business may name a domain ‘’Location” while another business might call the same field ‘’Locale”.  In such cases, if the data needs to be aligned with other data sources, it has to be done manually.

According to GDPR rules, if an organization receives a request pertaining to data portability, then it has to respond within one month. While they might be willing to readily give out data to general consumers, they might hold off the same information if they perceive the request as competition.

2

Future:

Data portability runs the risk of placing unequal power in the hands of big companies who have the money power to automate data requests, set up an entire department to cater to portability requests and pay GDPR fines if needed.

Despite these issues, there are many positives. It can help track a patient’s medical statistics and provide valuable insights about the treatment; and encourage people to donate data for good causes, like research.

As businesses as well as consumers weigh the pros and cons of data portability, one thing is clear- it will be an important topic of discussion in the years to come.

Businesses consider data to be their most important asset. As the accumulation, access and analysis of data is gaining importance, the prospects for data professionals are also increasing. You must seize these lucrative career opportunities by enrolling for Big Data Hadoop certification courses in Gurgaon. We at Dexlab Analytics bring together years of industry experience, hands-on training and a comprehensive course structure to help you become industry-ready.

DexLab Analytics Presents #BigDataIngestion

Don’t miss the summer special course discounts on big data Hadoop training in Delhi. We are offering flat 10% discount to all interested students. Hurry!


Interested in a career in Data Analyst?

To learn more about Data Analyst with Advanced excel course – Enrol Now.
To learn more about Data Analyst with R Course – Enrol Now.
To learn more about Big Data Course – Enrol Now.

To learn more about Machine Learning Using Python and Spark – Enrol Now.
To learn more about Data Analyst with SAS Course – Enrol Now.
To learn more about Data Analyst with Apache Spark Course – Enrol Now.
To learn more about Data Analyst with Market Risk Analytics and Modelling Course – Enrol Now.

Transformation On-The-Go: See How Financial and Manufacturing Sectors are Harnessing Big Data Hadoop

big data hadoop course


An elderly man of 50 years of age was on the treadmill, when suddenly he received an alert on his Apple Watch showing his pulse has shot up abnormally high, putting him at the risk of a possible heart attack.  Immediately he got off from the treadmill and his life was saved!

Thanks to Pontem, an incredible platform that intakes input from Apple Watch and Fitbit and issues such consequential alerts wielding machine learning, cloud-based data and cognitive processing. From the point of view of a user, these alerts are life-saver, but for the developers, it implies the latest evolution of big data technology, especially Hadoop ecosystem. Once a mere data managing tool, Hadoop is maturing and making its way to the next level.

Today, Hadoop is the lifeblood of industry-specific solutions. But adopting it for your business is no mean feat. You need to have a specific approach in sync with the particular industry type.

Financial Sector & Manufacturing

After healthcare, financial and manufacturing industry is the biggest consumer of Hadoop technology. Besides, managing, storing and analyzing data, big data coupled with AI and machine learning helps understand the intricacies of credit risk more effectively.

Of late, credit risk management has been troubling financial services companies. Though the entire banking industry has matured, the constantly evolving nature of models has been a headache for traditional credit risk models. However, the expansiveness of big data and availability in multiple formats has helped companies ace in advanced credit risk models – which was next to impossible even a few years back.

With Big Data Hadoop, a large amount of customer data is available – including online browsing activity, user spending behavior and payment options, all of which helps banks and other financial institutions frame better decisions. Commendable Hadoop’s ability to manage and manipulate unstructured data is put to use for respective functions. Over the years, Hadoop has evolved to offer sound flexibility and massive scalability to manage big data. Incorporating AI and Machine Learning, the new sophisticated models based on Hadoop clusters breaks down big data into small, easy-to-comprehend chunks, while adapting to changing, innovative data patterns. In short, the management of big data has now become comparatively an easy task – using low cost hardware, self healing, self learning and internal fault tolerance attributes. No more, you feel like stuck in a cleft stick, while handling such a massive infrastructure of big data.


For manufacturing industry, predictive analytics is the key that’s bringing in large-scale digital transformation – internet connections and sensors are providing real-time data for better operations. Sensors have the ability to detect prior anomalies in the production process, thereby preventing production of defective items and curtail subsequent waste. Often, there is a deep learning or AI connect to the analytics layers existing on the top of Hadoop data lakes that offers suave data analytics and self-learning capabilities. It’s said, around 80% of manufacturers will implement cutting edge technology in the next few years. And the numbers are just increasing.

Hadoop is not like a magic potion. It’s a robust platform on which you can harness the data power. However, to master Hadoop technology, you need to have required knowledge and expertise as per the industry standards. DexLab Analytics is a well-recognized Big Data Hadoop institute in Noida. They offer an extensive range of courses on in-demand skills, including Big Data Hadoop training in Delhi.

Check out their latest admission drive #BigDataIngestion: students can avail 10%off on in-demand courses, like big data hadoop, data science, machine learning and business analytics. Limited offer. Hurry!

This blog has been sourced from: http://dataconomy.com/2018/05/hadoop-evolved-how-industries-are-being-transformed-by-big-data/

Interested in a career in Data Analyst?

To learn more about Data Analyst with Advanced excel course – Enrol Now.
To learn more about Data Analyst with R Course – Enrol Now.
To learn more about Big Data Course – Enrol Now.

To learn more about Machine Learning Using Python and Spark – Enrol Now.
To learn more about Data Analyst with SAS Course – Enrol Now.
To learn more about Data Analyst with Apache Spark Course – Enrol Now.
To learn more about Data Analyst with Market Risk Analytics and Modelling Course – Enrol Now.

A Comprehensive Guide on Clustering and Its Different Methods

A Comprehensive Guide on Clustering and Its Different Methods

Clustering is used to make sense of large volumes of data, structured or unstructured, by dividing the data into groups. The members of a group are ‘’similar’’ between them and ‘’dissimilar’’ to objects in other groups. The similarity is based on characteristics such as equal distances from a point or people who read the same genre of book. These groups with similar members are called clusters. The various methods of clustering, which we shall be discussing subsequently, help break up data into logical groupings before analyzing the data more deeply.

If a CEO of a company presents a broad question like- ‘’ Help me understand our customers better so that we can improve marketing strategies’’, then the first thing analysts need to do is use clustering methods to the classify customers. Clustering has plenty of application in our daily lives. Some of the domains where clustering is used are:

  • Marketing: Used to group customers having similar interests or showing identical behavior from large databases of customer data, which contain information on their past buying activities and properties.
  • Libraries: Used to organize books.
  • Biology: Used to classify flora and fauna based on their features.
  • Medical science: Used for the classification of various diseases.
  • City-planning: identifying and grouping houses based on house type, value and geographical location.
  • Earthquake studies: clustering existing earthquake epicenters to locate dangerous zones.

Clustering can be performed by various methods, as shown in the diagram below:

Fig 1

The two major techniques used to perform clustering are:

  • Hierarchical Clustering: Hierarchical clustering seeks to develop a hierarchy of clusters. The two main techniques used for hierarchical clustering are:
  1. Agglomerative: This is a ‘’bottom up’’ approach where first each observation is assigned a cluster of its own, then pairs of clusters are merged as one moves up the hierarchy. The process terminates when only a single cluster is left.
  2. Divisive: This is a ‘’top down’’ approach wherein all observations start in one cluster, and splits are performed recursively as one moves down the hierarchy. The process terminates when each observation has been assigned a separate cluster.

Fig 2: Agglomerative clustering follows a bottom-up approach while divisive clustering follows a top-down approach.

  • Partitional Clustering: In partitional clustering a set of observations is divided into non-overlapping subsets, such that each observation is in exactly one subset. The main partitional clustering method is K-Means Clustering.

The most popular metric used for forming clusters or deciding the closeness of clusters is distance. There are various distance measures. All observations are measured using one particular distance measure and the observation having the minimum distance from a cluster is assigned to it. The different distance measures are:

  • Euclidean Distance: This is the most common distance measure of all. It is given by the formula:

Distance((x, y), (a, b)) = √(x – a)² + (y – b)²

For example, the Euclidean distance between points (2, -1) and (-2, 2) is found to be

Distance((2, -1), (-2, 2)) 

  • Manhattan Distance:

This gives the distance between two points measured along axes at right angles. In a plane with p1 at (x1, y1) and p2 at (x2, y2), Manhattan distance is |x1 – x2| + |y1 – y2|.

  • Hamming Distance:

Hamming distance between two vectors is the number of bits we must change to convert one into the other. For example, to find the distance between vectors 01101010 and 11011011, we observe that they differ in 4 places. So, the Hamming distance d(01101010, 11011011) = 4

  • Minkowski Distance:

The Minkowski distance between two variables X and Y is defined as

The case where p = 1 is equivalent to the Manhattan distance and the case where p = 2 is equivalent to the Euclidean distance.

These distance measures are used to measure the closeness of clusters in hierarchical clustering.

In the next blogs, we will discuss the different methods of clustering in more details, so make sure you follow DexLab Analytics– we provide the best big data Hadoop certification in Gurgaon. Do check our data analyst courses in Gurgaon.


Interested in a career in Data Analyst?

To learn more about Data Analyst with Advanced excel course – Enrol Now.
To learn more about Data Analyst with R Course – Enrol Now.
To learn more about Big Data Course – Enrol Now.

To learn more about Machine Learning Using Python and Spark – Enrol Now.
To learn more about Data Analyst with SAS Course – Enrol Now.
To learn more about Data Analyst with Apache Spark Course – Enrol Now.
To learn more about Data Analyst with Market Risk Analytics and Modelling Course – Enrol Now.

Big Data Could Solve Drug Overdose Mini Epidemic

Big Data Could Solve Drug Overdose Mini Epidemic

Big data has become an essential part of our everyday living. It’s altering the very ways we collect and process data.

Typically, big data in identifying at-risk groups also shows signs of considerable growth; the reasons being easy availability of data and superior computational power.

The issue of overprescribing of opioids is serious, and over 63000 people has died in the United States last year from drug overdose, out of which more than 75% of deaths occurred due to opioids. Topping that, there are over 2million people in the US alone, diagnosed with opioid use disorder.

But of course, thanks to Big Data: it can help physicians take informed decisions about prescribing opioid to patients by understanding their true characteristics, what makes them vulnerable towards chronic opioid-use disorder. A team from the University of Colorado accentuates how this methodology helps hospitals ascertain which patients incline towards chronic opioid therapy after discharge.

For big data training in Gurgaon, choose DexLab Analytics.

Big Data offers helps

The researchers at Denver Health Medical Center developed a prediction model based on their electronic medical records to identify which hospitalized patients ran the risk of progressing towards chronic opioid use after are discharged from the hospital. The electronic data in the record aids the team in identifying the number of variables linked to the advancement to COT (Chronic Opioid Therapy); for example, a patient’s history of substance abuse is exposed.

As good news, the model was successful in predicting COT in 79% of patients and no COT in 78% of patients. No wonder, the team claims that their work is a trailblazer for curbing COT risk, and scores better than software like Opioid Risk Tool (ORT), which according to them is not suitable for hospital setting.

Therefore, the prediction model is to be incorporated into electronic health record and activated when a healthcare specialist orders opioid medication. It would help the physician decipher the patient’s risk for developing COT and alter ongoing prescribing practices.

“Our goal is to manage pain in hospitalized patients, but also to better utilize effective non-opioid medications for pain control,” the researchers stated. “Ultimately, we hope to reduce the morbidity and mortality associated with long-term opioid use.”

As parting thoughts, the team thinks it would be relatively cheaper to implement this model and of great support for the doctors are always on the go. What’s more, there are no extra requirements on the part of physicians, as data is already available in the system. However, the team needs to test the cutting edge system a number of times in other health care platforms to determine if it works for a diverse range of patient populations.

On that note, we would like to say DexLab Analytics offers SAS certification for predictive modeling. We understand how important the concept of predictive analytics has become, and accordingly we have curated our course itinerary.


The blog has first appeared on – https://dzone.com/articles/using-big-data-to-reduce-drug-overdoses


Interested in a career in Data Analyst?

To learn more about Data Analyst with Advanced excel course – Enrol Now.
To learn more about Data Analyst with R Course – Enrol Now.
To learn more about Big Data Course – Enrol Now.

To learn more about Machine Learning Using Python and Spark – Enrol Now.
To learn more about Data Analyst with SAS Course – Enrol Now.
To learn more about Data Analyst with Apache Spark Course – Enrol Now.
To learn more about Data Analyst with Market Risk Analytics and Modelling Course – Enrol Now.

10 Key Areas to Focus When Settling For an Alternative Data Vendor

10 Key Areas to Focus When Settling For an Alternative Data Vendor

Unstructured data is the new talk of the town! More than 80% of the world’s data is in this form, and big wigs of financial world need to confront the challenges of administering such volumes of unstructured data through in-house data consultants.

FYI, deriving insights from unstructured data is an extremely tiresome and expensive process. Most buy-sides don’t have access to these types of data, hence big data vendors are the only resort. They are the ones who transform unstructured content into tradable market data.

Here, we’ve narrowed down 10 key areas to focus while seeking an alternative data vendor.

Structured data

Banks and hedge funds should seek alternative data vendors that can efficiently process unstructured data into 100% machine readable structured format – irrespective of data form.

Derive a fuller history

Most of the alternative data providers are new kid in the block, thus have no formidable base of storing data. This makes accurate back-testing difficult.

Data debacles

The science of alternative data is punctured with a lot of loopholes. Sometimes, the vendor fails to store data at the time of generation – and that becomes an issue. Transparency is very crucial to deal with data integrity issues so as to nudge consumers to come at informed conclusions about which part of data to use and not to use.

Context is crucial

While you look at unstructured content, like text, the NLP or natural language processing engine must be used to decode financial terminologies. As a result, vendors should create their own dictionary for industry related definitions.

Version control

Each day, technology gets better or the production processes change; hence vendors must practice version control on their processes. Otherwise, future results will be surely different from back-testing performance.

Let’s Take Your Data Dreams to the Next Level

Point-in-time sensitivity

This generally means that your analysis includes data that is downright relevant and available at particular periods of time. In other cases, there exists a higher chance for advance bias being added in your results.

Relate data to tradable securities

Most of the alternative data don’t include financial securities in its scope. The users need to figure out how to relate this information with a tradable security, such as bonds and stocks.

Innovative and competitive

AI and alternative data analytics are dramatically changing. A lot of competition between companies urges them to stay up-to-date and innovative. In order to do so, some data vendors have pooled in a dedicated team of data scientists.

Data has to be legal

It’s very important for both vendors and clients to know from where data is coming, and what exactly is its source to ensure it don’t violate any laws.

Research matters

Few vendors have very less or no research establishing the value of their data. In consequence, the vendor ends up burdening the customer to carry out early stage research from their part.

In a nutshell, alternative data in finance refer to data sets that are obtained to inject insight into the investment process. Most hedge fund managers and deft investment professionals employ these data to derive timely insights fueling investment opportunities.

Big data is a major chunk of alternative data sets. Now, if you want to arm yourself with a good big data hadoop certification in Gurgaon then walk into DexLab Analytics. They are the best analytics training institute in India.

The article has been sourced from – http://dataconomy.com/2018/03/ten-tips-for-avoiding-an-alternative-data-hangover


Interested in a career in Data Analyst?

To learn more about Machine Learning Using Python and Spark – click here.

To learn more about Data Analyst with Advanced excel course – click here.
To learn more about Data Analyst with SAS Course – click here.
To learn more about Data Analyst with R Course – click here.
To learn more about Big Data Course – click here.

R Programming, Python or Scala: Which is the Best Big Data Programming Language?

R Programming, Python or Scala: Which is the Best Big Data Programming Language?

For data science and big data, R, Python and Scala are the 3 most important languages to master. It’s a widely-known notion, organizations of varying sizes relies on massive structured and unstructured data to predict trends, patterns and correlations. They are of expectation that such a robust analysis will lead to better business decisions and individual behavior predictions.

In 2017, the adoption of Big Data analytics has spiked up to 53% in companies – says Forbes.

The story of evolution

To start with, big data is just data, after all. The entire game-play depends on its analysis – how well the data is analyzed so as to churn out valuable business intelligence. With years, data burgeoned, and it’s still expanding. The evolution of big data mostly happened because traditional database structures couldn’t cope with such multiplying data – scaling data became an important issue.

For that, here we have some popular big data programming languages. Dive down:

R Programming

R Programming is mainly used for statistical analysis. A set of packages are available for R named Programming with Big Data in R (pbdR), which encourages big data analysis, across multiple systems via R code.

R is robust and flexible; it can be run on almost every OS. To top that, it boasts of excellent graphical capabilities, which comes handy when trying to visualize models, patterns and associations within big data structures.

According to industry standards, the average pay of R Programmers is $115,531 per year.

For R language training, drop by DexLab Analytics.

Python

Compared to R, Python is more of a general-purpose programming language. Developers adore it, because it’s easy to learn, a huge number of tutorials are available online and is perfect for data analysis, which requires integration with web applications.

Python gives excellent performance and high scalability for a series of complicated data science tasks. It is used with high-in-function big data engines, like Apache Spark through available Python APIs.

Their Machine Learning Using Python courses are of highest quality and extremely student-friendly.

Let’s Take Your Data Dreams to the Next Level

Scala

Last but not the least, Scala is a general-purpose programming language developed mainly to address some of the challenges of Java language. It is used to write Apache Spark cluster computing solution. Hence, Scala has been a popular programming language in the field of data science and big data analysis, in particular.

There was a time when Scala was mandatory to work on Spark, but with the proliferation of many API endpoints approachable with other languages, this problem has been addressed. Nevertheless, it’s still the most significant and popular language for several big data tools, including Finagle. Also Scala houses amazing concurrency support, which parallelizes a whole many processes for huge data sets.

The average annual salary for a data scientist with Scala skills is $102,980.

In the end, you can never go wrong with selecting any one of the big data programming languages. All of them are equally good, productive and easy to excel on. However, Python is probably the best one to start off with.

For more updates or information on big data courses, visit DexLab Analytics.

The original article is here at – http://www.i-programmer.info/news/197-data-mining/11622-top-3-languages-for-big-data-programming.html


Interested in a career in Data Analyst?

To learn more about Machine Learning Using Python and Spark – click here.

To learn more about Data Analyst with Advanced excel course – click here.
To learn more about Data Analyst with SAS Course – click here.
To learn more about Data Analyst with R Course – click here.
To learn more about Big Data Course – click here.

Sure shot Ways to Crack Big Data Interviews

Sure shot Ways to Crack Big Data Interviews

If you are a Big Data analyst looking for open position in the entry to mid level range of experience then you should prepare yourself with the following resources in your arsenal before you storm an interview with all guns blazing.

  • Adequate Expertise of Analytical tools like SAS for the processing of data

Make sure that you assign most of the time you have set aside for the preparation of your upcoming interview to brush up your knowledge regarding the tools of analytics that are relevant in your context. Ensure that you acquire proficiency in the analytics tool of your choice. For positions of junior levels the importance of expertise with a particular analytical tool like Hadoop, R or SAS cannot be overstressed. In such circumstances the focus centers around data preparation and processing. It is highly advisable that you review concepts related to the import and manipulation of data, the ability to read data even if it not standard say for example data whose input file types are multiple in number and mixed data formats. You also get to show off your skills at efficiently joining multiple datasets, selecting conditionally the observations or rows of data, how to go about heavy duty data processing of which SQL or macros are the most critical.

  • Make a Proper Review of End to End Business Process

This is most relevant towards candidates who have prior experience at working in the Big Data and Analytics industry. Prior experience inevitably gives rise to interviewers wanting to know more about the responsibilities that you shouldered and your role in the business process and how you fitted in the context of the broader picture. You should be able to convey to the interviewer that the data source is understood by you along with its processing and use.

  • A solid concept of the rudiments of statistics and algorithms

Again this tip is also for those with prior experience. Recruiters seek to know whether you are aware of issues likely to be faced by you while you confront problems regarding data and business. Even freshers are expected to know the fundamental concepts of statistics like rejection criteria, hypothesis testing outcomes, measures of model validation and the statistics related assumptions that a candidate must know about in order to implement algorithms of various sorts. In order to crack the interview you must be prepared with adequate knowledge of concepts related to statistics.

  • Prepare Yourself with At Least 2 Case Studies related to Business

The person on the other side of the interview table will undoubtedly try to make an assessment about your knowledge as far as business analytics is concerned and not solely to the proficiency you command in your tool of choice. Devote time to review projects on analytics you already have worked on if you have prior experience. Be prepared to elucidate on the business problem, the steps that were involved in the processing of data and the algorithm put into use in the creations of the models and reasons behind, and the way the results of the model was implemented. The interviewer might also ask about the challenges faced by you at any stage of the whole process, so keep in mind the issues faced by you in the past and their eventual resolution.

2

  • Make Sure that Your Communication Remains Effective

If you are unable to effectively communicate then no much diligent preparations you make, they will be of no use. You can try out mock interviews and answering questions that the recruiter might ask. Spare yourself of the trouble of framing effective answers at the moment when the question is asked during an interview. Though you perhaps will be unable to anticipate each and every question, nevertheless but prior preparation will result in better and more coherent answers.


Interested in a career in Data Analyst?

To learn more about Data Analyst with Advanced excel course – Enrol Now.
To learn more about Data Analyst with R Course – Enrol Now.
To learn more about Big Data Course – Enrol Now.

To learn more about Machine Learning Using Python and Spark – Enrol Now.
To learn more about Data Analyst with SAS Course – Enrol Now.
To learn more about Data Analyst with Apache Spark Course – Enrol Now.
To learn more about Data Analyst with Market Risk Analytics and Modelling Course – Enrol Now.

Call us to know more