Big Data in India Archives - DexLab Analytics | Big Data Hadoop SAS R Analytics Predictive Modeling & Excel VBA

What Is The Role Of Big Data In The Pharmaceutical Industry?

What Is The Role Of Big Data In The Pharmaceutical Industry?

Big data is currently trending in almost all sectors as now the awareness of the hidden potential of data is on the rise. The pharmaceutical industry is a warehouse of valuable data that is constantly piling up for years and which if processed could unlock information that holds the key to the next level of innovation and help the industry save a significant amount of money in the process as well. Be it making the clinical trial process more efficient or, ensuring the safety of the patients, big data holds the clue to every issue bothering the industry. The industry has a big need for professionals who have Data science using Python training, because only they can handle the massive amount of data and channelize the information to steer the industry in the right direction.

We are here taking a look at different ways data is influencing the pharmaceutical industry.

Efficient clinical-trial procedure

Clinical trial holds so much importance as the effectiveness of a drug or, a procedure on a select group of patients is tested. The process involves many stages of testing and it could be time-consuming and not to mention the high level of risk factors involved in the process. The trials often go through delays that result in money loss and there is risk involved too as side effects of a specific drug or a component can be life-threatening. However, big data can help in so many ways here, to begin with, it could help filtering patients by analyzing several factors like genetics and select the ones who are eligible for the trials. Furthermore, the patients who are participating in clinical trials could also be monitored in real-time. Even the possible side effects could also be predicted and in turn, would save lives.

Successful sales and marketing efforts

The pharmaceutical industry can see a great difference in marketing efforts if only they use data-driven insight. Analyzing the data the companies could identify the locations and physicians ideal for the promotion of their new drug. They can also identify the needs of the patients and could target their sales representative teams towards that location. This would take the guesswork out of the process and increase the chance of getting a higher ROI. The data can also help them predict market trends as well as understand customer behavior. Another factor to consider here is monitoring the market response to a particular drug and also its performance, as this would help fine-tune marketing strategies.

Collaborative efforts

With the help of data, there could be better collaboration among the different segments that directly impact the industry. The companies could suggest different drugs that could be patient-specific and the physicians could use real-time patient data to decide whether the suggestions should be implemented in the treatment plan. There could be internal and external collaborations as well to improve the overall industry functioning. Be it reaching out to researchers or, CROs, establishing a strong link can help the industry move further.

Predictive analysis

A new drug might be effective in handling a particular health issue and could revolutionize the treatment procedure but, the presence of certain compounds might prove to be fatal for certain patients and drug toxicity if not detected at an early stage could endanger a particular patient. So, using predictive analysis a patient data could be analyzed to determine the genetic factors, disease history, as well as lifestyle. The smart algorithms thereby help identify the risk factors and makes it possible to take a personalized approach regarding medication that could prove to be more effective rather than some random medication.

Big data can increase the efficiency of the pharmaceutical industry in more ways than one, but compared to other industries somehow this industry still hasn’t been able to utilize the full potential of big data, due to factors like privacy and, monetary issues. The lack of trained professionals could also prove to be a big obstacle. Sending their select professionals for Data Science training, could prove to be a big boon for them in the future.


.

Big Data Analytics for Event Processing

Courtesy cloud and Internet of Things, big data is gaining prominence and recognition worldwide. Large chunks of data are being stored in robust platforms such as Hadoop. As a result, much-hyped data frameworks are clouted with ML-powered technologies to discover interesting patterns from the given datasets.

Defining Event Processing

In simple terms, event processing is a typical practice of tracking and analyzing a steady stream of data about events to derive relevant insights about the events taking place real time in the real world. However, the process is not as easy as it sounds; transforming the insights and patterns quickly into meaningful actions while hatching operational market data in real time is no mean feat. The whole process is known as ‘fast data approach’ and it works by embedding patterns, which are panned out from previous data analysis into the future transactions that take place real time.

2

Employing Analytics and ML Models

In some instances, it is crucial to analyze data that is still in motion. For that, the predictions must be proactive and must be determined in real-time. Random forests, logistic regression, k-means clustering and linear regression are some of the most common machine learning techniques used for prediction needs. Below, we’ve enlisted the analytical purposes for which the organizations are levering the power of predictive analytics:

Developing the Model – The companies ask the data scientists to construct a comprehensive predictive model and in the process can use different types of ML algorithms along with different approaches to fulfill the purpose.

Validating the Model – It is important to validate a model to check if it is working in the desired manner. At times, coordinating with new data inputs can give a tough time to the data scientists. After validation, the model has to further meet the improvement standards to deploy real-time event processing.

Top 4 Frameworks for ML in Event Processing

Apache Spark

Ideal for batch and streaming data, Apache Spark is an open-source parallel processing framework. It is simple, easy to use and is ideal for machine learning as it supports cluster-computing framework.

Hadoop

If you are looking for an open-source batch processing framework then Hadoop is the best you can get. It not only supports distributed processing of large scale data sets across different clusters of computers with a single programming model but also boasts of an incredibly versatile library.

Apache Storm

Apache Storm is a cutting edge open source, big data processing framework that supports real-time as well as distributed stream processing. It makes it fairly easy to steadily process unbounded streams of data working on real-time.

IBM Infosphere Streams

IBM Infosphere Streams is a highly-functional platform that facilitates the development and execution of applications that channels information in data streams. It also boosts the process of data analysis and improves the overall speed of business decision-making and insight drawing.

If you are interested in reading more such blogs, you must follow us at DexLab Analytics. We are the most reputed big data training center in Delhi NCR. In case, if you have any query regarding big data or Machine Learning using Python, feel free to reach us anytime.


Interested in a career in Data Analyst?

To learn more about Data Analyst with Advanced excel course – Enrol Now.
To learn more about Data Analyst with R Course – Enrol Now.
To learn more about Big Data Course – Enrol Now.

To learn more about Machine Learning Using Python and Spark – Enrol Now.
To learn more about Data Analyst with SAS Course – Enrol Now.
To learn more about Data Analyst with Apache Spark Course – Enrol Now.
To learn more about Data Analyst with Market Risk Analytics and Modelling Course – Enrol Now.

Cryptojacking: How Businesses Can Protect Systems from This Latest Cyber Threat

Cryptojacking: How Businesses Can Protect Systems from This Latest Cyber Threat

The rising threat of cyber attacks and the sophistication of these crimes have created a frightening security situation all over the world. The cases of data and privacy breach are increasing every day. Both private and public sector are at risk and understandably the average internet user is very paranoid. Cybercriminals keep innovating new ways to take advantage of security vulnerabilities present in systems.

Cryptojacking is one such cyber threat that has targeted countless unsuspected users all around the world. Particularly in India, cryptojacking has become a pressing problem. According to a recent study by Quick Heal Technologies, from January to May 2018, nearly 3 million cryptojacking cases have been reported.

2

What is Cryptojacking?

Cryptojacking is a method of hacking into systems and illegally using them to mine cryptocurrency. Malicious scripts are loaded into machines without the knowledge of owners. The group or individual that loads the malicious program reaps the rewards of cryptomining activities, while the owner of the machine isn’t provided any kind of compensation.

There are two types of processes used to carry out cryptojacking attacks:

In the first process, a cryptomining code is installed in the compromised system by means of an infected file.

In the second method, a website or online ad is infected with a JavaScript-based cryptomining script. When users click on this link, the scrip auto-executes itself.

Why is Cryptojacking So Challenging for Businesses?

The malicious script transmits processing power from the compromised machine to the unauthorized cryptocurrency mining. This affects the computer in the following ways:

  • Slows down the system
  • Causes the machine to lag
  • Some applications become completely inaccessible
  • Resource-intensive operations related to cryptomining damage the hardware of an infected system and at times even cause it to crash repeatedly.

Cryptojacking is a serious business hazard. These disruptions result in downtime and IT tickets, which basically cost the business a lot of money. Global businesses lose billions of dollars due to IT downtime. Infected systems consume huge amounts of electricity and hence the operational costs increase significantly. Bottom line, cryptojacking eats away business revenues, which if taken precautions may be avoided.

How to Protect from Cryptojacking Attacks?

The modern cyber-attack landscape evolves every minute. In the face of such dynamism, it is absolutely essential to adopt a multi-layered approach for preserving IT security. The need of the hour is to invest in advanced security solutions. These solutions must include the following features:

Endpoint Security: In order to protect endpoints from cryptojacking a robust Endpoint Security solution with cutting-edge features like behavior based detection and antivirus is necessary.

Web Filtering: Web Filtering includes a set of tools that can be customized to safeguard your business network from suspicious websites. Distrustful websites are blocked and users are prevented from accessing them.

Network Monitoring: This is a tool that is able to detect huge surges in processor activity, which is a well-known symptom of a cryptojacked device. It helps network administrators keep a close eye on data anomalies.

Mobile Device Management (MDM): Business users depend on mobile phones for conveniently carrying out activities. Hence, deploying a robust MDM solution is important for preventing this type of hijacking.

Apart from these, businesses must ensure basic security hygiene, such as installing a web security solution for the safety of visitors on their website and also carry out patching of latest security updates. For example, SecBI has developed an artificial intelligence solution that analyzes network data and identifies cryptojacking threats.

For more blogs on the latest technical innovations, follow the premier big data Hadoop training instituteDexLab Analytics. Do take a look at the course details for big data Hadoop certification in Delhi.


Reference: cio.economictimes.indiatimes.com/tech-talk/how-businesses-can-secure-their-systems-from-cryptojacking/3175


Interested in a career in Data Analyst?

To learn more about Data Analyst with Advanced excel course – Enrol Now.
To learn more about Data Analyst with R Course – Enrol Now.
To learn more about Big Data Course – Enrol Now.

To learn more about Machine Learning Using Python and Spark – Enrol Now.
To learn more about Data Analyst with SAS Course – Enrol Now.
To learn more about Data Analyst with Apache Spark Course – Enrol Now.
To learn more about Data Analyst with Market Risk Analytics and Modelling Course – Enrol Now.

Tapping Into Big Data for Better Talent Acquisition

Tapping Into Big Data for Better Talent Acquisition

There are many variables that need to be considered while making hiring decisions. Most importantly, there’s need to fill skill gap. Other factors are candidate behavior and financial aspects of hiring, like cost for training new employees. Big data and analytics help form valuable insights into the job market. Consider the example of IBM acquiring the services of consulting firm Kenexa. It was used to access data of 40 million workers in order to find the personality trait most suitable for a sales job. All kinds of information starting from the workers’ job applications to managerial level was analyzed and it was determined that ’persistence’ is the most valued trait.

Here are some important ways big data helps firms attract promising candidates:

Automate HR Affairs

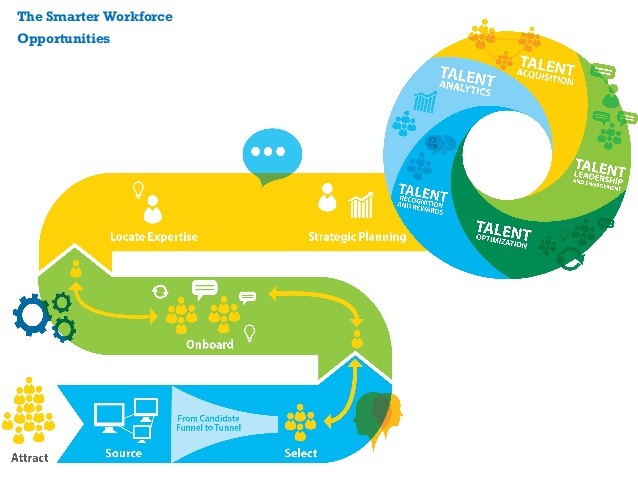
Talent Acquisition encompasses a wide variety of tasks and when HR teams work in tandem with AI then many day-to-day tasks gets simplified. It helps with tasks like filtering and tracking application status of candidates, getting new hires onboard and making future decisions about employees by analyzing data of previous employees. Data enabled systems saves a lot of time and makes tedious tasks much easier.

Predictive Analytics for Better Hiring Decisions

Hiring professionals need 360 degree information about a particular situation in order to make the best decision possible. They need to analyze everything starting from the human capital requirement in the organization to the economics. Big data enables them to form a clear idea about the skill gaps in the company’s workforce, analyze current trends in the market, follow the financial KPI’s and demographic traits associated with hiring, set the hiring quota and identify the skills and talents to look for in new hires.

Discard ‘’Eleventh Hour’’ Hiring Method

The urgency to fill skill gaps often pressurizes HR professionals to make quick hires, which can be impulsive and not the best. With the help of predictive analytics, these last minute situations can be completely avoided. It allows HR teams to form long-term hiring strategies that align with company goals and also enables them to make timely hires. Using the power of big data, you can be aware of the future needs of your company and job market trends. Hence, it helps eliminate panic situations where you make a hire only to realize later that he/she doesn’t fit the bill.

Social Media for Insights

Big data helps firms attract the right candidates that fit a role. The hard data available on the social media platforms of promising candidates and their search behavior online give organizations crucial information that help them make right decisions. Talent Bin is one of the many employment websites that use information from social media to form insights.

Targeted Job Ads

With the help of analytics, companies can create target groups and rope them in by showing relevant ads. For example, if there’s a financial service provider who enjoys a large talent network interested in marketing on LinkedIn, then they can take this opportunity to post marketing-specific job advertisements. Many potential candidates might find these posts engaging and the company will find the right fit for the job.

Wrapping up, we can say that big data has opened up fresh avenues to make better hires. The influence of big data in every aspect of the modern corporate sector is truly astounding. The smartest candidates are enrolling for big data courses to build skills that sell the most in today’s world of work. For expert-guided big data Hadoop training in Gurgaon, visit DexLab Analytics.


Reference: insidebigdata.com/2018/07/20/big-data-talent-acquisition-effective-synergy-make-better-hires


Interested in a career in Data Analyst?

To learn more about Data Analyst with Advanced excel course – Enrol Now.
To learn more about Data Analyst with R Course – Enrol Now.
To learn more about Big Data Course – Enrol Now.

To learn more about Machine Learning Using Python and Spark – Enrol Now.
To learn more about Data Analyst with SAS Course – Enrol Now.
To learn more about Data Analyst with Apache Spark Course – Enrol Now.
To learn more about Data Analyst with Market Risk Analytics and Modelling Course – Enrol Now.

The 8 Leading Big Data Analytics Influencers for 2018

The 8 Leading Big Data Analytics Influencers for 2018

Big data is one of the most talked about technology topics of the last few years. As big data and analytics keep evolving, it is important for people associated with it to keep themselves updated about the latest developments in this field. However, many find it difficult to be up to date with the latest news and publications.

If you are a big data enthusiast looking for ways to get your hands on the latest data news, then this blog is the ideal read for you. In this article, we list the top 8 big data influencers of 2018. Following these people and their blogs and websites shall keep you informed about all the trending things in big data.

2

Kirk Borne

Known as the kirk in the field of analytics, his popularity has been growing over the last couple of years.  From 2016 to 2017, the number of people following him grew by 30 thousand. Currently he’s the principal data scientist at Booz Allen; previously he has worked with NASA for a decade. Kirk was also appointed by the US president to share his knowledge on Data Mining and how to protect oneself from cyber attacks. He has participated in several Ted talks. So, interested candidates should listen to those talks and follow him on Twitter.

Ronald Van Loon

He is an expert on not only big data, but also Business Intelligence and the Internet of Things, and writes articles on these topics so that readers become familiar with these technologies. Ronald writes for important organizations like Dataconomy and DataFloq. He has over hundred thousand followers on Twitter. Currently, he works as a big data educator at Simplelearn.

Hilary Manson

She is a big data professional who manages multiple roles together. Hilary is a data scientist at Accel, Vice president at Cloudera, and a speaker and writer in this field. Back in 2014, she founded a machine learning research company called Fast Forward labs. Clearly, she is a big data analytics influencer that everyone should follow.

Carla Gentry

Currently working in Samtec Inc; she has helped many big shot companies to draw insights from complicated data and increase profits. Carla is a mathematician, an economist, owner of Analytic Solution, a social media ethusiat, and a must-follow expert in this field.

Vincent Granville

Vincent Granville’s thorough understanding of topics like machine learning, BI, data mining, predictive modeling and fraud detection make him one the best influencers of 2018. Data Science Central-the popular online platform for gaining knowledge on big data analytics has been cofounded by Vincent.

Merv Adrian

Presently the Research Vice President at Gartner, he has over 30 years of experience in IT sector. His current work focuses on upcoming Hadoop technologies, data management and data security problems. By following Merv’s blogs and twitter posts, you shall be informed about important industry issues that are sometimes not covered in his Gartner research publications.

Bernard Marr

Bernard has earned a good reputation in the big data and analytics world. He publishes articles on platforms like LinkedIn, Forbes and Huffington Post on a daily basis. Besides being the major speaker and strategic advisor for top companies and the government, he is also a successful business author.

Craig Brown

With over twenty years of experience in this field, he is a renowned technology consultant and subject matter expert. The book Untapped Potential, which explains the path of self-discovery, has been written by Craig.

If you have read the entire article, then one thing is very clear-you are a big data enthusiast! So, why not make your career in the big data analytics industry?

Enroll for big data Hadoop courses in Gurgaon for a firm footing in this field. To read more interesting blogs regularly, follow Dexlab Analytics– a leading big data Hadoop training center in Delhi. Interested candidates can avail flat 10% discount on selected courses at DexLab Analytics.


Reference: www.analyticsinsight.net/top-12-big-data-analytics-and-data-science-influencers-in-2018


Interested in a career in Data Analyst?

To learn more about Data Analyst with Advanced excel course – Enrol Now.
To learn more about Data Analyst with R Course – Enrol Now.
To learn more about Big Data Course – Enrol Now.

To learn more about Machine Learning Using Python and Spark – Enrol Now.
To learn more about Data Analyst with SAS Course – Enrol Now.
To learn more about Data Analyst with Apache Spark Course – Enrol Now.
To learn more about Data Analyst with Market Risk Analytics and Modelling Course – Enrol Now.

Top 5 Up-And-Coming Big Data Trends for 2018

Top 5 Up-And-Coming Big Data Trends for 2018

The big data market is constantly growing and evolving. It is predicted that by 2020 there will be over 400,000 big data jobs in the US alone, but only around 300,000 skilled professionals in the field. The constant evolution of the big data industry makes it quite difficult to predict trends. However, below are some of the trends that are likely to take shape in 2018.

Open source frameworks:

Open source frameworks like Hadoop and Spark are dominating the big data realm for quite some time now and this trend will continue in 2018. The use of Hadoop is increasing by 32.9% every year- according to Forrester forecast reports. Experts say that 2018 will see an increase in the usage of Hadoop and Spark frameworks for better data processing by organizations. As per TDWI Best Practices report, 60% of enterprises aim to have Hadoop clusters functioning in production by end of 2018.

As Hadoop frameworks are becoming more popular, companies are looking for professionals skilled in Hadoop and similar techs so that they can draw valuable insights from real-time data. Owing to these reasons, more and more candidates interested to make a career in this field are going for big data Hadoop training.

Visualization Models:

A survey was conducted with 2800 BI experts in 2017 where they highlighted the importance of data discovery and data visualization. Data discovery isn’t just about understanding, analyzing and discovering patterns in the data, but also about presenting the analysis in a manner that easily conveys the core business insights. Humans find it simpler to process visual patterns. Hence, one of the significant trends of 2018 is development of compelling visualization models for processing big data.

2

Streaming success:

Every organization is looking to master streaming analytics- a process where data sets are analyzed while they are still in the path of creation. This removes the problem of having to replicate datasets and provides insights that are up-to-the-second. Some of the limitations of streaming analytics are restricted sizes of datasets and having to deal with delays. However, organizations are working to overcome these limitations by end of 2018.

Dark data challenge

Dark data refers to any kind of data that is yet to be utilized and mainly includes non-digital data recording formats such as paper files, historical records, etc. the volume of data that we generate everyday may be increasing, but most of these data records are in analog form or un-digitized form and aren’t exploited through analytics. However, 2018 will see this dark data enter cloud. Enterprises are coming up with big data solutions that enable the transfer of data from dark environments like mainframes into Hadoop.

Enhanced efficiency of AI and ML:

Artificial intelligence and machine learning technologies are rapidly developing and businesses are gaining from this growth through use cases like fraud detection, pattern recognition, real-time ads and voice recognition. In 2018, machine learning algorithms will go beyond traditional rule-based algorithms. They will become speedier and more precise and enterprises will use these to make more accurate predictions.

These are some of the top big data trends predicted by industry experts. However, owing to the constantly evolving nature of big data, we should brace ourselves for a few surprises too!

Big data is shoving the tech space towards a smarter future and an increasing number of organizations are making big data their top priority. Take advantage of this data-driven age and enroll for big data Hadoop courses in Gurgaon. At DexLab Analytics, industry-experts patiently teach students all the theoretical fundamentals and give them hands-on training. Their guidance ensures that students become aptly skilled to step into the world of work. Interested students can now avail flat 10% discount on big data courses by enrolling for DexLab’s new admission drive #BigDataIngestion.


Reference: https://www.analyticsinsight.net/emerging-big-data-trends-2018


Interested in a career in Data Analyst?

To learn more about Data Analyst with Advanced excel course – Enrol Now.
To learn more about Data Analyst with R Course – Enrol Now.
To learn more about Big Data Course – Enrol Now.

To learn more about Machine Learning Using Python and Spark – Enrol Now.
To learn more about Data Analyst with SAS Course – Enrol Now.
To learn more about Data Analyst with Apache Spark Course – Enrol Now.
To learn more about Data Analyst with Market Risk Analytics and Modelling Course – Enrol Now.

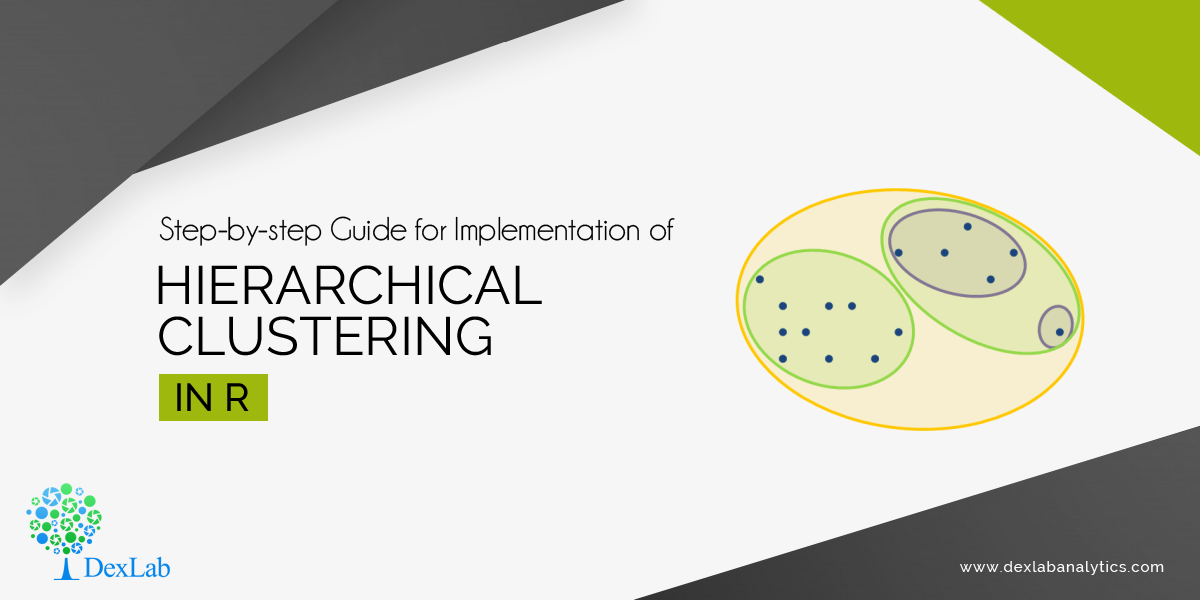
Step-by-step Guide for Implementation of Hierarchical Clustering in R

Step-by-step Guide for Implementation of Hierarchical Clustering in R

Hierarchical clustering is a method of clustering that is used for classifying groups in a dataset. It doesn’t require prior specification of the number of clusters that needs to be generated. This cluster analysis method involves a set of algorithms that build dendograms, which are tree-like structures used to demonstrate the arrangement of clusters created by hierarchical clustering.

It is important to find the optimal number of clusters for representing the data. If the number of clusters chosen is too large or too small, then the precision in partitioning the data into clusters is low.

NbClust

The R package NbClust has been developed to help with this. It offers good clustering schemes to the user and provides 30 indices for determining the number of clusters.

Through NbClust, any combination of validation indices and clustering methods can be requested in a single function call. This enables the user to simultaneously evaluate several clustering schemes while varying the number of clusters.

One such index used for getting optimum number of clusters is Hubert Index.

2

Performing Hierarchical Clustering in R

In this blog, we shall be performing hierarchical clustering using the dataset for milk. The flexclust package is used to extract this dataset.

The milk dataset contains observations and parameters as shown below:

As seen in the dataset, milk obtained from various animal sources and their respective proportions of water, protein, fat, lactose and ash have been mentioned.

For making calculations easier, we scale down original values into a standard normalized form. For that, we use processes like centering and scaling. The variable may be scaled in the following ways:

Subtract mean from each value (centering) and then divide it by standard deviation or divide it by its mean deviation about mean (scaling)

Divide each value in the variable by maximum value of the variable

After scaling the variables we get the following matrix

The next step is to calculate the Euclidean distance between different data points and store the result in a variable.

Hierarchical average linkage method is used for performing clustering of different animal sources. The formula used for that is shown below.

We obtain 25 clusters from the dataset.

To draw the dendogram we use the plot command and we obtain the figure given below.


The Nbclust library is used to get the optimum number of clusters for partitioning the data. The maximum and minimum number of clusters that is needed is stored in a variable. The nbClust method finds out the optimum number of clusters according to different clustering indices and finally the Hubert Index decides the optimum value of the number of clusters.

The optimum cluster value is 3, as can be seen in the figure below.

Values corresponding to knee jerk visuals in the graph give the number of clusters needed.

The graph shows that the maximum votes from various clustering indices went to cluster 3. Hence, the data is partitioned into 3 clusters.

The graph is partitioned into 3 clusters as shown by the red lines.

Now, the points are portioned into 3 clusters as opposed to the 25 clusters we got initially.

Next, the clusters are assigned to the observations.

The clusters are assigned different colors for ease of visualization


That brings us to a close on the topic of Hierarchical clustering. In the upcoming blogs, we shall be discussing K-Means clustering. So, follow DexLab Analytics – a leading institute providing big data Hadoop training in Gurgaon. Enroll for their big data Hadoop courses and avail flat 10% discount. To more about this #SummerSpecial offer, visit our website.


Interested in a career in Data Analyst?

To learn more about Data Analyst with Advanced excel course – Enrol Now.
To learn more about Data Analyst with R Course – Enrol Now.
To learn more about Big Data Course – Enrol Now.

To learn more about Machine Learning Using Python and Spark – Enrol Now.
To learn more about Data Analyst with SAS Course – Enrol Now.
To learn more about Data Analyst with Apache Spark Course – Enrol Now.
To learn more about Data Analyst with Market Risk Analytics and Modelling Course – Enrol Now.

Predicting World Cup Winner 2018 with Big Data

Predicting World Cup Winner 2018 with Big Data

Is there any way to predict who will win World Cup 2018?

Could big data be used to decipher the internal mechanisms of this beautiful game?

How to collect meaningful insights about a team before supporting one?

Data Points

Opta Sports and STATS help predict which teams will perform better. These are the two sports companies that have answers to all the above questions. Their objective is to collect data and interpret it for their clients, mainly sports teams, federations and of course media, always hungry for data insights.

How do they do it? Opta’s marketing manager Peter Deeley shares that for each football match, his company representatives collects as many as 2000 individual data points, mostly focused on ‘on-ball’ actions. Generally, a team of three analysts operates from the company’s data hub in Leeds; they record everything happening on the pitch and analyze the positions on the field where each interaction takes place. The clients receive live data; that’s the reason why Gary Lineker, former England player is able to share information like possession and shots on goal during half time.

The same procedure is followed at Stats.com; Paul Power, a data scientist from Stats.com explains how they don’t rely only on humans for data collection, but on latest computer vision technologies. Though computer vision can be used to log different sorts of data, yet it can never replace human beings altogether. “People are still best because of nuances that computers are not going to be able to understand,” adds Paul.

Who is going to win?

In this section, we’re going to hit the most important question of this season – which team is going to win this time? As far as STATS is concerned, it’s not too eager to publish its predictions this year. The reason being they believe is a very valuable piece of information and by spilling the beans they don’t want to upset their clients.

On the other hand, we do have a prediction from Opta. According to them, veteran World Cup champion Brazil holds the highest chance of taking home the trophy – giving them a 14.2% winning chance. What’s more, Opta also has a soft corner for Germany – thus giving them an 11.4% chance of bringing back the cup once again.

If it’s about prediction and accuracy, we can’t help but mention EA Sports. For the last 3 World Cups, it maintained a track record of predicting the eventual World Cup winner impeccably. Using the encompassing data about the players and team rankings in FIFA 2018, the company representatives ran a simulation of the tournament, in which France came out to be the winner, defeating Germany in the final. As it has already predicted right about Germany and Spain in 2014 and 2010 World Cups, consecutively, this new revelation is a good catch.

So, can big data predict the World Cup winner? We guess yes, somehow.

DexLab Analytics Presents #BigDataIngestion

If you are interested in big data hadoop certification in Noida, we have some good news coming your way! DexLab Analytics has started a new admission drive for prospective students interested in big data and data science certification. Enroll in #BigDataIngestion and enjoy 10% off on in-demand courses, including data science, machine learning, hadoop and business analytics.


The blog has been sourced from – https://www.techradar.com/news/world-cup-2018-predictions-with-big-data-who-is-going-to-win-what-and-when


Interested in a career in Data Analyst?

To learn more about Data Analyst with Advanced excel course – Enrol Now.
To learn more about Data Analyst with R Course – Enrol Now.
To learn more about Big Data Course – Enrol Now.

To learn more about Machine Learning Using Python and Spark – Enrol Now.
To learn more about Data Analyst with SAS Course – Enrol Now.
To learn more about Data Analyst with Apache Spark Course – Enrol Now.
To learn more about Data Analyst with Market Risk Analytics and Modelling Course – Enrol Now.

Transformation On-The-Go: See How Financial and Manufacturing Sectors are Harnessing Big Data Hadoop

big data hadoop course


An elderly man of 50 years of age was on the treadmill, when suddenly he received an alert on his Apple Watch showing his pulse has shot up abnormally high, putting him at the risk of a possible heart attack.  Immediately he got off from the treadmill and his life was saved!

Thanks to Pontem, an incredible platform that intakes input from Apple Watch and Fitbit and issues such consequential alerts wielding machine learning, cloud-based data and cognitive processing. From the point of view of a user, these alerts are life-saver, but for the developers, it implies the latest evolution of big data technology, especially Hadoop ecosystem. Once a mere data managing tool, Hadoop is maturing and making its way to the next level.

Today, Hadoop is the lifeblood of industry-specific solutions. But adopting it for your business is no mean feat. You need to have a specific approach in sync with the particular industry type.

Financial Sector & Manufacturing

After healthcare, financial and manufacturing industry is the biggest consumer of Hadoop technology. Besides, managing, storing and analyzing data, big data coupled with AI and machine learning helps understand the intricacies of credit risk more effectively.

Of late, credit risk management has been troubling financial services companies. Though the entire banking industry has matured, the constantly evolving nature of models has been a headache for traditional credit risk models. However, the expansiveness of big data and availability in multiple formats has helped companies ace in advanced credit risk models – which was next to impossible even a few years back.

With Big Data Hadoop, a large amount of customer data is available – including online browsing activity, user spending behavior and payment options, all of which helps banks and other financial institutions frame better decisions. Commendable Hadoop’s ability to manage and manipulate unstructured data is put to use for respective functions. Over the years, Hadoop has evolved to offer sound flexibility and massive scalability to manage big data. Incorporating AI and Machine Learning, the new sophisticated models based on Hadoop clusters breaks down big data into small, easy-to-comprehend chunks, while adapting to changing, innovative data patterns. In short, the management of big data has now become comparatively an easy task – using low cost hardware, self healing, self learning and internal fault tolerance attributes. No more, you feel like stuck in a cleft stick, while handling such a massive infrastructure of big data.


For manufacturing industry, predictive analytics is the key that’s bringing in large-scale digital transformation – internet connections and sensors are providing real-time data for better operations. Sensors have the ability to detect prior anomalies in the production process, thereby preventing production of defective items and curtail subsequent waste. Often, there is a deep learning or AI connect to the analytics layers existing on the top of Hadoop data lakes that offers suave data analytics and self-learning capabilities. It’s said, around 80% of manufacturers will implement cutting edge technology in the next few years. And the numbers are just increasing.

Hadoop is not like a magic potion. It’s a robust platform on which you can harness the data power. However, to master Hadoop technology, you need to have required knowledge and expertise as per the industry standards. DexLab Analytics is a well-recognized Big Data Hadoop institute in Noida. They offer an extensive range of courses on in-demand skills, including Big Data Hadoop training in Delhi.

Check out their latest admission drive #BigDataIngestion: students can avail 10%off on in-demand courses, like big data hadoop, data science, machine learning and business analytics. Limited offer. Hurry!

This blog has been sourced from: http://dataconomy.com/2018/05/hadoop-evolved-how-industries-are-being-transformed-by-big-data/

Interested in a career in Data Analyst?

To learn more about Data Analyst with Advanced excel course – Enrol Now.
To learn more about Data Analyst with R Course – Enrol Now.
To learn more about Big Data Course – Enrol Now.

To learn more about Machine Learning Using Python and Spark – Enrol Now.
To learn more about Data Analyst with SAS Course – Enrol Now.
To learn more about Data Analyst with Apache Spark Course – Enrol Now.
To learn more about Data Analyst with Market Risk Analytics and Modelling Course – Enrol Now.

Call us to know more