big data hadoop Archives - Page 3 of 16 - DexLab Analytics | Big Data Hadoop SAS R Analytics Predictive Modeling & Excel VBA

The Future of Humanity Lies in Big Data

The Future of Humanity Lies in Big Data

The World Economic Forum Annual Meeting 2018 was held in Davos, Switzerland. Here politicians, decision-makers from the world’s largest companies, and thought leaders come together to discuss about pressing global challenges. In this important platform, the opening words of historian, professors and famous author Yuval Harari were these— ‘’ we are probably the last generations of Homo sapiens.’’

He went on to explain that the new entities that humans will eventually evolve into will differ a lot more from the modern man than we did from our predecessors, the Neanderthals. However, the new species won’t be products of natural evolution of human genes, rather the result of humans engineering bodies and brains.

2

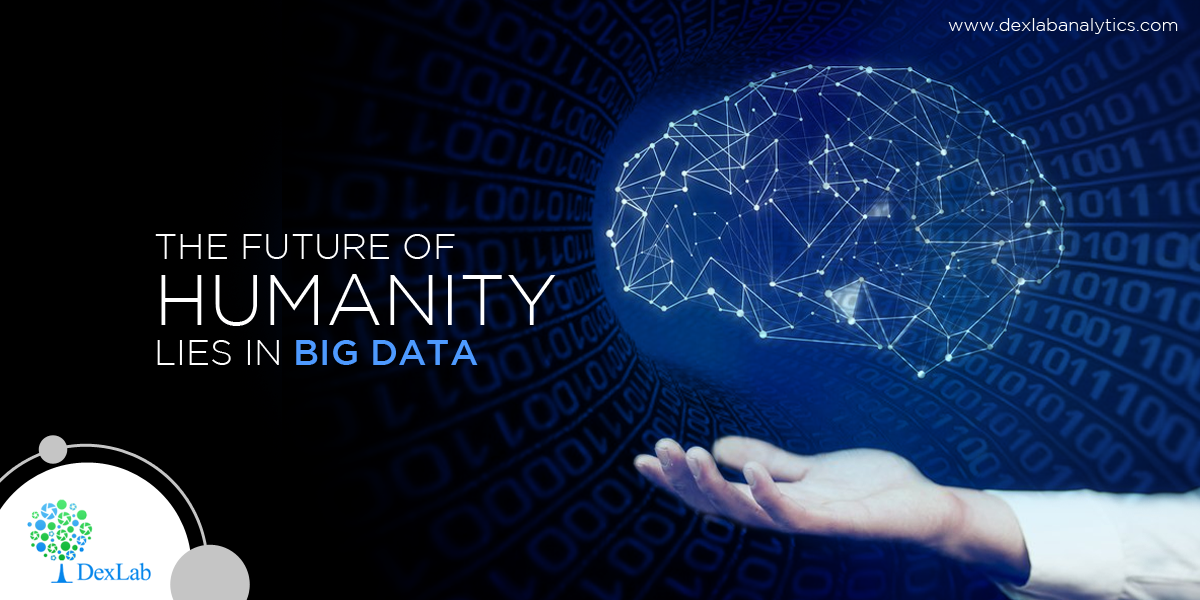
Harari said that in future, the power will lie in the hands of those who control data. Data is the most important asset in the world and has redefined the prerequisites of power and dominance. Earlier, the ownership of land and subsequently machinery separated humans into aristocrats and commoners, capitalists and workers. However, in the modern age data is the determining asset. This is reflected in the biggest companies of the world. Out of ten of the leading companies in the world, six are tech firms that deal with enormous amounts of data, namely Apple, Microsoft, Amazon, Alphabet, Tencent and Facebook. The fact that these companies are only around two decades old suggests the role big data played in their growth.

Technology has advanced to the extent that data can be used to hack not just computers but also human beings. It takes only two things- data and computing power. Computing power is advancing with enormous speed. Today, the processing powers of mobile phones we use are greater than the best computers from a few decades ago. At the same time, digital information is ever increasing. Humans generate an average of 2.5 million terabytes of data in a day!

The data humans generate is mostly in unstructured form, especially the data that comes from online surveys and social media platforms. However, if analyzed, this data can reveal a lot about the personality of the person generating the data. It is layered with meaning and very open to interpretation. Understandably, analysts are focusing more and more on making sense of this unstructured data.

Hacking the human mind with algorithms

Through machine learning, smart artificial intelligence and deep learning, it is now possible to mine volumes of data and find patterns that earlier went unnoticed to human minds, which are ‘biologically limited’. Right kind of data and the power of computers can be utilized to develop algorithms that know more about people than they do themselves. After all, humans are just biochemical algorithms and the amalgamation of neuroscience and artificial intelligence has enabled the creation of algorithms that help understand the mechanics of human mind better than ever before.

In the words of Harari— ‘’As you surf the internet, as you watch videos or check your social feed, the algorithms will be monitoring your eye movements, your blood pressure, your brain activity, and they will know.’’

To read more blogs on big data, analytics and all the latest trends in these fields, follow DexLab Analytics. We are a leading institute providing Hadoop training in Gurgaon. Do take a look at our big data Hadoop certifications— we are offering flat 10% discount in these courses.


Interested in a career in Data Analyst?

To learn more about Data Analyst with Advanced excel course – Enrol Now.
To learn more about Data Analyst with R Course – Enrol Now.
To learn more about Big Data Course – Enrol Now.

To learn more about Machine Learning Using Python and Spark – Enrol Now.
To learn more about Data Analyst with SAS Course – Enrol Now.
To learn more about Data Analyst with Apache Spark Course – Enrol Now.
To learn more about Data Analyst with Market Risk Analytics and Modelling Course – Enrol Now.

The 8 Leading Big Data Analytics Influencers for 2018

The 8 Leading Big Data Analytics Influencers for 2018

Big data is one of the most talked about technology topics of the last few years. As big data and analytics keep evolving, it is important for people associated with it to keep themselves updated about the latest developments in this field. However, many find it difficult to be up to date with the latest news and publications.

If you are a big data enthusiast looking for ways to get your hands on the latest data news, then this blog is the ideal read for you. In this article, we list the top 8 big data influencers of 2018. Following these people and their blogs and websites shall keep you informed about all the trending things in big data.

2

Kirk Borne

Known as the kirk in the field of analytics, his popularity has been growing over the last couple of years.  From 2016 to 2017, the number of people following him grew by 30 thousand. Currently he’s the principal data scientist at Booz Allen; previously he has worked with NASA for a decade. Kirk was also appointed by the US president to share his knowledge on Data Mining and how to protect oneself from cyber attacks. He has participated in several Ted talks. So, interested candidates should listen to those talks and follow him on Twitter.

Ronald Van Loon

He is an expert on not only big data, but also Business Intelligence and the Internet of Things, and writes articles on these topics so that readers become familiar with these technologies. Ronald writes for important organizations like Dataconomy and DataFloq. He has over hundred thousand followers on Twitter. Currently, he works as a big data educator at Simplelearn.

Hilary Manson

She is a big data professional who manages multiple roles together. Hilary is a data scientist at Accel, Vice president at Cloudera, and a speaker and writer in this field. Back in 2014, she founded a machine learning research company called Fast Forward labs. Clearly, she is a big data analytics influencer that everyone should follow.

Carla Gentry

Currently working in Samtec Inc; she has helped many big shot companies to draw insights from complicated data and increase profits. Carla is a mathematician, an economist, owner of Analytic Solution, a social media ethusiat, and a must-follow expert in this field.

Vincent Granville

Vincent Granville’s thorough understanding of topics like machine learning, BI, data mining, predictive modeling and fraud detection make him one the best influencers of 2018. Data Science Central-the popular online platform for gaining knowledge on big data analytics has been cofounded by Vincent.

Merv Adrian

Presently the Research Vice President at Gartner, he has over 30 years of experience in IT sector. His current work focuses on upcoming Hadoop technologies, data management and data security problems. By following Merv’s blogs and twitter posts, you shall be informed about important industry issues that are sometimes not covered in his Gartner research publications.

Bernard Marr

Bernard has earned a good reputation in the big data and analytics world. He publishes articles on platforms like LinkedIn, Forbes and Huffington Post on a daily basis. Besides being the major speaker and strategic advisor for top companies and the government, he is also a successful business author.

Craig Brown

With over twenty years of experience in this field, he is a renowned technology consultant and subject matter expert. The book Untapped Potential, which explains the path of self-discovery, has been written by Craig.

If you have read the entire article, then one thing is very clear-you are a big data enthusiast! So, why not make your career in the big data analytics industry?

Enroll for big data Hadoop courses in Gurgaon for a firm footing in this field. To read more interesting blogs regularly, follow Dexlab Analytics– a leading big data Hadoop training center in Delhi. Interested candidates can avail flat 10% discount on selected courses at DexLab Analytics.


Reference: www.analyticsinsight.net/top-12-big-data-analytics-and-data-science-influencers-in-2018


Interested in a career in Data Analyst?

To learn more about Data Analyst with Advanced excel course – Enrol Now.
To learn more about Data Analyst with R Course – Enrol Now.
To learn more about Big Data Course – Enrol Now.

To learn more about Machine Learning Using Python and Spark – Enrol Now.
To learn more about Data Analyst with SAS Course – Enrol Now.
To learn more about Data Analyst with Apache Spark Course – Enrol Now.
To learn more about Data Analyst with Market Risk Analytics and Modelling Course – Enrol Now.

Top 5 Up-And-Coming Big Data Trends for 2018

Top 5 Up-And-Coming Big Data Trends for 2018

The big data market is constantly growing and evolving. It is predicted that by 2020 there will be over 400,000 big data jobs in the US alone, but only around 300,000 skilled professionals in the field. The constant evolution of the big data industry makes it quite difficult to predict trends. However, below are some of the trends that are likely to take shape in 2018.

Open source frameworks:

Open source frameworks like Hadoop and Spark are dominating the big data realm for quite some time now and this trend will continue in 2018. The use of Hadoop is increasing by 32.9% every year- according to Forrester forecast reports. Experts say that 2018 will see an increase in the usage of Hadoop and Spark frameworks for better data processing by organizations. As per TDWI Best Practices report, 60% of enterprises aim to have Hadoop clusters functioning in production by end of 2018.

As Hadoop frameworks are becoming more popular, companies are looking for professionals skilled in Hadoop and similar techs so that they can draw valuable insights from real-time data. Owing to these reasons, more and more candidates interested to make a career in this field are going for big data Hadoop training.

Visualization Models:

A survey was conducted with 2800 BI experts in 2017 where they highlighted the importance of data discovery and data visualization. Data discovery isn’t just about understanding, analyzing and discovering patterns in the data, but also about presenting the analysis in a manner that easily conveys the core business insights. Humans find it simpler to process visual patterns. Hence, one of the significant trends of 2018 is development of compelling visualization models for processing big data.

2

Streaming success:

Every organization is looking to master streaming analytics- a process where data sets are analyzed while they are still in the path of creation. This removes the problem of having to replicate datasets and provides insights that are up-to-the-second. Some of the limitations of streaming analytics are restricted sizes of datasets and having to deal with delays. However, organizations are working to overcome these limitations by end of 2018.

Dark data challenge

Dark data refers to any kind of data that is yet to be utilized and mainly includes non-digital data recording formats such as paper files, historical records, etc. the volume of data that we generate everyday may be increasing, but most of these data records are in analog form or un-digitized form and aren’t exploited through analytics. However, 2018 will see this dark data enter cloud. Enterprises are coming up with big data solutions that enable the transfer of data from dark environments like mainframes into Hadoop.

Enhanced efficiency of AI and ML:

Artificial intelligence and machine learning technologies are rapidly developing and businesses are gaining from this growth through use cases like fraud detection, pattern recognition, real-time ads and voice recognition. In 2018, machine learning algorithms will go beyond traditional rule-based algorithms. They will become speedier and more precise and enterprises will use these to make more accurate predictions.

These are some of the top big data trends predicted by industry experts. However, owing to the constantly evolving nature of big data, we should brace ourselves for a few surprises too!

Big data is shoving the tech space towards a smarter future and an increasing number of organizations are making big data their top priority. Take advantage of this data-driven age and enroll for big data Hadoop courses in Gurgaon. At DexLab Analytics, industry-experts patiently teach students all the theoretical fundamentals and give them hands-on training. Their guidance ensures that students become aptly skilled to step into the world of work. Interested students can now avail flat 10% discount on big data courses by enrolling for DexLab’s new admission drive #BigDataIngestion.


Reference: https://www.analyticsinsight.net/emerging-big-data-trends-2018


Interested in a career in Data Analyst?

To learn more about Data Analyst with Advanced excel course – Enrol Now.
To learn more about Data Analyst with R Course – Enrol Now.
To learn more about Big Data Course – Enrol Now.

To learn more about Machine Learning Using Python and Spark – Enrol Now.
To learn more about Data Analyst with SAS Course – Enrol Now.
To learn more about Data Analyst with Apache Spark Course – Enrol Now.
To learn more about Data Analyst with Market Risk Analytics and Modelling Course – Enrol Now.

Step-by-step Guide for Implementation of Hierarchical Clustering in R

Step-by-step Guide for Implementation of Hierarchical Clustering in R

Hierarchical clustering is a method of clustering that is used for classifying groups in a dataset. It doesn’t require prior specification of the number of clusters that needs to be generated. This cluster analysis method involves a set of algorithms that build dendograms, which are tree-like structures used to demonstrate the arrangement of clusters created by hierarchical clustering.

It is important to find the optimal number of clusters for representing the data. If the number of clusters chosen is too large or too small, then the precision in partitioning the data into clusters is low.

NbClust

The R package NbClust has been developed to help with this. It offers good clustering schemes to the user and provides 30 indices for determining the number of clusters.

Through NbClust, any combination of validation indices and clustering methods can be requested in a single function call. This enables the user to simultaneously evaluate several clustering schemes while varying the number of clusters.

One such index used for getting optimum number of clusters is Hubert Index.

2

Performing Hierarchical Clustering in R

In this blog, we shall be performing hierarchical clustering using the dataset for milk. The flexclust package is used to extract this dataset.

The milk dataset contains observations and parameters as shown below:

As seen in the dataset, milk obtained from various animal sources and their respective proportions of water, protein, fat, lactose and ash have been mentioned.

For making calculations easier, we scale down original values into a standard normalized form. For that, we use processes like centering and scaling. The variable may be scaled in the following ways:

Subtract mean from each value (centering) and then divide it by standard deviation or divide it by its mean deviation about mean (scaling)

Divide each value in the variable by maximum value of the variable

After scaling the variables we get the following matrix

The next step is to calculate the Euclidean distance between different data points and store the result in a variable.

Hierarchical average linkage method is used for performing clustering of different animal sources. The formula used for that is shown below.

We obtain 25 clusters from the dataset.

To draw the dendogram we use the plot command and we obtain the figure given below.


The Nbclust library is used to get the optimum number of clusters for partitioning the data. The maximum and minimum number of clusters that is needed is stored in a variable. The nbClust method finds out the optimum number of clusters according to different clustering indices and finally the Hubert Index decides the optimum value of the number of clusters.

The optimum cluster value is 3, as can be seen in the figure below.

Values corresponding to knee jerk visuals in the graph give the number of clusters needed.

The graph shows that the maximum votes from various clustering indices went to cluster 3. Hence, the data is partitioned into 3 clusters.

The graph is partitioned into 3 clusters as shown by the red lines.

Now, the points are portioned into 3 clusters as opposed to the 25 clusters we got initially.

Next, the clusters are assigned to the observations.

The clusters are assigned different colors for ease of visualization


That brings us to a close on the topic of Hierarchical clustering. In the upcoming blogs, we shall be discussing K-Means clustering. So, follow DexLab Analytics – a leading institute providing big data Hadoop training in Gurgaon. Enroll for their big data Hadoop courses and avail flat 10% discount. To more about this #SummerSpecial offer, visit our website.


Interested in a career in Data Analyst?

To learn more about Data Analyst with Advanced excel course – Enrol Now.
To learn more about Data Analyst with R Course – Enrol Now.
To learn more about Big Data Course – Enrol Now.

To learn more about Machine Learning Using Python and Spark – Enrol Now.
To learn more about Data Analyst with SAS Course – Enrol Now.
To learn more about Data Analyst with Apache Spark Course – Enrol Now.
To learn more about Data Analyst with Market Risk Analytics and Modelling Course – Enrol Now.

Study: Demand for Data Scientists is Sky-Rocketing; India Leads the Show

Study: Demand for Data Scientists is Sky-Rocketing; India Leads the Show

Last year, India witnessed a surging demand for data scientists by more than 400% – as medium to large-scale companies are increasingly putting their faith on data science capabilities to build and develop next generation products that will be well integrated, highly personalized and extremely dynamic.

Companies in the Limelight

At the same time, India contributed to almost 10% of open job openings for data scientists worldwide, making India the next data science hub after the US. This striking revelation comes at a time when Indian IT sector job creation has hit a slow mode, thus flourishing data science job creation is found providing a silver lining. According to the report, Microsoft, JPMorgan, Deloitte, Accenture, EY, Flipkart, Adobe, AIG, Wipro and Vodafone are some of the top of the line companies which hired the highest number of data scientists this year. Besides data scientists, they also advertised openings for analytics managers, analytics consultants and data analysts among others.

City Stats

After blue chip companies, talking about Indian cities which accounts for the most number of data scientists – we found that Bengaluru leads the show with highest number of data analytics and science related jobs accounting for almost 27% of the total share. In fact, the statistics has further increased from the last year’s 25%, followed by Delhi NCR and Mumbai. Even, owing to an increase in the number of start-ups, 14% of job openings were posted from Tier-II cities.

Notable Sectors

A large chunk of data science jobs originated from the banking and financial sector – 41% of job generation was from banking sector. Other industries that followed the suit are Energy & Utilities and Pharmaceutical and Healthcare; both of which have observed significant increase in job creation over the last year.

Get hands on training on data science from DexLab Analytics, the promising big data hadoop institute in Delhi.

2

Talent Supply Index (TSI) – Insights

Another study – Talent Supply Index (TSI) by Belong suggested that the demand in jobs is a result of data science being employed in some areas or the other across industries with burgeoning online presence, evident in the form of targeted advertising, product recommendation and demand forecasts. Interestingly, businesses sit on a massive pile of information collected over years in forms of partners, customers and internal data. Analyzing such massive volumes of data is the key.

Shedding further light on the matter, Rishabh Kaul, Co-Founder, Belong shared, “If the TSI 2017 data proved that we are in a candidate-driven market, the 2018 numbers should be a wakeup call for talent acquisition to adopt data-driven and a candidate-first approach to attract the best talent. If digital transformation is forcing businesses to adapt and innovate, it’s imperative for talent acquisition to reinvent itself too.”

Significantly, skill-based recruitment is garnering a lot of attention of the recruiters, instead of technology and tool-based training. The demand for Python skill is the highest scoring 39% of all posted data science and analytical jobs. In the second position is R skill with 25%.

Last Notes

The analytics job landscape in India is changing drastically. Companies are constantly seeking worthy candidates who are well-versed in particular fields of study, such as data science, big data, artificial intelligence, predictive analytics and machine learning. In this regard, this year, DexLab Analytics launches its ultimate admission drive for prospective students – #BigDataIngestion. Get amazing discounts on Big Data Hadoop training in Gurgaon and promote an intensive data culture among the student fraternity.

For more information – go to their official website now.


Interested in a career in Data Analyst?

To learn more about Data Analyst with Advanced excel course – Enrol Now.
To learn more about Data Analyst with R Course – Enrol Now.
To learn more about Big Data Course – Enrol Now.

To learn more about Machine Learning Using Python and Spark – Enrol Now.
To learn more about Data Analyst with SAS Course – Enrol Now.
To learn more about Data Analyst with Apache Spark Course – Enrol Now.
To learn more about Data Analyst with Market Risk Analytics and Modelling Course – Enrol Now.

The Power of Data: How the Industry Has Changed After Adding Data

The volume of data is expanding at an enormous rate, each day. No more are 1s and 0s are petty numerical digits, they are now a whole new phenomenon – known as Big Data. A fair assessment of the term helped us understand the massive volume of corporate data collected from a broad spectrum of sources is what big data is all about.

A recent report suggested that organizations are expected to enhance their annual revenues by an average of $5.2 million – thanks to big data.

More about Data, Rather Big Data

Back in the day, most of the company information used to be stored in written formats, like on paper. For example, if 80% of confidential information was kept on paper, 20% was stored electronically. Now, out of that 20%, 80% was kept in databases.

With time, things have changed. Across the business domain, more than 80% of companies store their data in electronic formats nowadays, and at least 80% of that is found outside databases, because most organizations prefer storing data in ad hoc basis in files at random places.

2

Now, the question is what kind of data is of crucial importance? Data, that impacts the most?

With that in mind, we’ve three kinds of data:

  • Customer Data
  • IT Data
  • Internal Financial Data

The Value of Data

For companies, data means dollars – the way data costs companies’ their time and resources, it also leads to increased revenue generation. However, the key factor to be noted here is – the data have to be RELEVANT. Despite potential higher revenues through advanced data skills and technology implementation, an average enterprise is only able to employ 51% of total accumulated and generated data, and less than 48% of decisions are based on that.

To say the least, unlike before, today’s organizations gather data from a wide array of sources – CCTV footage, video-audio files, social networking data, health metrics, blogs, web traffic logs and sensor feeds – previously companies were not as efficient and tech-savvy as they are now. In fact, five years ago, some of the sources from which data is accumulated did not even exist nor were they available on corporate radar.

With the rise of ingenious and connected technologies, companies are turning digital. It hardly matters if you are an automobile manufacturer, fashion collaborator or into digital marketing – being connected digitally and owning meaningful data is all to cash on. You can structure intricate database just with consumers’ details, both personal and professional, such as age, gender, interests, buying patterns, behavioral statistics and habits. Remember, accumulating and analyzing data is not only productive for your company but also becomes a saleable service in its own way.

Make Data the Bedrock of Your Business

Data has to be the life and blood of business plans and decisions you want to make. Ensure your employees learn about the value of data collection, make sure you align your IT resources properly and keep pace with the latest data tools and technologies as they tend to keep on changing, constantly.

Embrace the change – while physical assets are losing importance, data appears to be the most valuable asset a company can ever have.

For big data hadoop certification in gurgaon, look no further than DexLab Analytics. With the right skills in tow and adequate years of experience, this analytics training institute is the toast of the town. For more information, visit our official page. 


The blog has been sourced from:

https://www.digitaldoughnut.com/articles/2016/april/data-may-be-the-most-valuable-asset-your-company-h

https://www.techrepublic.com/blog/cio-insights/big-data-cheat-sheet/

https://www.techrepublic.com/article/the-3-most-important-types-of-data-for-your-business


Interested in a career in Data Analyst?

To learn more about Data Analyst with Advanced excel course – Enrol Now.
To learn more about Data Analyst with R Course – Enrol Now.
To learn more about Big Data Course – Enrol Now.

To learn more about Machine Learning Using Python and Spark – Enrol Now.
To learn more about Data Analyst with SAS Course – Enrol Now.
To learn more about Data Analyst with Apache Spark Course – Enrol Now.
To learn more about Data Analyst with Market Risk Analytics and Modelling Course – Enrol Now.

Analytics of Things is Transforming the Way Businesses Run

Analytics of Things is Transforming the Way Businesses Run

As Internet of Things (IoT) invades every aspect of our lives, big data analytics is likely to be utilized for many more things other than solving business problems. This growing popularity of big data analytics, which is altering the way businesses run, has given birth to a new term- ‘ Analytics of Things’.

Much before big data was identified as the most valuable asset for businesses, enterprises had expressed need for a system that could handle an ‘information explosion’. In 2006, an open source distributed storage and processing system was developed. This system called Hadoop spread across commodity hardware and encouraged the nurturing of many more open source projects that would target different aspects of data and analytics.

Growth of Hadoop:

The primary objective with which Hadoop was developed was storing large volumes of data in a cost effective manner. Enterprises were clueless how to handle their ever increasing volumes of data. So, the first requirement was to dump all that data in a data lake and figure out the use cases gradually. Initially, there used to be a standard set of open source tools for managing data and the data architecture lacked variety.

Prior to adopting big data, companies managed their reporting systems through data warehouses and different types of data management tools. The telecom and banking industry were among the first to step into big data. Over time, some of them completely shifted their reporting work to Hadoop.

2

Evolution of big data architecture:

Big data tools have witnessed drastic evolution. This encouraged enterprises to employ a new range of use cases on big data using the power of real-time processing hubs. This includes fraud detection, supply chain optimization and digital marketing automation among other things. Since Hadoop’s birth in 2006, big data has developed a lot. Some of these developments include intelligent automation and real-time analytics.

To keep up with the demands for better big data architecture, real-time analytics was incorporated in Hadoop and its speed was also improved. Different cloud vendors developed Platform as a Service (PaaS) component and this development was a strong driving force behind big data architectures becoming more diverse.

As companies further explored ways to extract more meaning from their data, it led to the emergence of two major trends: Analytics as a service (AaaS) and data monetization.

AaaS platforms provided a lot of domain experience and hence gave generic PaaS platforms a lot more context. This development made big data architecture more compact.

Another important development came with data monetization. Some sectors, like healthcare and governance, depend heavily on data collected through a range of remote IoT devices. To make these processes speedier and reduce network load, localized processing was needed and this led to the emergence of ‘edge analytics’. Now, there is good sync between edge and centralized platforms, which in turn enhances the processes of data exchange and analysis.

The above mentioned developments show how much big data has evolved and that currently a high level of fine-tuning is possible in its architecture.

Often enterprises struggle with successful implementation of big data. The first step is to define your big data strategy. Instead of going for full blown implementation, undertake shorter implementation cycles.

It is highly likely that our future will become completely driven by big data and ground-breaking innovations like automated analysts and intelligent chatbots. Don’t be left behind. Enroll for big data Hadoop certification courses and take full advantage of the power big data holds in today’s world of work. The big data Hadoop training in Gurgaon ensures that every student becomes proficient enough to face real challenges in the industry. Enroll now and get flat 10% discount on all big data certification courses.


Reference: www.livemint.com/AI/bRwVnGBm6hH78SoUIccomL/Big-Data-Analytics-of-Things-upend-the-way-biz-gets-done.html


Interested in a career in Data Analyst?

To learn more about Data Analyst with Advanced excel course – Enrol Now.
To learn more about Data Analyst with R Course – Enrol Now.
To learn more about Big Data Course – Enrol Now.

To learn more about Machine Learning Using Python and Spark – Enrol Now.
To learn more about Data Analyst with SAS Course – Enrol Now.
To learn more about Data Analyst with Apache Spark Course – Enrol Now.
To learn more about Data Analyst with Market Risk Analytics and Modelling Course – Enrol Now.

Rudiments of Hierarchical Clustering: Ward’s Method and Divisive Clustering

Rudiments of Hierarchical Clustering: Ward’s Method and Divisive Clustering

Clustering, a process used for organizing objects into groups called clusters, has wide ranging applications in day to day life, including fields like marketing, city-planning and scientific research.

Hierarchical clustering, one the most common methods of clustering, builds a hierarchy of clusters either by a ‘’bottom up’’ approach (Agglomerative clustering) or by a ‘’top down’’ approach (Divisive clustering). In the previous blogs, we have discussed the various distance measures and how to perform Agglomerative clustering using linkage types. Today, we will explain the Ward’s method and then move on to Divisive clustering.

Ward’s method:

This is a special type of agglomerative hierarchical clustering technique that was introduced by Ward in 1963. Unlike linkage method, Ward’s method doesn’t define distance between clusters and is used to generate clusters that have minimum within-cluster variance. Instead of using distance metrics it approaches clustering as an analysis of variance problem. The method is based on the error sum of squares (ESS) defined for jth cluster as the sum of the squared Euclidean distances from points to the cluster mean.

Where Xij is the ith observation in the jth cluster. The error sum of squares for all clusters is the sum of the ESSj values from all clusters, that is,

Where k is the number of clusters.

The algorithm starts with each observation forming its own one-element cluster for a total of n clusters, where n is the number of observations. The mean of each of these on-element clusters is equal to that one observation. In the first stage of the algorithm, two elements are merged into one cluster in a way that ESS (error sum of squares) increases by the smallest amount possible. One way of achieving this is merging the two nearest observations in the dataset.

Up to this point, the Ward algorithm gives the same result as any of the three linkage methods discussed in the previous blog. However, as each stage progresses we see that the merging results in the smallest increase in ESS.

This minimizes the distance between the observations and the centers of the clusters. The process is carried on until all the observations are in a single cluster.

2

Divisive clustering:

Divisive clustering is a ‘’top down’’ approach in hierarchical clustering where all observations start in one cluster and splits are performed recursively as one moves down the hierarchy. Let’s consider an example to understand the procedure.

Consider the distance matrix given below. First of all, the Minimum Spanning Tree (MST) needs to be calculated for this matrix.

The MST Graph obtained is shown below.

The subsequent steps for performing divisive clustering are given below:

Cut edges from MST graph from largest to smallest repeatedly.

Step 1: All the items are in one cluster- {A, B, C, D, E}

Step 2: Largest edge is between D and E, so we cut it in 2 clusters- {E}, {A., B, C, D}

Step 3: Next, we remove the edge between B and C, which results in- {E}, {A, B} {C, D}

Step 4: Finally, we remove the edges between A and B (and between C and D), which results in- {E}, {A}, {B}, {C} and {D}

Hierarchical clustering is easy to implement and outputs a hierarchy, which is structured and informative. One can easily figure out the number of clusters by looking at the dendogram.

However, there are some disadvantages of hierarchical clustering. For example, it is not possible to undo the previous step or move around the observations once they have been assigned to a cluster. It is a time-consuming process, hence not suitable for large datasets. Moreover, this method of clustering is very sensitive to outlietrs and the ordering of data effects the final results.

In the following blog, we shall explain how to implement hierarchical clustering in R programming with examples. So, stay tuned and follow DexLab Analytics – a premium Big Data Hadoop training institute in Gurgaon. To aid your big data dreams, we are offering flat 10% discount on our big data Hadoop courses. Enroll now!


Check back for our previous blogs on clustering:

Hierarchical Clustering: Foundational Concepts and Example of Agglomerative Clustering

A Comprehensive Guide on Clustering and Its Different Methods
 

Interested in a career in Data Analyst?

To learn more about Data Analyst with Advanced excel course – Enrol Now.
To learn more about Data Analyst with R Course – Enrol Now.
To learn more about Big Data Course – Enrol Now.

To learn more about Machine Learning Using Python and Spark – Enrol Now.
To learn more about Data Analyst with SAS Course – Enrol Now.
To learn more about Data Analyst with Apache Spark Course – Enrol Now.
To learn more about Data Analyst with Market Risk Analytics and Modelling Course – Enrol Now.

How Hadoop Data Lake Architecture Helps Data Integration

How Hadoop Data Lake Architecture Helps Data Integration

New data objects, like data planes, data streaming and data fabrics are gaining importance these days. However, let’s not forget the shiny data object from a few years back-Hadoop data lake architecture. Real-life Hadoop data lakes are the foundation around which many companies aim to develop better predictive analytics and sometimes even artificial intelligence.

This was the crux of discussions that took place in Hortonworks’ DataWorks Summit 2018. Here, bigwigs like Sudhir Menon shared the story behind every company wanting to use their data stores to enable digital transformation, as is the case in tech startups, like Airbnb and Uber.

In the story shared by Menon, vice president of enterprise information management at hotelier Hilton Worldwide, Hadoop data lake architecture plays a key role. He said that all the information available in different formats across different channels is being integrated into the data lake.

The Hadoop data lake architecture forms the core of a would-be consumer application that enables Hilton Honors program guests to check into their rooms directly.

A time-taking procedure:

Menon stated that the Hadoop data lake project, which began around two years back, is progressing rapidly and will start functioning soon. However, it is a ‘’multiyear project’’. The project aims to buildout the Hadoop-based Hotonworks Data Platform (HDP) into a fresh warehouse for enterprise data in a step-by-step manner.

The system makes use of a number of advanced tools, including WSO2 API management, Talend integration and Amazon Redshift cloud data warehouse software. It also employs microservices architecture to transform an assortment of ingested data into JSON events. These transformations are the primary steps in the process of refining the data. The experience of data lake users shows that the data needs to be organized immediately so that business analysts can work with the data on BI tools.

This project also provides a platform for smarter data reporting on the daily. Hilton has replaced 380 dashboards with 40 compact dashboards.

For companies like Hilton that have years of legacy data, shifting to Hadoop data lake architectures can take a good deal of effort.

Another data lake project is in progress at United Airlines, a Chicago-based airline. Their senior manager for big data analytics, Joe Olson spoke about the move to adopt a fresh big data analytics environment that incorporates data lake and a ‘’curated layer of data.’’ Then again, he also pointed out that the process of handling large data needs to be more efficient. A lot of work is required to connect Teradata data analytics warehouse with Hortonworks’ platform.

Difference in file sizes in Hadoop data lakes and single-client implementations may lead to problems related to garbage collection and can hamper the performance.

Despite these implementation problems, the Hadoop platform has fueled various advances in analytics. This has been brought about by the evolution of Verizon Wireless that can now handle bigger and diverse data sets.

2

In fact, companies now want the data lake platforms to encompass more than Hadoop. The future systems will be ‘’hybrids of on-premises and public cloud systems and, eventually, will be on multiple clouds,’’ said Doug Henschen, an analyst at Constellation Research.

Large companies are very much dependent on Hadoop for efficiently managing their data. Understandably, the job prospects in this field are also multiplying.

Are you a big data aspirant? Then you must enroll for big data Hadoop training in Gurgaon. At Dexlab industry-experts guide you through theoretical as well as practical knowledge on the subject. To help your endeavors, we have started a new admission drive #BigDataIngestion. All students get a flat discount on big data Hadoop certification courses. To know more, visit our website.


Reference: searchdatamanagement.techtarget.com/news/252443645/Hadoop-data-lake-architecture-tests-IT-on-data-integration


Interested in a career in Data Analyst?

To learn more about Data Analyst with Advanced excel course – Enrol Now.
To learn more about Data Analyst with R Course – Enrol Now.
To learn more about Big Data Course – Enrol Now.

To learn more about Machine Learning Using Python and Spark – Enrol Now.
To learn more about Data Analyst with SAS Course – Enrol Now.
To learn more about Data Analyst with Apache Spark Course – Enrol Now.
To learn more about Data Analyst with Market Risk Analytics and Modelling Course – Enrol Now.

Call us to know more