Many still believe that Big Data is a grossly misunderstood, mega trending buzzword in the tech field even today. However, there is still no denying of the fact that the recent development of AI and machine learning push is related on the synthesis and labelling of huge amounts of training data. A latest trend report by the advisory firm Ovum predicted that the Big Data market which currently is valued to be USD 1.7 billion, will further rise to be USD 9.4 billion by 2020.
Then what do the insiders in the data analytics market see it happening in the upcoming year ahead? We at DexLab Analytics, the premiere Big Data Hadoop institute in Delhi spoke to several leaders in this field to discover.
Here is what we found to be the five most important trends that will shape the future of machine learning, AI and data analytics in 2017 from the industry experts:
The predictions strongly emphasize the need for more talent and skilled personnel in this vast field of data analytics, thus, a growing demand for Big Data training and Big Data courses will be witnessed worldwide.
It is no new news that the Big Data and software analytics have had a huge impact on the modern industries. There are several industry disruptors that have surfaced in the past few years and totally changed the lives of all connected humans. Like Google, Tesla and Uber! These are the companies that have used the long list of benefits presented to us by Big Data to expand and infiltrate newer markets, they have helped themselves improve customer relations and enhance their supply chains in multiple segments of market.
As per the latest IDC Research projects the sale of Big Data and analytics services will rise to USD 187 billion in 2019. This will be a huge leap from the USD 122 billion which was recorded in 2015. A major industry that stands to benefit greatly from this expansion which is the manufacturing industry, with the industry revenue projections ranging to USD 39 billion by 2019.
The industry of manufacturing has come a long way from the age of craft industries. But back then, the manufacturing process involved a slow and tedious production processes which only yielded limited amounts of products.
The effects of Big Data Analytics on the Manufacturing sector:
Automated processes along with mechanization have resulted in a generation of large piles of data, which is, much more than what most manufacturing enterprises know what to do with them.
But such data can yield beneficial insights for the manufacturing units to improve their operations and increase their productivity. Here are a few notable ones:
Image Source: mckinsey.com
Savings in cost:
Big data analytics can really help transform the manufacturing process and revolutionize the way they are carried out. The obtained information can be used to reduce the cost of production and packaging during manufacturing. Moreover, companies which implement data analytics can also reduce the cost of transport, packaging along with warehousing. This is in turn can help inventory costs and return i huge savings.
Improvement in safety and quality:
A lot of manufacturing companies are now making use of computerised sensors during the production to sift through low quality products while on the assembly line. With the right software analytics enterprises can use the data generated from such sensors to improve the quality and safety of the products instead of simply throwing away the low quality products after the production.
Image Source: blogs-images.forbes.com
Tightening up the workforce efficiency:
They can also use this data to improve management and employee efficiency. Big data analytics can be used to study the error rates on the production floor and use that information to analyse specific regions where employees are good when they perform under pressure.
Moreover, data analytics may help to speed up the production process n the production floor. S will be especially useful for large firms, which work with large volumes of data.
Better collaboration:
A great advantage of having an IT based data collection and analysis infrastructure is improved information movement within the manufacturing organization. The synergy of flow of information within the management and engineering departments as well as in the quality control sector and between the machine operators and other departments of the company helps them work more efficiently.
The manufacturing industry is much more complex than any other industry, which have implemented the big data analytics. Companies must effectively time the implementation of this software so that there are no losses. And should also pay attention as to from where they can mine the data and the right analytics tools to use for producing feasible and actionable results.
Interested in a career in Data Analyst?
To learn more about Advanced Credit Risk with ML course – Enrol Now. To learn more about Advanced IFRS9 Certification Course – Enrol Now. To learn more about Big Data Course – Enrol Now.
To learn more about Machine Learning Using Python and Spark – Enrol Now. To learn more about Data Analyst with SAS Course – Enrol Now. To learn more about Data Analyst with Apache Spark Course – Enrol Now. To learn more about Data Analyst with Market Risk Analytics and Modelling Course – Enrol Now.
The companies’ data governance program is usually linked to the implementation of the General Data Regulation Program. And throughout time several articles have been written about to link the two initiatives but till none was so clearly distinct as the recent one on LinkedIn by Dennis Slattery. He made an analogy of a wedding between Governance and Privacy, which is very fitting but also highlights the fact that, a long term marriage with optimum success is based on the foundations that strengthen it with mutual efforts.
We can also take a similar message from the famous quote by Henry Ford – coming together is just the beginning, keeping together is actual progress, and working together is success.
Data analytics should tie its hands with privacy policies for a successful approach towards good business.
So, how can we make this marriage successful?
The GDPR regulation is quite clear on what it states, about things that must be done in order to protect the Data Citizen’s Rights. However, the bigger question most companies are facing is how to comply with regulations and/or go beyond the bare minimum and let GDPR work for them.
Majority of such discussions around the topic of how to implement GDPR today are focussed on one of two approaches – either top down or bottoms up. But we would argue otherwise, as these two approaches are not mutually exclusive and that a successful implementation of the GDPR must be based on a combination of these complementary approaches.
For the top down approach, the team for GDPR will reach out to the businesses to get a clear understanding of all business (data) processes, which involve either one or another. And for each of these processes like for third party credit checks, data analytics, address verification, and much more there are several attributes which must be clarified. Like for instance:
Have they acquired consent for the particular process?
What is the business purpose for the collection?
Who is the controller?
Who is the processor?
Who is responsible as the Data protection officer?
What is the period for retention of data?
What type of data is collected?
Along with several other information
However, it must be noted that this is not a one-time effort, once all the processes related to the personal data have been identified and classified they will still be needed to be maintained as the organization grows and evolves with development in its infrastructure over time.
The bottom up approach is a little more technical in nature. The businesses that have already established metadata management tools can then use these technologies to identify personally the identifiable information (PII) and then try and classify these data elements and assign the relevant attributes for GDPR. This approach shall quickly hit a bottleneck as the same data can be utilized for several business purposes and thus, cannot be classified for GDPR.
With successful implementation of the GDPR we will be able to marry both the approaches well.
Big Data Hadoop training from DexLab Analytics from Dexlab Analytics
Interested in a career in Data Analyst?
To learn more about Machine Learning Using Python and Spark – click here. To learn more about Data Analyst with Advanced excel course – click here. To learn more about Data Analyst with SAS Course – click here. To learn more about Data Analyst with R Course – click here. To learn more about Big Data Course – click here.
Christmas is just at the end of this week, so we at team DexLab decided to help our dear readers who love some data-wizardry, with some SAS magic! You can choose to flaunt your extra SAS knowledge to your peer groups with the below described SAS program.
Celebrate Christmas in Data Analyst Style With SAS!
We are taking things a tad backwards by trying to, almost idiosyncratically complicate things that are otherwise simple. After all some say, a job of a data analyst is to do so! However, be it stupid or unnecessary this is definitely by far the coolest way to wish Merry Christmas, in data-analyst style.
Tax officials are tightening up their ropes with improved Big Data analytics to crack a whip on hoarders of black money.
Under the bill for amending Section 115BBE of the Income Tax Act, transactions with unexplained deposits in banks will be taxed.
As per this amendment, tax officials can now tax people on such deposits at a rate of 60 percent (cess additional) as opposed to the previously determined 30 percent.
This new tax law is applicable from the 1st of April, starting this year!
Cracking a Whip on Black Money Hoarders With Data Anaytics
How are the Income Tax officials leveraging Big Data Analytics to curb black money?
Here are the simple signals that showcase a rise of Big data analytics use and a more planned crack down on Black Money hoarding:
The IT department is now increasingly becoming tech savvy, it is now making use of analytics tools to assess the personal bank deposits for an improved black money crack down action plan.
The income tax officials are making use of Big Data analytics tools for the first time ever done in the history of the Indian economy, to further maintain a hawk’s eye affixed on the target of bringing down black money.
This is a new venture and earlier such advanced tools were only employed on corporate tax assessments.
Would you like to create customized SAS graphs with the use of PROC SGPLOT and other ODS graphic procedures? Then an essential skill that you must learn is to know how to join, merge, concentrate and append SAS data sets, which arise from a variety of sources. The SG procedures, which stand for SAS statistical graphic procedures, enable users to overlay different kinds of customized curves, bars and markers. But the SG procedures do expect all the data for a graph to be in one single set of data. Thus, it often becomes necessary to append two or more sets of data before one can create a complex graph.
In this blog post, we will discuss two ways in which we can combine data sets in order to create ODS graphics. An alternative option is to use the SG annotation facility, which will add extra curves and markers to the graph. We mostly recommend the use of the techniques that are given in this article for simple features and reserve annotations when adding highly complex yet non-standard features.
Using overlay curves:
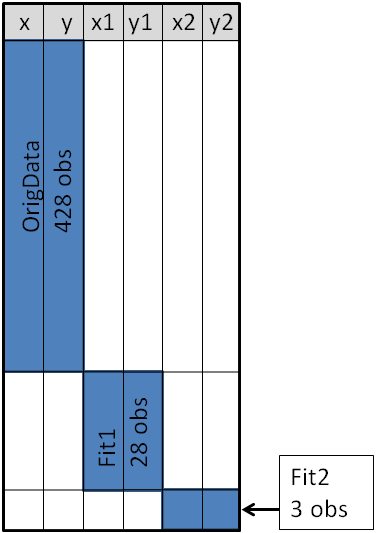
Here is a brief idea on how to structure a SAS data set, so that one can overlay curves on a scatter plot.
The original data is contained in the X and Y variables, as can be seen from the picture below. These will be the coordinates for the scatter plot. The secondary information will be appended at the end of the data. The variables X1 and Y1 contain the coordinates of a custom scatter plot smoother. The X2 and Y2 variables contain the coordinates of another scatter plot smoother.
Source: blogs.sas.com
This structure will enable you to use the SGPLOT procedure for overlaying, two curves on the scatter plot. One may make use of a SCATTER statement along with two SERIES statements to build the graphs.
Sometimes in addition to the overlaying curves, we like to add special markers to the scatter plot. In this blog we plan to show people how to add a marker that shows the location of the sample mean. It will discuss how to use PROC MEANS to build an output data set, which contains the coordinates of the sample mean, then we will append the data set to the original data.
With the below mentioned statements we can use PROC MEANS for computing the sample mean of the four variables in the data set of SasHelp.Iris. This data contains the measurements for 150 iris flowers. To further emphasize on the general syntax of this computation, we will make use of macro variables but note that it is not necessary:
With the AUTONAME option on the output statement, we can tell PROC MEANS to append the name of the statistics to names of the variables. As a result, the output datasets will contain the variables, with names like PetalLength_Mean or SepalWidth_Mean.
As depicted in the previous picture, this will enable you to append the new data into the end of the old data in the “wide form”, as shown here:
data Wide;
set &DSName Means; /* add four new variables; pad with missing values */run;
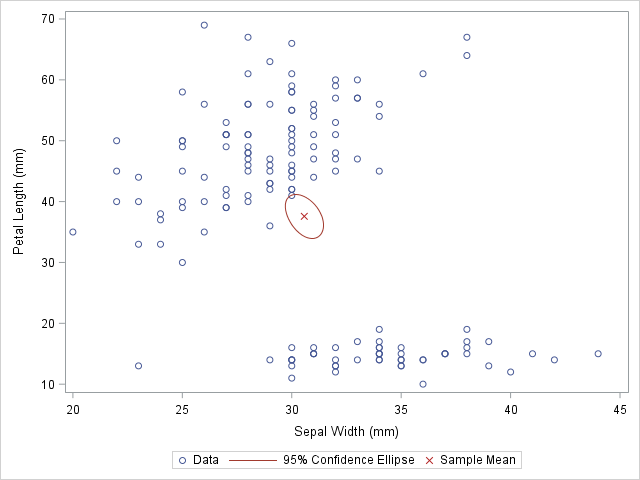
ods graphics / attrpriority=color subpixel;
proc sgplotdata=Wide;
scatter x=SepalWidth y=PetalLength / legendlabel="Data";
ellipse x=SepalWidth y=PetalLength / type=mean;
scatter x=SepalWidth_Mean y=PetalLength_Mean /
legendlabel="Sample Mean" markerattrs=(symbol=X color=firebrick);
run;
And as here:
Source: blogs.sas.com
The original data is used in the first SCATTER statement and the ELLIPSE statement. You must remember that the ELLIPSE statement draws an approximate confidence ellipse for the population mean. The second SCATTER statement also makes use of sample means, which must be appended to the end of the original data. The second SCATTER statement will draw a red marker at the location of the sample mean.
This method can be used to plot other sample statistics (like the median) or to highlight special values such as the origin of a coordinate system.
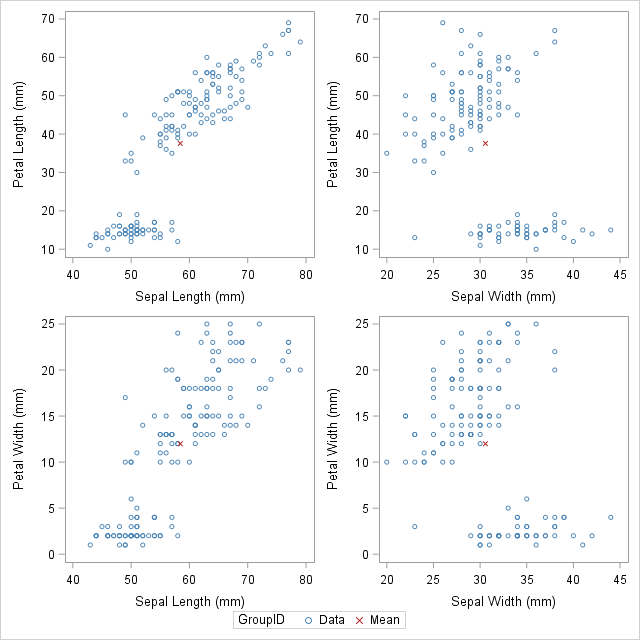
Using overlay markers: of the long form
In certain circumstances, it is better to append the secondary data in the “long form”. In the long form the secondary data sets contains variables similar to the names in the original data set. One can choose to use the SAS data step to build a variable that will pinpoint the original and supplementary observations. With this technique it will be useful when people would want to show multiple markers (like, sample, mean, median, mode etc.) by making use of the GROUP = option on one of the SCATTER statement.
The following call to the PROC MEANS does not make use of an AUTONAME option. That is why the output data sets contain variables which have the same name as the input data. One can make use of the IN= data set option, for creating the ID variables that identifies with the data from the computed statistics:
/* Long form. New data has same name but different group ID */proc meansdata=&DSName noprint;
var&VarNames;
output out=Means(drop=_TYPE_ _FREQ_)mean=;
run;
data Long;
set &DSName Means(in=newdata);
if newdata then
GroupID = "Mean";
else GroupID = "Data";
run;
The DATA step is used to create the GroupID variable, which has several values “Data” for the original observations and the value “Mean” for the appended observations. This data structure will be useful for calling the PROC SGSCATTER and this will support the GROUP = option, however it does not support multiple PLOT statements as the following:
In closing thoughts, this blog is to demonstrate some useful techniques, to add markers to a graph. The technique requires people to use concatenate the original data with supplementary data. Often for creating ODS statistical graphics it is better to use appending and merging data technique in SAS. This is a great technique to include in your programming capabilities.
SAS courses in Noidacan give you further details on some more techniques that are worth adding to your analytics toolbox!
To learn more about Data Analyst with Advanced excel course – Enrol Now. To learn more about Data Analyst with R Course – Enrol Now. To learn more about Big Data Course – Enrol Now.
To learn more about Machine Learning Using Python and Spark – Enrol Now. To learn more about Data Analyst with SAS Course – Enrol Now. To learn more about Data Analyst with Apache Spark Course – Enrol Now. To learn more about Data Analyst with Market Risk Analytics and Modelling Course – Enrol Now.
It will be a simple understatement to say that Hadoop took the Big Data market up by storm this past years from 2012-2016. This time-period in the history of data witnessed a wave of mergers, acquisitions and high valuation rounds of finances. It will not be a simple exaggeration to state that today Hadoop is the only cost sensible and scalable open-source alternative option against the other commercially available Big Data Management tools and packages.
Recently it has not only emerged as the de-facto for all industry standard business intelligence (BI), and has become an integral part of almost all commercially available Big Data solutions.
Until 2015, it had become quite clear that Hadoop did fail to deliver in terms of revenues. From 2012 to 2015, the growth and development of Hadoop systems have been financed by venture capitalists mostly. It also made some funds through acquisition money and R&D project budgets.
But it is no doubt that Hadoop talent is sparse and also does not come in cheap. Hadoop smarts a steep learning curve that most cannot manage to climb. Yet, still more and more enterprises are finding themselves be attracted towards the gravitational pull of this massive open-source system, of Hadoop. It is mostly due to the functionality that it offers. Several interesting trends have emerged in the Hadoop market within the last 2 years like:
The transformation from batch processing to online processing
The emergence of MapReduce alternatives like Spark, DataTorrent and Storm
Increasing dissatisfaction among the people with the gap between SQL-on-Hadoop and the present provisions
Hadoop’s case will further see a spur with the emergence of IoT
In-house development and deployment of Hadoop
Niche enterprises are focussing on enhancing Hadoop features and its functionality like visualization features, governance, ease of use, and its way to ease up to the market.
While still having a few obvious setbacks, it is of no doubt that, Hadoop is here to stay for the long haul. Moreover, there is rapid growth to be expected in the near future.
Image Source: aws.amazon.com
As per market, forecasts the Hadoop market is expected to grow at CAGR (compounded annual growth rate) of 58% thereby surpassing USD 16 billion by 2020.
The major players in the Hadoop industry are as follows: Teradata Corporation, Rainstor, Cloudera, Inc. and Hortonworks Inc., Fujitsu Ltd., Hitachi Data Systems, Datameer, Inc., Cisco Systems, Inc., Hewlett-Packard, Zettaset, Inc., IBM, Dell, Inc., Amazon Web Services, Datastax, Inc., MapR Technologies, Inc., etc.
Several opportunities are emerging for Hadoop market with the changing global environment where Big Data is affecting the IT businesses in the following two ways:
The need to accommodate this exponentially increasing amount of data (storage, analysis, processing)
Increasingly cost-prohibitive models for pricing that are being imposed by the established IT vendors
Image Source: tdwi.org
The forecast for Hadoop market for the years 2017-2022 can be summarised as follows:
Hadoop market segment as per geographical factors: EMEA, America and Asia/Pacific
As per software and hardware services: commercially supported software for Hadoop, Hadoop appliances and hardware, Hadoop services (integration, consulting, middleware, and support), outsourcing and training
By verticals
By tiers of data (quantity of data managed by organizations)
As per application: advanced/predictive analysis, ETL/data integration, Data mining/visualization. Social media and click stream analysis. Data warehouse offloading; IoT (internet of things) and mobile devices. Active archives along with cyber security log analysis.
Image Source: tdwi.org
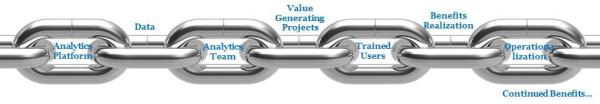
This chain link graph shows that each component in an industry is closely linked to data analytics and management and plays an equally important role in generating business opportunities and better revenue streams.
Contact Us Through Our Various Social Media Channels Or Mail To Know More About Availing This Offer!
THIS OFFER IS FOR COLLEGE STUDENTS ONLY!
Interested in a career in Data Analyst?
To learn more about Machine Learning Using Python and Spark – click here. To learn more about Data Analyst with Advanced excel course – click here. To learn more about Data Analyst with SAS Course – click here. To learn more about Data Analyst with R Course – click here. To learn more about Big Data Course – click here.
The economy took a hit with the recent demonetization of the INR 500 and 1000 currency notes. The jury of economists around the world are still debating whether the move was good or not, but it has definitely caused a huge inconvenience for the public. Moreover, exchanging such a large amount of old currency notes is nothing shy of a mammoth Herculean task, as almost 85 percent of the economy is in the form of high denomination currency.
Black Money in India Can be Traced With Ease by Applying Big Data Analytics
These measures have been taken by the government to curb the flow of Black Money in India and get rid of corruption from its roots. While there is still a mixed reaction from the common people about this move about it being good or bad, technological experts have a different viewpoint about preventing the flow of Black Money in the country. They say that with use modern technologies like Big Data Analytics it will be possible to trace Black Money painlessly and with much ease.
Today is a time when omnipresent has a whole new definition. We no longer think about the almighty, omnipotent and omnipresent God when we speak about being everywhere. Nowadays we mostly mean data when we hear the term “present everywhere”. The amount of digital data that populates the earth today is growing at a tremendous rate, doubling over every two years and transforming the way we live.
As per IBM, an astounding amount of 2.5 Billion gigabytes of data is generated every day since the year 2012. Another revelation made by an article published in the Forbes magazine stated that data is growing faster than ever before today, and by the year 2020 almost 1.7 megabytes of new information will be created every second by every human being on this earth. And that is why it is imperative to know the fundamental basics of this field as clearly this is where our future lies.
In this article, we will know the main differentiating factors between data science, Big Data analysis and data analytics. We will discuss in detail about the points such as what they are, where they are used, and the skills one needs to be a professional in these fields, and finally the prospect of salary in each case.
First off we start with the understanding of what these subjects are:
What is data science?
Data science involves dealing with unstructured and structured data. It is a field that consists of everything that relates to cleansing of data, preparation and analysis. It can be defined as the combination of mathematics, analytics, statistics, programming, capture of data and problem solving. And all of that in the most ingenious ways with an amazing ability to look at things from a unique perspective. They professionals involved with this field should be proficient in data preparation, cleansing, and alignment of data.
To put it simply, this is the umbrella of techniques which is used to extract insights and information from the data.
What do we mean by Big Data?
As the name suggests, Big Data is nothing but a mammoth amount of data. This is so huge that it cannot be processed effectively with the existing traditional applications. The processing of Big Data starts with working with raw data that is not very well aggregated and is almost impossible to store in the memory of only one single computer.
It is now a popular buzzword filling up the job portals with vacancies. And is used to denote basically a large number of data, both structured and unstructured. It inundates a business on a daily basis. It is a prime source of information that can be used to take better decisions and proper strategic business moves.
As per Gartner, Big Data can be defined as high velocity, high volume and high variety information assets which demand cost efficient, innovative forms of information processing that enable improved insight, better decision making, and a procedural automation.
Data Analytics is the science of assessing raw data with the purpose of drawing actionable insights from the same.
It basically involves application of algorithms in a mechanical and systematic process to gather information. For instance, it may involve a task like running through a large number of data sets to look for comprehensible correlations between one another.
The main focus for data analytics is concentrated on interference, which is the procedure for deriving conclusions which are mainly based on what the researchers already are aware of.
Where can I apply my data science skills?
On internet searching: search engines use data science algorithms
For digital ads: data science algorithms is an important aspect for the whole digital marketing spectrum.
Recommender systems: finding relevant products from a list of billions available can be found easily. Several companies and ecommerce retailers use data to implement this system.
Big Data applicability:
The following sectors use Big Data application:
Customer analysis
Fraud analytics
Compliance analytics
Financial services, credit risk modelling
Operational analytics
Communication systems
Retailers
Data analysis scope and application:
Healthcare sector for efficient service and reduction of cost pressure
Travel sector for optimizing buying experience
Gaming industry for deriving insights about likes and dislikes of gamers
For management of energy, with smart grid management, energy optimization distribution and also used by utility companies.
Here is an infographic that further describes all there is to know about these trending, job-hungry sectors that are growing at a tremendous rate:
Now that you know what the path to career success, looks like stop waiting and get a R Analytics Certification today.
Interested in a career in Data Analyst?
To learn more about Data Analyst with Advanced excel course – Enrol Now. To learn more about Data Analyst with R Course – Enrol Now. To learn more about Big Data Course – Enrol Now.
To learn more about Machine Learning Using Python and Spark – Enrol Now. To learn more about Data Analyst with SAS Course – Enrol Now. To learn more about Data Analyst with Apache Spark Course – Enrol Now. To learn more about Data Analyst with Market Risk Analytics and Modelling Course – Enrol Now.