Big data courses Archives - Page 17 of 18 - DexLab Analytics | Big Data Hadoop SAS R Analytics Predictive Modeling & Excel VBA

Big Data And The Internet Of Things

bigdata

The data that is derived from the Internet of Things may easily be used to make analysis and performance of equipment as well as do activity tracking for drivers and users with wearable devices. But provisions in IT need to be significantly increased.Intelligent Mechatronic Systems(IMS) collects on an average data points no fewer than 1.6billion on a daily basis from automobiles in Canada and U.S.

Deep Learning and AI using Python

The data is collected from hundreds of thousands of cars that have on board devices tracking acceleration, the distance traversed, the use of fuel as well as other information related to the operation of the vehicle.This data is then used as a means of supporting insurance programs that are based on use.Christopher Dell, IMS’s senior director recently stated they they were aware that the data available were of value, but what was lacking is the knowledge on how to utilize it.

But in the August of 2015, after a project that lasted for a year, IMS added to its arsenal a NoSQL database with Pentaho providing tools related to data integration and analytics. This lets the data scientists of the company increased flexibility to format the information. This enables the team of analytics to make micro analysis of the driving behavior of customers so that trends and patterns that might potentially enable insurers to customize the rates and policies based on usage.

In addition to this the company further is pursuing an aggressive growth policy through asmartphone app which will further enhance its abilities to collect data from vehicles and smart home systems making use of the Internet of Things.Similar to the case of IMS, organizations that look forward to analyze and collect data gathered from the IoT or the Internet of Things but often find that they need an upgrade of their IT architecture. This principle applies to enterprise as well as consumer sides of the IoT divide.

The boundaries of business increasingly fade away as data is gathered from fitness trackers, diagnostic gears, sensors used in industries, smartphones. The typical upgrade includes updating to big data management technologies like Hadoop, the processing engine Spark,NoSQL databases in addition to advanced tools of analytics with support for applications drivenby algorithms. In other cases all it is needed for the needs of data analytics is the correct combination of IoT data.

2

Join DexLab Analytics’ Big Data certification course and kick start your career in the rapidly developing sector of data science.


Interested in a career in Data Analyst?

To learn more about Data Analyst with Advanced excel course – Enrol Now.
To learn more about Data Analyst with R Course – Enrol Now.
To learn more about Big Data Course – Enrol Now.

To learn more about Machine Learning Using Python and Spark – Enrol Now.
To learn more about Data Analyst with SAS Course – Enrol Now.
To learn more about Data Analyst with Apache Spark Course – Enrol Now.
To learn more about Data Analyst with Market Risk Analytics and Modelling Course – Enrol Now.
The Role of Big Data in the Largest Database of Biometric Information

BIG DATA

Aadhaar project from our very own India happens to on the most ambitious projects relying on Big Data ever to be undertaken. The goal is for the collection, storage and utilization of the biometric details of a population that has crossed the billion mark years ago. It is needless to say that a project of such epic proportions presents tremendous challenges but also gives rise to an incredible opportunity according to MapR, the company that is serving the technology behind the execution of this project.

2

Aadhaar is in its essence a 12 digit number assigned to a person / an individual by the UIDA , the abbreviated form of “Unique Identification Authority of India” The project was born in 2009 and had former Infosys CEO and co-founder Nandan Nilekani as its first chairman and the architect of this grand project which needed much input in terms of the tech involved.

The intention is to make it an unique identifier for all Indian citizens and prevent the use of false identities and fraudulent activities. MapR which is head-quartered in California is the distributor and developer of “Apache APA +0.00% Hadoop” has been putting into use its extensive experience in integrating web-scale enterprise storageand real-time database tech, for the purposes of this project.

According to John Schroeder who is the CEO and co-founder of MapR, the project presents multiple challenges including analytics, storage and making sure that the data involved remains accurate and secure amidst authentications that amount to several millions over the course of each passing day.Individual persons are provided with their number and a iris-scan or fingerprint is taken so that their identity might be proved and queried to and matched from the database backbone to a headshot photo of the person. Each day witnesses over a hundred million verifications of identity and all this needs to be done in real-time in about 200 milliseconds.

India has a percentage of rural population many of which are yet to be connected to the digital grid and as Schroeder continues the solution had to be economical and be reliable even under low bandwidth situations and technology behind it needed to be resilient which would work even with areas with low levels of connectivity.

6

For more information on big data and big data hadoop courses, peruse through the official site of DexLab Analytics. It is a major Big Data Hadoop institute in Gurgaon.


Source: Forbes


Interested in a career in Data Analyst?

To learn more about Data Analyst with Advanced excel course – Enrol Now.
To learn more about Data Analyst with R Course – Enrol Now.
To learn more about Big Data Course – Enrol Now.

To learn more about Machine Learning Using Python and Spark – Enrol Now.
To learn more about Data Analyst with SAS Course – Enrol Now.
To learn more about Data Analyst with Apache Spark Course – Enrol Now.
To learn more about Data Analyst with Market Risk Analytics and Modelling Course – Enrol Now.

Sure shot Ways to Crack Big Data Interviews

Sure shot Ways to Crack Big Data Interviews

If you are a Big Data analyst looking for open position in the entry to mid level range of experience then you should prepare yourself with the following resources in your arsenal before you storm an interview with all guns blazing.

  • Adequate Expertise of Analytical tools like SAS for the processing of data

Make sure that you assign most of the time you have set aside for the preparation of your upcoming interview to brush up your knowledge regarding the tools of analytics that are relevant in your context. Ensure that you acquire proficiency in the analytics tool of your choice. For positions of junior levels the importance of expertise with a particular analytical tool like Hadoop, R or SAS cannot be overstressed. In such circumstances the focus centers around data preparation and processing. It is highly advisable that you review concepts related to the import and manipulation of data, the ability to read data even if it not standard say for example data whose input file types are multiple in number and mixed data formats. You also get to show off your skills at efficiently joining multiple datasets, selecting conditionally the observations or rows of data, how to go about heavy duty data processing of which SQL or macros are the most critical.

  • Make a Proper Review of End to End Business Process

This is most relevant towards candidates who have prior experience at working in the Big Data and Analytics industry. Prior experience inevitably gives rise to interviewers wanting to know more about the responsibilities that you shouldered and your role in the business process and how you fitted in the context of the broader picture. You should be able to convey to the interviewer that the data source is understood by you along with its processing and use.

  • A solid concept of the rudiments of statistics and algorithms

Again this tip is also for those with prior experience. Recruiters seek to know whether you are aware of issues likely to be faced by you while you confront problems regarding data and business. Even freshers are expected to know the fundamental concepts of statistics like rejection criteria, hypothesis testing outcomes, measures of model validation and the statistics related assumptions that a candidate must know about in order to implement algorithms of various sorts. In order to crack the interview you must be prepared with adequate knowledge of concepts related to statistics.

  • Prepare Yourself with At Least 2 Case Studies related to Business

The person on the other side of the interview table will undoubtedly try to make an assessment about your knowledge as far as business analytics is concerned and not solely to the proficiency you command in your tool of choice. Devote time to review projects on analytics you already have worked on if you have prior experience. Be prepared to elucidate on the business problem, the steps that were involved in the processing of data and the algorithm put into use in the creations of the models and reasons behind, and the way the results of the model was implemented. The interviewer might also ask about the challenges faced by you at any stage of the whole process, so keep in mind the issues faced by you in the past and their eventual resolution.

2

  • Make Sure that Your Communication Remains Effective

If you are unable to effectively communicate then no much diligent preparations you make, they will be of no use. You can try out mock interviews and answering questions that the recruiter might ask. Spare yourself of the trouble of framing effective answers at the moment when the question is asked during an interview. Though you perhaps will be unable to anticipate each and every question, nevertheless but prior preparation will result in better and more coherent answers.


Interested in a career in Data Analyst?

To learn more about Data Analyst with Advanced excel course – Enrol Now.
To learn more about Data Analyst with R Course – Enrol Now.
To learn more about Big Data Course – Enrol Now.

To learn more about Machine Learning Using Python and Spark – Enrol Now.
To learn more about Data Analyst with SAS Course – Enrol Now.
To learn more about Data Analyst with Apache Spark Course – Enrol Now.
To learn more about Data Analyst with Market Risk Analytics and Modelling Course – Enrol Now.
The Pros and Cons of HIVE Partitioning

The Pros and Cons of HIVE Partitioning Hive organizes data using Partitions. By use of Partition, data of a table is organized into related parts based on values of partitioned columns such as Country, Department. It becomes easier to query certain portions of data using partition.

Partitions are defined using command PARTITIONED BY at the time of the table creation.

We can create partitions on more than one column of the table. For Example, We can create partitions on Country and State.

2

Syntax:

CREATE [EXTERNAL] TABLE table_name (col_name_1 data_type_1, ….)

PARTITIONED BY (col_name_n data_type_n , …);

Following are features of Partitioning:

  • It’s used for distributing execution load horizontally.
  • Query response is faster as query is processed on a small dataset instead of entire dataset.
  • If we selected records for US, records would be fetched from directory ‘Country=US’ from all directories.

Limitations:

  • Having large number of partitions create number of files/ directories in HDFS, which creates overhead for NameNode as it maintains metadata.
  • It may optimize certain queries based on where clause, but may cause slow response for queries based on grouping clause.

It can be used for log analysis, we can segregate the records based on timestamp or date value to see the results day wise / month wise.

Another use case can be, Sales records by Product –type , Country and month.


Interested in a career in Data Analyst?

To learn more about Data Analyst with Advanced excel course – Enrol Now.
To learn more about Data Analyst with R Course – Enrol Now.
To learn more about Big Data Course – Enrol Now.

To learn more about Machine Learning Using Python and Spark – Enrol Now.
To learn more about Data Analyst with SAS Course – Enrol Now.
To learn more about Data Analyst with Apache Spark Course – Enrol Now.
To learn more about Data Analyst with Market Risk Analytics and Modelling Course – Enrol Now.

Big Data and the Cloud- An Eclectic Mix

Big Data and the Cloud- An Eclectic Mix
The FINRA or The Financial Industry Regulatory Authority, Inc. makes analysis of up to no less than 75 billion events each and every day. It is little wonder then that it finds its data center nearly filled to capacity. FINRA is looking forward to migrating to the cloud in order to continue to provide the protection for investors and continually respond to the market that it is famed for.

According to Matt Cardillo who is the Senior Director at FINRA, they are eyeing the elasticity that is enabled by cloud storage. He further continued also on their radar was an approach change in order to respond to market and volume data change along with changes in the behavior of users. Volatile markets result in usage spikes and also attract a whole lot more of users in their system.

2

The surveillance program undertaken by FINRA performs analysis of data for suspicious activities as well as potential fraud. Their algorithms go through and analyze the data for any abnormalities or activities that might not be normal. They have in place alerts and exceptions that take stock of situations and then have access to analytics that help to determine if there is indeed a problem or whether it is a false call.

Stay Ahead of the Big Data Curve

Almost every day a new tool emerges to take stock of Analytics in the brave new world of Big Data Tech. According to Cardillo the kudos for staying ahead of the big data curve goes to the skilled staff at FINRA. He says that his people are innovative and are only too keen to embrace the latest advancements in technology. He confesses that after reverting to the cloud some of their present tech as well as tools will become irrelevant. But they are banking big on open source especially frameworks like Hive, Hadoop and Spark to get most out of the elasticity needed by their business.


Interested in a career in Data Analyst?

To learn more about Data Analyst with Advanced excel course – Enrol Now.
To learn more about Data Analyst with R Course – Enrol Now.
To learn more about Big Data Course – Enrol Now.

To learn more about Machine Learning Using Python and Spark – Enrol Now.
To learn more about Data Analyst with SAS Course – Enrol Now.
To learn more about Data Analyst with Apache Spark Course – Enrol Now.
To learn more about Data Analyst with Market Risk Analytics and Modelling Course – Enrol Now.

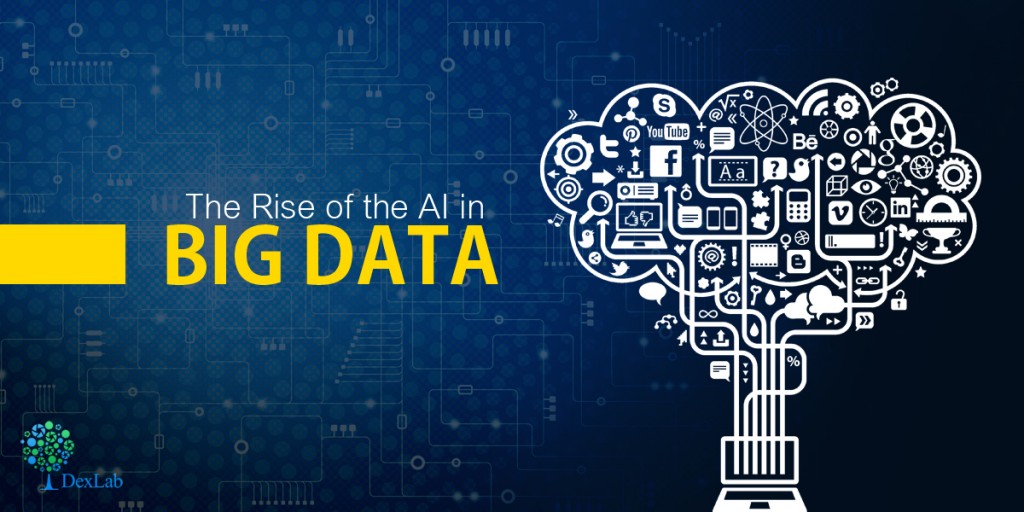
The Rise of the AI in Big Data

The Rise of the AI in Big Data

The researchers working at the MIT “Computer Science and Artificial Intelligence Laboratory” or abbreviated simply as CSAIL are all set to make human intuition out of the analysis of big data equation by enabling computers to choose from the set of features that are put into use in order to identify patterns in the data that may be considered to be predictive. This is dubbed as the “Data Science Machine” and as things have progressed so far the software prototype has managed to beat 615 of 908 competing teams vying for the same ability across no less than three competitions of data science.

2

Big Data may be considered as a complex and huge ecosystem that combines innovative processes from fields as diverse as storage, data analysis, curation, networking as well as search in addition to other functions and processes. As things stand much of analysis of big data is already algorithmic and automated but at the end of the day it is business users and data scientists who are needed in order to determine the particular dataset and analysis features which are required for visualization in the end and take action on the communicated data.

To put it simply at the end of the whole process humans are needed in order to make choices about data point combinations to chart out the relevant information.

The Data Science Machine is intended to naturally complement human intelligence and to make the most of the Big Data that is available for us waiting to be used.

The analysis of Big Data and Engineering of Features

As mentioned earlier actionable information lies at the hands of the big data scientist who is writing the code for analysis. It is this code that guides the analysis of the big data engine. In essence the advancement made by the MIT researchers is that not only does it serve to provide answers to questions regarding the data but also suggests additional questions accordingly.

This may be put into varied uses like to estimate the capacity of wind farms to generate power or making predictions about students who are likely to drop out of online courses.

5 Hottest Online Applications Inspired by Artificial Intelligence – @Dexlabanalytics.

The ultimate destination for all your data-related queries and assistance is DexLab Analytics. Being a premier Data Science training institute Gurgaon, DexLab Analytics takes pride in offering excellent data analytics courses for aspiring candidates.


Interested in a career in Data Analyst?

To learn more about Data Analyst with Advanced excel course – Enrol Now.
To learn more about Data Analyst with R Course – Enrol Now.
To learn more about Big Data Course – Enrol Now.

To learn more about Machine Learning Using Python and Spark – Enrol Now.
To learn more about Data Analyst with SAS Course – Enrol Now.
To learn more about Data Analyst with Apache Spark Course – Enrol Now.
To learn more about Data Analyst with Market Risk Analytics and Modelling Course – Enrol Now.

The Possibilities of Big Data

It is no secret that Big Data has some wonderful applications that may change the way we interact with businesses, and even more how they interacts with us through other facets of this rapidly growing field. But, what can it do concretely? This blog post shares insights of this question.
 
The Possibilities of Big Data

Endless Possibilities of Big Data

 It can tell you what may most probably happen

Continue reading “The Possibilities of Big Data”

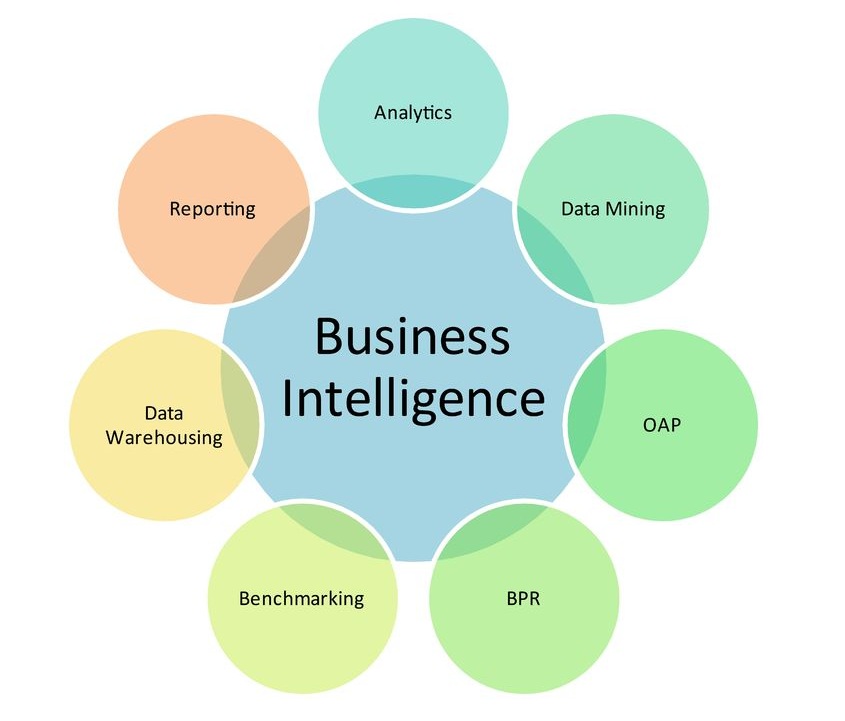
Success factors for Business Intelligence program

Success factors for Business Intelligence program

To implement a successful Business Intelligence program, one needs to understand the dimensions that are critical to success of the BI program. Here we will discuss six critical success factors for the BI program.

Critical Dimension 1 – Strong Executive Support

If there is one dimension or critical attribute that has major influence on successfully implementing the BI program would be strong executive support. If there is any lack of enthusiasm at the top will filter downwards. A key component of obtaining strong executive support is a convincing and detailed business case for BI.

bc237409f3248ab18758b8ba3d22d3ee

Critical Dimension 2 – Key Stakeholder Identification

Early identification and prioritisation of the key stakeholders are crucial. If we do not know who will benefit from a BI solution, it is unlikely that we can persuade anyone that is in their best interest to support the BI initiative.

5

Critical Dimension 3 – Creation of Business Intelligence Competency Center (BICC) Many organizations have created a separate BICC to manage the lifecycle of analytics processes. Organizations must keep in mind while creating a BICC is that the need of Business Intelligence. They should ask all the strategic and tactical question before creating a BICC. Some of the key objective of BICC shall be


  • Maximise the efficiency, deployment and quality of BI across all lines of business.
  • Deliver more value at less cost and in less time through more successful BI deployments.
Also read: Business Intelligence: Now Every Person Can Use Data to Make Better Decisions

Critical Dimension 4 – Clear Outcome Identification

This dimension determines what outcomes the organization desires, and whether they are tactical or strategic.

  • Knowledge – What knowledge is needed for desired outcomes and where is it?
  • Information – What information structures can be identified from knowledge gathering and how can these same structures be beneficial.
  • Data – What sources of raw data are needed to populate the information structures?

Pursuing the answers to these questions requires both logic and creativity. We also need specific information at various steps in the BI process.

Also read: Trends to Watch Out – Global Self-service Business Intelligence (BI) Market 2017

Critical Dimension 5 – Integrating CSFs (Critical Success Factors) and KPIs to Business Drivers

Many business initiatives aim to obtain benefits – greater efficiency, quicker access to information that are hard to quantify. We can easily accept that greater efficiency is a good thing, but trying to quantify its precise cash value to the organization can be a challenge. These benefits are essentially intangible but need to be measured.

Therefore, when identifying these key values, they can be classified as “driving” strategy, organization or operations.

Strategic Drivers Influence:
  • Market attractiveness
  • Competitive strengths
  • Market share
Organisational Drivers Influence:
  • Culture
  • Training and development
Operational Drivers Influence:
  • Customer satisfaction
  • Product Excellence
Also read: Role of R In Business Intelligence

Critical Dimension 6 – Analytics Awareness

Organizations have a tendency to measure what is easy to measure – internal transactional data. Extending the sensitivity of the organization to external and internal data presents a fuller picture to decision makers of the organization and the competitive environment. If measures are appropriate, the organisation can start to improve the processes.

When the above mentioned six critical dimension of BI solution are place. Organizations can benefit the value from the BI solutions are exponential in manner.

6

For better implementation of BI Program, why not take up effective market risk courses offered by DexLab Analytics! Market Risk Analytics is a growing field of study; for more details visit the site.


Interested in a career in Data Analyst?

To learn more about Data Analyst with Advanced excel course – Enrol Now.
To learn more about Data Analyst with R Course – Enrol Now.
To learn more about Big Data Course – Enrol Now.

To learn more about Machine Learning Using Python and Spark – Enrol Now.
To learn more about Data Analyst with SAS Course – Enrol Now.
To learn more about Data Analyst with Apache Spark Course – Enrol Now.
To learn more about Data Analyst with Market Risk Analytics and Modelling Course – Enrol Now.
Big Data at Autodesk: 360 Degree view of Customers in the Cloud

The last few years have seen a huge paradigm shift for many software vendors. The move away from a product-based model towards software-as-a-service (SAAS) in the cloud has brought huge changes. The main advantage of moving from a product based model to software-as-a-service is that the companies will be able to identify the service usage of how and why a product is being used. Earlier software companies used to run a survey or focus groups of customer feedback to identify the how and why a product is being used. This customer feedback survey has various limitations on identifying the product usage or where the product improvement has to be made.

Here’s All You Need to Know about Quantum Computing and Its Future

Autodesk was one of the frontrunners in the field, having been experimenting with the cloud based SAAS as far back as 2001 when it is acquired the BUZZSAW file sharing and synchronization service. Since then Microsoft, Adobe and many others moving into a subscription based, on-demand service and Autodesk has done the same with its core computer aided design products.

Software-as-a-service is a software licensing and delivery model in which software is licensed on a subscription basis and is centrally hosted. It is sometimes referred to as on-demand software. On-premise software is the exact opposite where the delivery of product is inside the particular organizations infrastructure.

Understanding how customers use a product is critical to giving them what they want. In a SAAS environment where everything is happening online and in the cloud, companies can gain a far more accurate picture  

2


The idea of moving to cloud based subscription model gives the business to understand more about the product usage of customers. This gives them the edge to serve better to the customers. The shift in the industry shall not be ignored. Big Data is really being used now to understand how and where to improve the product.


The Indian IT industry is focusing mainly on Cloud, Analytics, Mobile and Social segment to further drive growth. This Software-as-a-service delivery model can certainly give the edge to do data analysis on where and how the product is used.


There are number of reasons why Software-as-a-service is beneficial to organizations:


  • No additional hardware costs, you can buy the processing power or hardware as per the requirement. Do not have to go for high end configuration as there is no requirement. Need based subscription.
  • Usage is scalable. You can scale whenever you require.
  • Applications can be customised.
  • Accessible from any location, rather than being restricted to installations on individual computers an application can be accessed from anywhere with an internet enabled device.


The adoption of cloud based delivery model is accelerating mainly because of the analytical capability it gives the business to understand the customers. Analytics rocks!.


For state of the art big data training in Pune, look no further than DexLab Analytics. It is a renowned institute that excels in Big data hadoop certification in Pune. For more information, visit their official site.


Interested in a career in Data Analyst?

To learn more about Machine Learning Using Python and Spark – click here.
To learn more about Data Analyst with Advanced excel course – click here.
To learn more about Data Analyst with SAS Course – click here.
To learn more about Data Analyst with R Course – click here.
To learn more about Big Data Course – click here.

Call us to know more