Big data certification Archives - Page 18 of 18 - DexLab Analytics | Big Data Hadoop SAS R Analytics Predictive Modeling & Excel VBA

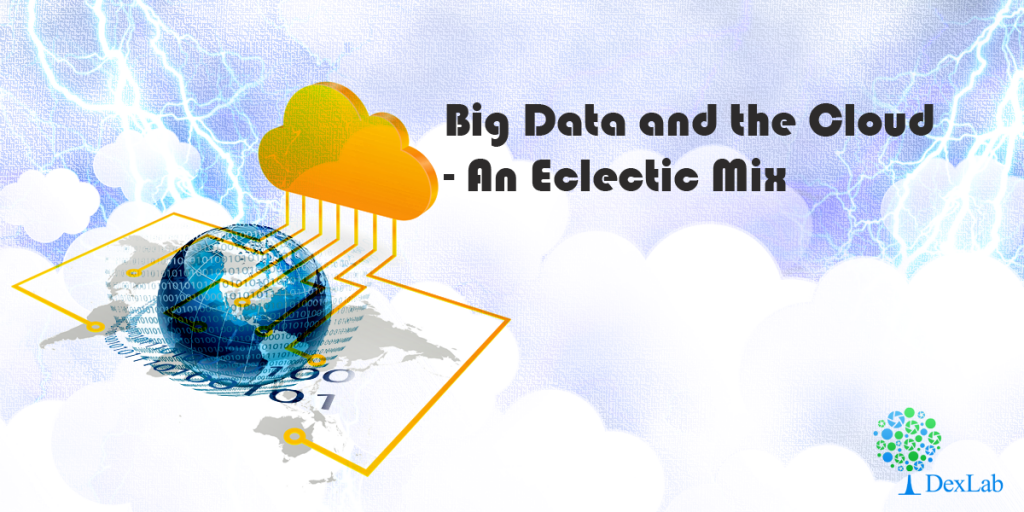
Big Data and the Cloud- An Eclectic Mix

Big Data and the Cloud- An Eclectic Mix
The FINRA or The Financial Industry Regulatory Authority, Inc. makes analysis of up to no less than 75 billion events each and every day. It is little wonder then that it finds its data center nearly filled to capacity. FINRA is looking forward to migrating to the cloud in order to continue to provide the protection for investors and continually respond to the market that it is famed for.

According to Matt Cardillo who is the Senior Director at FINRA, they are eyeing the elasticity that is enabled by cloud storage. He further continued also on their radar was an approach change in order to respond to market and volume data change along with changes in the behavior of users. Volatile markets result in usage spikes and also attract a whole lot more of users in their system.

2

The surveillance program undertaken by FINRA performs analysis of data for suspicious activities as well as potential fraud. Their algorithms go through and analyze the data for any abnormalities or activities that might not be normal. They have in place alerts and exceptions that take stock of situations and then have access to analytics that help to determine if there is indeed a problem or whether it is a false call.

Stay Ahead of the Big Data Curve

Almost every day a new tool emerges to take stock of Analytics in the brave new world of Big Data Tech. According to Cardillo the kudos for staying ahead of the big data curve goes to the skilled staff at FINRA. He says that his people are innovative and are only too keen to embrace the latest advancements in technology. He confesses that after reverting to the cloud some of their present tech as well as tools will become irrelevant. But they are banking big on open source especially frameworks like Hive, Hadoop and Spark to get most out of the elasticity needed by their business.


Interested in a career in Data Analyst?

To learn more about Data Analyst with Advanced excel course – Enrol Now.
To learn more about Data Analyst with R Course – Enrol Now.
To learn more about Big Data Course – Enrol Now.

To learn more about Machine Learning Using Python and Spark – Enrol Now.
To learn more about Data Analyst with SAS Course – Enrol Now.
To learn more about Data Analyst with Apache Spark Course – Enrol Now.
To learn more about Data Analyst with Market Risk Analytics and Modelling Course – Enrol Now.

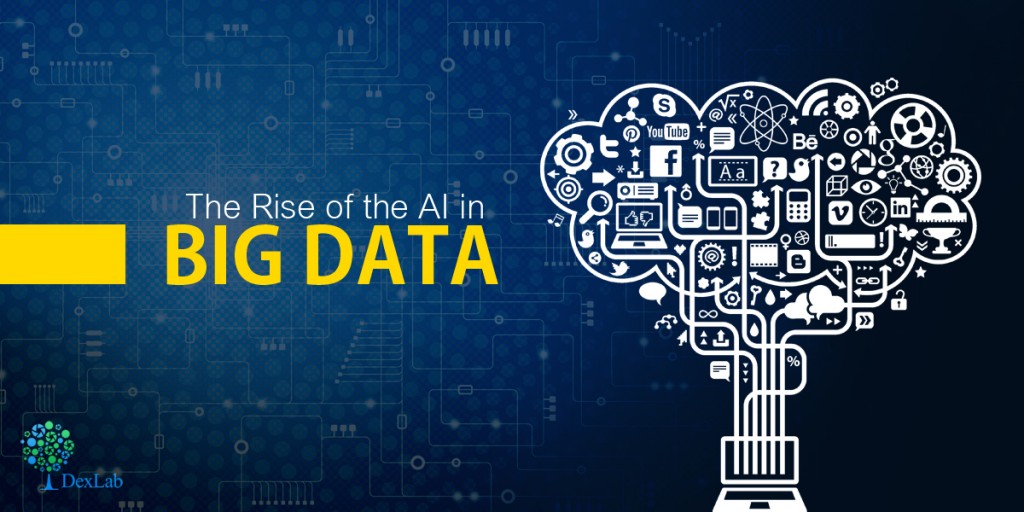
The Rise of the AI in Big Data

The Rise of the AI in Big Data

The researchers working at the MIT “Computer Science and Artificial Intelligence Laboratory” or abbreviated simply as CSAIL are all set to make human intuition out of the analysis of big data equation by enabling computers to choose from the set of features that are put into use in order to identify patterns in the data that may be considered to be predictive. This is dubbed as the “Data Science Machine” and as things have progressed so far the software prototype has managed to beat 615 of 908 competing teams vying for the same ability across no less than three competitions of data science.

2

Big Data may be considered as a complex and huge ecosystem that combines innovative processes from fields as diverse as storage, data analysis, curation, networking as well as search in addition to other functions and processes. As things stand much of analysis of big data is already algorithmic and automated but at the end of the day it is business users and data scientists who are needed in order to determine the particular dataset and analysis features which are required for visualization in the end and take action on the communicated data.

To put it simply at the end of the whole process humans are needed in order to make choices about data point combinations to chart out the relevant information.

The Data Science Machine is intended to naturally complement human intelligence and to make the most of the Big Data that is available for us waiting to be used.

The analysis of Big Data and Engineering of Features

As mentioned earlier actionable information lies at the hands of the big data scientist who is writing the code for analysis. It is this code that guides the analysis of the big data engine. In essence the advancement made by the MIT researchers is that not only does it serve to provide answers to questions regarding the data but also suggests additional questions accordingly.

This may be put into varied uses like to estimate the capacity of wind farms to generate power or making predictions about students who are likely to drop out of online courses.

5 Hottest Online Applications Inspired by Artificial Intelligence – @Dexlabanalytics.

The ultimate destination for all your data-related queries and assistance is DexLab Analytics. Being a premier Data Science training institute Gurgaon, DexLab Analytics takes pride in offering excellent data analytics courses for aspiring candidates.


Interested in a career in Data Analyst?

To learn more about Data Analyst with Advanced excel course – Enrol Now.
To learn more about Data Analyst with R Course – Enrol Now.
To learn more about Big Data Course – Enrol Now.

To learn more about Machine Learning Using Python and Spark – Enrol Now.
To learn more about Data Analyst with SAS Course – Enrol Now.
To learn more about Data Analyst with Apache Spark Course – Enrol Now.
To learn more about Data Analyst with Market Risk Analytics and Modelling Course – Enrol Now.
The Possibilities of Big Data

It is no secret that Big Data has some wonderful applications that may change the way we interact with businesses, and even more how they interacts with us through other facets of this rapidly growing field. But, what can it do concretely? This blog post shares insights of this question.
 
The Possibilities of Big Data

Endless Possibilities of Big Data

 It can tell you what may most probably happen

Continue reading “The Possibilities of Big Data”

Success factors for Business Intelligence program

Success factors for Business Intelligence program

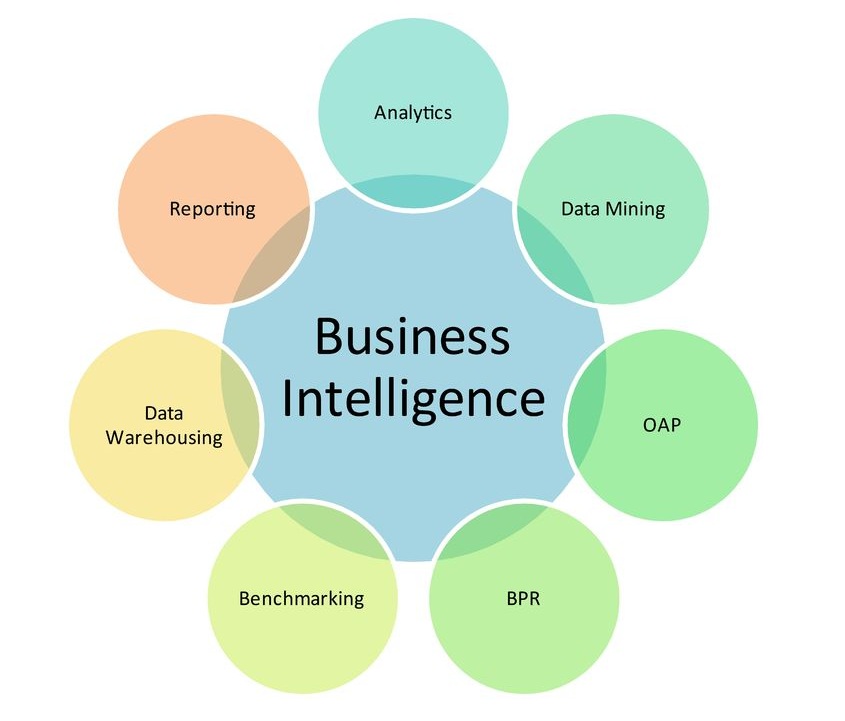
To implement a successful Business Intelligence program, one needs to understand the dimensions that are critical to success of the BI program. Here we will discuss six critical success factors for the BI program.

Critical Dimension 1 – Strong Executive Support

If there is one dimension or critical attribute that has major influence on successfully implementing the BI program would be strong executive support. If there is any lack of enthusiasm at the top will filter downwards. A key component of obtaining strong executive support is a convincing and detailed business case for BI.

bc237409f3248ab18758b8ba3d22d3ee

Critical Dimension 2 – Key Stakeholder Identification

Early identification and prioritisation of the key stakeholders are crucial. If we do not know who will benefit from a BI solution, it is unlikely that we can persuade anyone that is in their best interest to support the BI initiative.

5

Critical Dimension 3 – Creation of Business Intelligence Competency Center (BICC) Many organizations have created a separate BICC to manage the lifecycle of analytics processes. Organizations must keep in mind while creating a BICC is that the need of Business Intelligence. They should ask all the strategic and tactical question before creating a BICC. Some of the key objective of BICC shall be


  • Maximise the efficiency, deployment and quality of BI across all lines of business.
  • Deliver more value at less cost and in less time through more successful BI deployments.
Also read: Business Intelligence: Now Every Person Can Use Data to Make Better Decisions

Critical Dimension 4 – Clear Outcome Identification

This dimension determines what outcomes the organization desires, and whether they are tactical or strategic.

  • Knowledge – What knowledge is needed for desired outcomes and where is it?
  • Information – What information structures can be identified from knowledge gathering and how can these same structures be beneficial.
  • Data – What sources of raw data are needed to populate the information structures?

Pursuing the answers to these questions requires both logic and creativity. We also need specific information at various steps in the BI process.

Also read: Trends to Watch Out – Global Self-service Business Intelligence (BI) Market 2017

Critical Dimension 5 – Integrating CSFs (Critical Success Factors) and KPIs to Business Drivers

Many business initiatives aim to obtain benefits – greater efficiency, quicker access to information that are hard to quantify. We can easily accept that greater efficiency is a good thing, but trying to quantify its precise cash value to the organization can be a challenge. These benefits are essentially intangible but need to be measured.

Therefore, when identifying these key values, they can be classified as “driving” strategy, organization or operations.

Strategic Drivers Influence:
  • Market attractiveness
  • Competitive strengths
  • Market share
Organisational Drivers Influence:
  • Culture
  • Training and development
Operational Drivers Influence:
  • Customer satisfaction
  • Product Excellence
Also read: Role of R In Business Intelligence

Critical Dimension 6 – Analytics Awareness

Organizations have a tendency to measure what is easy to measure – internal transactional data. Extending the sensitivity of the organization to external and internal data presents a fuller picture to decision makers of the organization and the competitive environment. If measures are appropriate, the organisation can start to improve the processes.

When the above mentioned six critical dimension of BI solution are place. Organizations can benefit the value from the BI solutions are exponential in manner.

6

For better implementation of BI Program, why not take up effective market risk courses offered by DexLab Analytics! Market Risk Analytics is a growing field of study; for more details visit the site.


Interested in a career in Data Analyst?

To learn more about Data Analyst with Advanced excel course – Enrol Now.
To learn more about Data Analyst with R Course – Enrol Now.
To learn more about Big Data Course – Enrol Now.

To learn more about Machine Learning Using Python and Spark – Enrol Now.
To learn more about Data Analyst with SAS Course – Enrol Now.
To learn more about Data Analyst with Apache Spark Course – Enrol Now.
To learn more about Data Analyst with Market Risk Analytics and Modelling Course – Enrol Now.
Big Data at Autodesk: 360 Degree view of Customers in the Cloud

The last few years have seen a huge paradigm shift for many software vendors. The move away from a product-based model towards software-as-a-service (SAAS) in the cloud has brought huge changes. The main advantage of moving from a product based model to software-as-a-service is that the companies will be able to identify the service usage of how and why a product is being used. Earlier software companies used to run a survey or focus groups of customer feedback to identify the how and why a product is being used. This customer feedback survey has various limitations on identifying the product usage or where the product improvement has to be made.

Here’s All You Need to Know about Quantum Computing and Its Future

Autodesk was one of the frontrunners in the field, having been experimenting with the cloud based SAAS as far back as 2001 when it is acquired the BUZZSAW file sharing and synchronization service. Since then Microsoft, Adobe and many others moving into a subscription based, on-demand service and Autodesk has done the same with its core computer aided design products.

Software-as-a-service is a software licensing and delivery model in which software is licensed on a subscription basis and is centrally hosted. It is sometimes referred to as on-demand software. On-premise software is the exact opposite where the delivery of product is inside the particular organizations infrastructure.

Understanding how customers use a product is critical to giving them what they want. In a SAAS environment where everything is happening online and in the cloud, companies can gain a far more accurate picture  

2


The idea of moving to cloud based subscription model gives the business to understand more about the product usage of customers. This gives them the edge to serve better to the customers. The shift in the industry shall not be ignored. Big Data is really being used now to understand how and where to improve the product.


The Indian IT industry is focusing mainly on Cloud, Analytics, Mobile and Social segment to further drive growth. This Software-as-a-service delivery model can certainly give the edge to do data analysis on where and how the product is used.


There are number of reasons why Software-as-a-service is beneficial to organizations:


  • No additional hardware costs, you can buy the processing power or hardware as per the requirement. Do not have to go for high end configuration as there is no requirement. Need based subscription.
  • Usage is scalable. You can scale whenever you require.
  • Applications can be customised.
  • Accessible from any location, rather than being restricted to installations on individual computers an application can be accessed from anywhere with an internet enabled device.


The adoption of cloud based delivery model is accelerating mainly because of the analytical capability it gives the business to understand the customers. Analytics rocks!.


For state of the art big data training in Pune, look no further than DexLab Analytics. It is a renowned institute that excels in Big data hadoop certification in Pune. For more information, visit their official site.


Interested in a career in Data Analyst?

To learn more about Machine Learning Using Python and Spark – click here.
To learn more about Data Analyst with Advanced excel course – click here.
To learn more about Data Analyst with SAS Course – click here.
To learn more about Data Analyst with R Course – click here.
To learn more about Big Data Course – click here.

How Vital Is It to Measure KPIs for Future Success

How Vital Is It to Measure KPIs for Future Success

As I discussed earlier, Analytics is highly quantitative in nature. In this blog, we will discuss about the importance of Key Performance Indicators and how does KPIs help in measuring the organization’s performance and analytics.

Continue reading “How Vital Is It to Measure KPIs for Future Success”

Credit Risk Analytics and Regulatory Compliance – An Overview

Credit Risk Analytics and Regulatory Compliance – An Overview


Post the Financial Crisis of 2008, there has been an increase in the regulatory vigilance of the capital adequacy of commercial banks across the globe. Banks need to be compliant with different regulatory capital requirements, so that they can continue their operations under situations of stress. A majority of analytical work in Indian BFSI domain is to provide analytical support to US based multinational NBFC’s. We would like to throw some light on the opportunities and scope of credit risk analytics in the US banking and financial services industry. The Federal Reserve requires the banks to be compliant with three main regulatory requirements: BASEL- II, Dodd Frank Act Stress Testing (DFAST) and Comprehensive Capital Analysis and Review (CCAR).

Continue reading “Credit Risk Analytics and Regulatory Compliance – An Overview”

Tips to Make Sense of All The Big Data Around Us, You Can Make a Difference

Tips To Make Sense Of All The Big Data Around Us, You Can Make A Difference

We are all in the midst of the onslaught of information overload in many ways. We create it, transfer it and heartily participate in it. To get a grasp of the actual reality faced by businesses of all sizes, one needs to understand the exact scenario. According to IDC1, “The big data and analytics market will reach $125 billion worldwide in 2015” Further, IDC predicts, “Clearly IoT (Internet of Things) analytics will be hot, with a five-year CAGR of 30%.”

big-data-analytics

Data is created from all the posts made every second globally on social media, the humongous chatter, digital photo sharing, video uploads, online transactions, all the cell phone signals etc. – are all forms of data being generated leading to a massive information overload across servers and of course the cloud platforms.

All this digitization has led to a severe business challenge – so much big data, but how to make sense of all this? How does one use it for any kind of business related decision or direction? The following are some tips to help business make some sense from all this data right within their ambit.

1-Break it down

Big data remains big, unless methods are employed to break it into tiny usable groups of information. Eliminating, cross-referencing and grouping are the first steps to sort out various disparate data bytes.

2-Deduplication

There will always be the challenge of similar data springing up and being stored. Deduplication works as a primary point of ensuring that there is a reduction in the same data coming up for analysis.

3-Technology and its role

The role of specific technology cannot be ignored, when it comes to ensuring that all this big data is streamlined, stored safely and processed using the latest available techniques.

Big Data Landscape

4-Do not discard anything

Even the smallest and seemingly insignificant amount of information may be relevant and hold key insights.

5-Best practices for data analysis

The ecosystem revolving around the actual analysis of the big data needs to evolve into a more standardized format to be used across flexible structures leading to quicker outputs, better results and arriving at useful insights.

6-Having the right talent

This is one of the most important aspects, when it comes to actually making sense of all the data lying around across organizations. This is where trained and certified big data analysts appear.

DexLab Analytics Presents #BigDataIngestion

A Special Alert: DexLab Analytics is offering #SummerSpecial 10% off on in-demand courses of big data hadoop, data science, machine learning and business analytics. Enroll now for #BigDataIngstion: the new on-going admission drive!

Interested in a career in Data Analyst?

To learn more about Data Analyst with Advanced excel course – Enrol Now.
To learn more about Data Analyst with R Course – Enrol Now.
To learn more about Big Data Course – Enrol Now.

To learn more about Machine Learning Using Python and Spark – Enrol Now.
To learn more about Data Analyst with SAS Course – Enrol Now.
To learn more about Data Analyst with Apache Spark Course – Enrol Now.
To learn more about Data Analyst with Market Risk Analytics and Modelling Course – Enrol Now.
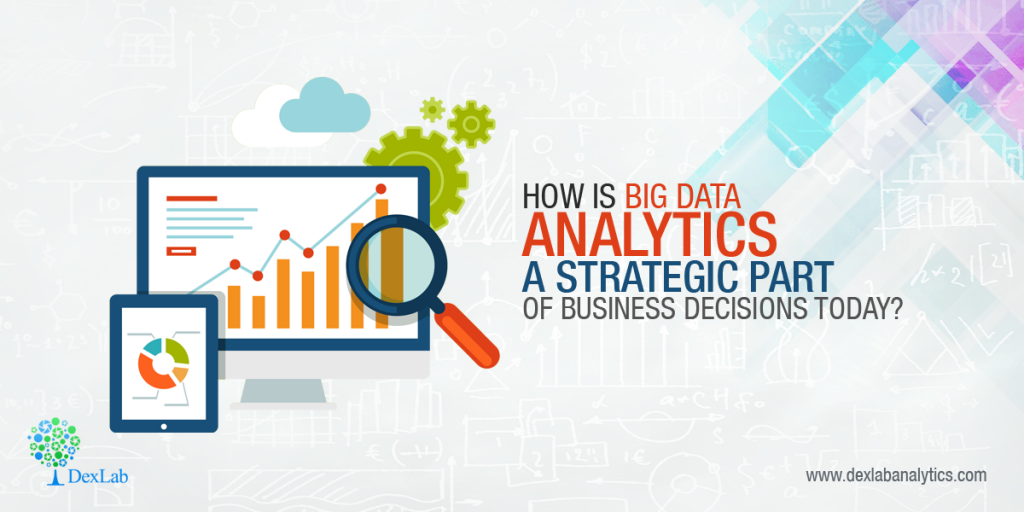
How is big data analytics a strategic part of business decisions today?

(Decode big data analytics and its relevance in today’s business scenario)

How is big data analytics a strategic part of business decisions today?

Businesses are getting increasingly competitive, and thanks to the connected community through multiple devices. The way people are shopping or looking for products or solutions has undergone a paradigm shift. We are living in a changed world in terms of the way technology intersects almost all aspects of business, notwithstanding the size and scale.

Continue reading “How is big data analytics a strategic part of business decisions today?”

Call us to know more