Big data certification Archives - Page 15 of 18 - DexLab Analytics | Big Data Hadoop SAS R Analytics Predictive Modeling & Excel VBA

We Are Training Snapdeal on Data Science with R

With the Big Data boom within the IT industry worldwide, more and more online retailers are using it to create better shopping experience for their customers through a boost in customer satisfaction to generate better revenue for themselves.


We Are Training Snapdeal on Data Science with R
Dexlab Analytics is Conducting Training for Snapdeal in Data Science and R Programming


The funny news about Target knowing about a young lady’s pregnancy even before the father could was a viral content that sent the internet crazy. But how did they know this?

 
The answer lies in the wizardry of data analysis, as when a lady starts searching to buy products like nutritional supplements, unscented beauty products and cotton balls then there is a good chance that she is pregnant.


For More Information Visit Now www.prlog.org at Dexlab Analytics is Conducting Training for Snapdeal in Data Science and R Programming

Continue reading “We Are Training Snapdeal on Data Science with R”

How To Stop Big Data Projects From Failing?

Here in this post we will discuss with inspiration from the views of insider experts about how Big Data teams and IT personnel can make sense from the right kinds of data which will ultimately allow executives to make smarter business choices and drive results for their business.


Big data hadoop certification in pune

 
The amount of data that has been created in the last two years is much more than the amount that has been created in the entire previous history of our human kind. This has led to an explosion of data analyst training institutes popping up every now and then and welcoming students from diverse backgrounds. Continue reading “How To Stop Big Data Projects From Failing?”

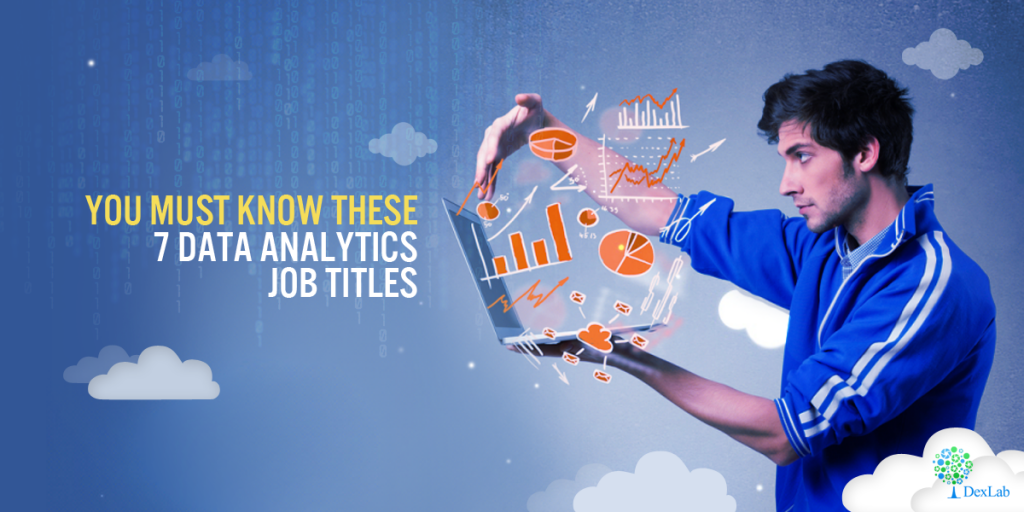
You Must Know These 7 Data Analytics Job Titles

You Must Know These 7 Data Analytics Job Titles

These days leveraging data be it big or small has become a powerful tool for all enterprises. IT firms are successfully transitioning to digital businesses and opportunities within the companies themselves are increasing to fulfil the growing demands.

So, if you want to join this megatrend in the job market, read on to find out the most in-demand data analytics job titles for today’s professionals:

Data scientist:

This job title has been getting a lot of attention since the past few years now. So much so, that even Glassdoor named it as the best career choice for optimum work/life balance. Their salaries are also comparatively higher.

But the field is still cloudy in terms of the job functions. So, let us understand what it actually means to be a data scientist.

According to Burch Works data scientists are people who “apply sophisticated quantitative measures and computer skills to both structure and analyze the massive amount of unstructured data sets or stream data continuously with an intention to derive information and prescribe action.

The executive recruiting firm says that the coding skills of these professionals are the main distinguishing factor that separates them from other predictive analytics professionals and allows them to exploit data regardless of its size, source and format.

These data professionals often have a master’s degree or a PhD in quantitative disciplines, such as applied math or statistics. They have expert skills and knowledge in statistical and machine learning methods and know tools like SAS, R etc. they are also proficient in other Big Data software like Hadoop and Spark.

2

Advanced analytics professional:

The professionals with this job role perform predictive analysis, prescriptive analysis, simulations, and all other forms of advanced analytics. Their role is however, significantly different from data scientists as they do not work with very large data sets and also not with unstructured data.

Data analyst:

A gamut of responsibilities fall under the job listings of a data analyst. They include ensuring data quality and governance, building different systems that enable businesses to gain user insights, performing actual data analysis and much more. However, the skill sets are similar and typically these professionals fit into the same category as advanced analytics professionals and data scientists, because they all can analyze data. But despite such similarities data analysts may be considered as more junior-level employees who are still in a way generalists and can fit into several different job roles within the organization.

Data engineers:

These are the wizards who work behind the scenes to make the jobs of data analysts and data scientists easier. They are technical professionals who have a deep understanding of Hadoop and other Big Data technologies like MapReduce, Hive, SQL and Pig, NoSQL technologies and other data warehousing systems.

Their primary job role is to construct the plumbing, build the data pipelines that clean, collect and aggregate data, organize it from different sources and then load them in data warehouses and databases.

Note that data engineers do not analyze data, but in other words keep the data flowing for processing so that other professionals can analyze them.

Business Analyst:

Business analysts can perform all the tasks that are almost the same for those who perform data analysis. However, business analysts generally have specialized knowledge of their specific business domain and then they apply that knowledge and analysis specifically for the business operations. For example, they may use their analytical skills to recommend improvement suggestions for the business.

Database Administrator:

These professionals are responsible for all things relevant to the operations, monitoring, and maintenance of the databases, often SQL or other relational database management systems also form their jurisdiction. Their tasks include installation, configuration, schemas definition, user training, and maintaining documents.

The database vendors like IBM, Oracle, Microsoft and others often offer certifications specific to their own proprietary technologies for such pros.

Business Intelligence professional:

BI professionals are responsible for adapting themselves with OLAP tools, reports and other data dashboards for looking at historical trends within data sets. Business Intelligence can have data visualization, and also include popular business intelligence platforms like Qlik, Tableau and Microsoft Power BI.

These were the most in-demand job titles in the data analysis industry, to help turn your career into the right direction take a look at our Big Data courses and have a job that you would thoroughly enjoy.


Interested in a career in Data Analyst?

To learn more about Data Analyst with Advanced excel course – Enrol Now.
To learn more about Data Analyst with R Course – Enrol Now.
To learn more about Big Data Course – Enrol Now.

To learn more about Machine Learning Using Python and Spark – Enrol Now.
To learn more about Data Analyst with SAS Course – Enrol Now.
To learn more about Data Analyst with Apache Spark Course – Enrol Now.
To learn more about Data Analyst with Market Risk Analytics and Modelling Course – Enrol Now.
Why Getting a Big Data Certification Will Benefit Your Small Business

Do you know how much data is currently produced globally every year?


As per the reports published by IBM, the figures are 2.5 QB (Quintillion Bytes). The numeric representation of the same looks as: 2,500,000,000,000,000,000. And we thought that our mobile devices with 64GB memory space are capable of storing huge data.


Why Getting a Big Data Certification Will Benefit Your Small Business

Increasing reliance on Big Data

As technology is expanding at the speed next to light, more companies are planning to invest in Big Data platforms for getting the best out of it. Gartner Inc. had conducted a research recently among 437 global organisations across different industries and figured out that more than 75% of them are looking forward to the benefits they can derive from Big Data. The purpose for using Big Data varied to some instance across these organisations, however most of the companies were found to use data analytics for enhancing their customer service segments. Recently, security breach has hit the headline more often than global warming and that has been a factor of worry for many data driven companies. Thus, they are opting for Big Data tools in order to strengthen their online security. Continue reading “Why Getting a Big Data Certification Will Benefit Your Small Business”

Are you taking care of your digital self?

Whether you like the idea or not, we all have a digital self, a facade that we put on to engage and participate in the technological world! As per psychoanalysts and physicians, a theory proposed by them says that there is a ‘true self’ that is the instinctive core of our personality, it must be realized and nurtured. And there is also a ‘false self’ that is built to protect this true self. From what you ask? From the dangers of insults and vulnerabilities!

Dexlab blog for 12th Oct

Our true selves are usually complex and fragile but it ultimately remains to be our essence. In trying to share that self with the world, we send out our decoy selves to take on the day-to-day vulnerabilities, challenges, and anxieties that come forth.

Continue reading “Are you taking care of your digital self?”

Big Data Analytics Is Helping To Curb Cancer For More Than 40 Years Now

The times now are such that we can name at least one of our friends, relatives or peers who have fought the dreadful battle with cancer. But luckily for us there are several people who along with their loved ones have not only fought this battle with courage but have triumphed to achieve sweet survival. But such glorious accomplishments would not have occurred if it were 40 years ago.

 
Big Data Analytics Is Helping To Curb Cancer For More Than 40 Years Now


As per the reports, adults who were diagnosed with cancer back in 1975 only had a lowly 50/50 chance of survival after five years of being diagnosed. But today the relative five year after rate of survival across all types of cancer is as close as 70 percent. And for better, the cancer survival rate during the same time frame for child cancer patients within five years of diagnosis has improved from the previously existing 62 percent to 81 percent, which is a steep rise. Continue reading “Big Data Analytics Is Helping To Curb Cancer For More Than 40 Years Now”

Here Are Your Reasons For Attending India Internet Day of Tie, Delhi-NCR

Around this time every year TiE of New Delhi hosts an important event which should be of interest to IT personnel around the country. The event is known as the India Internet Day, and they have been at it for the past couple of years. But as a data scientist hoping to make it big in the Big Data world with IT giants why should you expend your limited “Paid Leaves” (if you are employed) and attend this event?

 
Here Are Your Reasons For Attending India Internet Day of Tie, Delhi-NCR
 

Let DexLab Analytics explain to you why is it necessary for aspiring Data Scientists/Analysts to attend this event:


Get the necessary nudge towards your start-up success!

In India the TiE event of India Internet Day is one of the most happening events for Start-ups, held in Delhi-NCR and North Region. Continue reading “Here Are Your Reasons For Attending India Internet Day of Tie, Delhi-NCR”

Big Data is the New Obsession of Small Business Owners

Big Data is the New Obsession of Small Business Owners

While this may seem somewhat counterintuitive, but instead of large organizations, it is actually small business owners and midsize companies who tend to be more inclined towards the applications of Big Data. They are also the first to adopt these latest technological innovations of which analytics is no exception – as these internet and data based insights are highly accessible and also affordable for SMBs.

As per the researchers in the fields of technology, the entry level capabilities in such fields like analytics has abruptly dropped which is why almost all types of industries from an array of sectors are engaging with them to enhance their competitiveness; and the wheels have already started to roll when it comes to increasing overall global competitiveness. Continue reading “Big Data is the New Obsession of Small Business Owners”

Difference between a Heat Map and a Tree Map

Difference between a Heat Map and a Tree Map

Are you planning to pursue a Tableau training course in Delhi? Then you must be well aware of this common confusion about the difference between these two widely used maps. There are two very useful charts which help in analyzing data, heat maps and tree maps. Heat maps and tree maps are highly insightful visualizations. However, many a times, there is a confusion between the two due to which analysts either use misuse it or totally avoid using it.

This article will help to draw a clear line between heat maps and tree maps, thus enabling analysts pursuing tableau certification, Gurgaon to create better visualizations.

We the faculty at Dexlab Analytics, the premiere Tableau Training Institute in Gurgaon aim to clarify this common doubt with this brief discussion on these two maps.

Data Science Machine Learning Certification

What are heat maps?

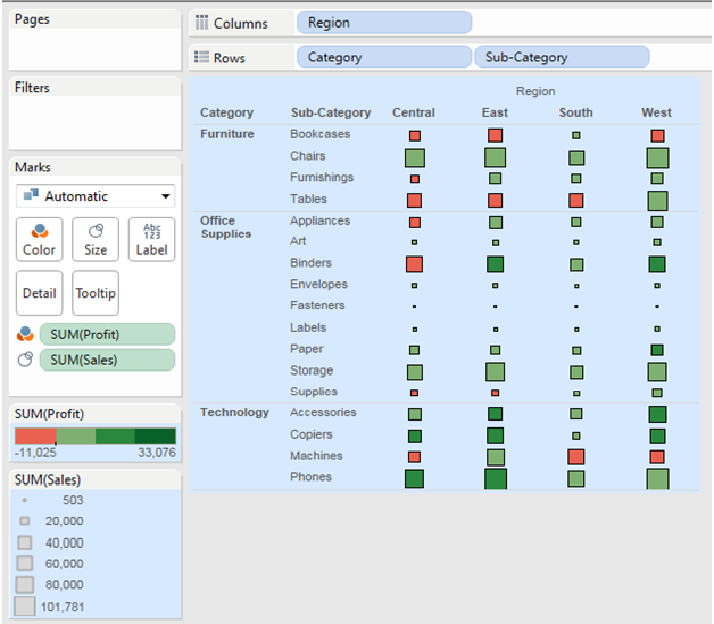
Heat map is a type of visualization tool that is very apt to compare different categories. It helps to visualize measures against dimensions with the help of colors and size to compare one or more dimensions & up to two measures. The layout is similar to a text table with variations in values encoded as colors. In heat map, you can quickly see a wide array of information.

In a heat map, one measure can be assigned to the color and another measure can be assigned to the size.

 Quick Hands-On: Shows the sales and profit in all regions for different products category and sub-Category.

Analysis of visualization: The profit is represented by the color and ranges from red for loss to green for profit. The total sales are represented by the size.

Analysis of visualization

Hence, it is very easy to understand the performance of different products in different regions, at one glance, just by looking at the heat map.

What are tree maps?

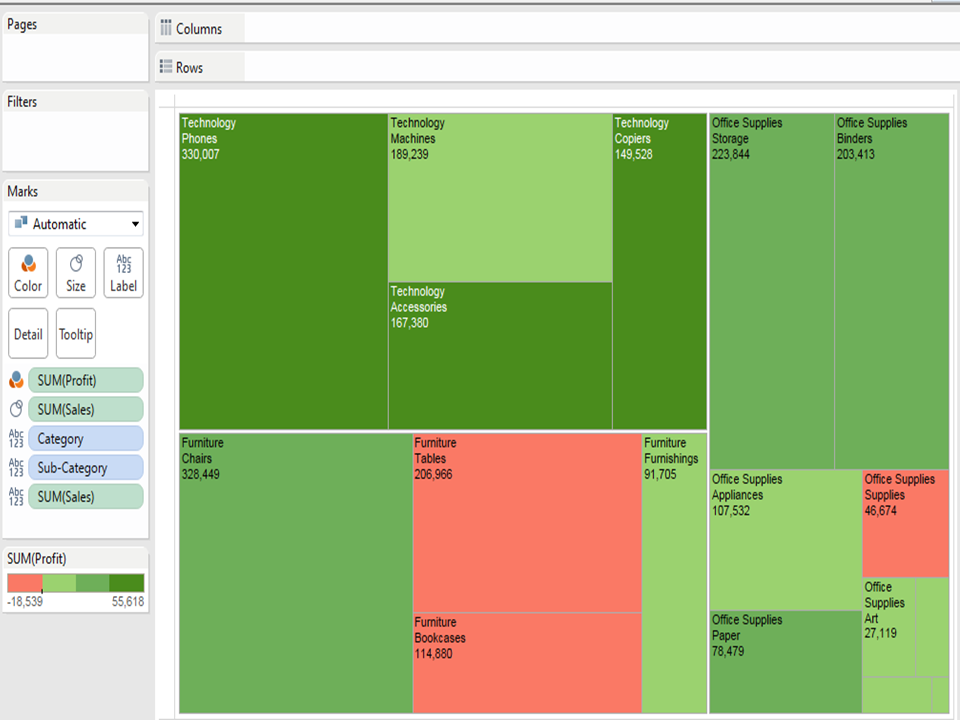
Tree maps are a relatively new feature in Tableau, first appearing in version 8.0. The ‘tree map’ is a chart type that displays hierarchical or part-to-whole relationships via rectangles. In case of hierarchical (tree-structured) data these rectangles are nested. The space in the view is divided into rectangles that are sized and ordered by a measure. Nested rectangles mean that hierarchy levels in the data are expressed by larger rectangles (above in the hierarchy) containing smaller ones (below in the hierarchy). The rectangles in the tree map range in size from the top left corner of the chart to the bottom right corner, with the largest rectangle positioned in the top left corner and the smallest rectangle in the bottom right corner.

In a tree map 1 or more dimensions & up to 2 measures are used to create such a map.

Quick Hands- On: Show the sales and profit in all regions for different products category and Sub-Category.

Analysis of the visualization: The profit (color) and sales (size) of products are given at a Category and Sub- Category level. Bigger the size of the node, greater is the sales in that state. Similarly, the greener the node, more is the profit in that state.

Dexlab-2nd-images

Summary: A slight disadvantage of using tree maps in Tableau is that, as the number of items increase, the amount of space allocated for each item decreases. Hence, the area available to print the labels, become small.  As a result, usually, in a tree map almost all the squares or nodes will appear blank. This defect can be overcome by providing appropriate tooltips for each node. Like in heat maps, measures can be assigned to give different   colors and sizes to the nodes in the tree map.

To learn the right use of these two maps in Tableau we recommend seeking a corporate Tableau Training in Delhi NCR for better understanding of this complex statistical application.


Interested in a career in Data Analyst?

To learn more about Data Analyst with Advanced excel course – Enrol Now.
To learn more about Data Analyst with R Course – Enrol Now.
To learn more about Big Data Course – Enrol Now.

To learn more about Machine Learning Using Python and Spark – Enrol Now.
To learn more about Data Analyst with SAS Course – Enrol Now.
To learn more about Data Analyst with Apache Spark Course – Enrol Now.
To learn more about Data Analyst with Market Risk Analytics and Modelling Course – Enrol Now.

Call us to know more