Big Data Analytics Archives - Page 6 of 18 - DexLab Analytics | Big Data Hadoop SAS R Analytics Predictive Modeling & Excel VBA

How Big Data Is Influencing HR Analytics for Employees and Employers, Both

How Big Data Is Influencing HR Analytics for Employees and Employers, Both

HR analytics powered by big data is aiding talent management and hiring decisions. A Deloitte 2015 report says 35% of companies surveyed revealed that they were actively developing suave data analytics strategies for HR. Moreover, big data analytics isn’t leaving us anytime soon; it’s here to stay for good.

Now, with that coming, employers are of course in an inapt position: whether to use HR analytics or not? And even if they do use the data, how are they going to do that without violating any HR policies/laws or upsetting the employees?

2

Health Data

While most of the employers are concerned about healthcare and wellness programs for their employees, a whole lot of other employees have started employing HR analytics for evaluation of the program’s effectiveness and addressing the gaps in healthcare coverage with an aim to improve overall program performance.

Today, data is the lifeblood of IT services. Adequate pools of employee data in conjunction with company data are aiding discoveries of the best benefit package for employees where they get best but affordable care. However, in the process, the employers need to be very careful and sensitive to employee privacy at the same time. During data analysis, the process should appear as if the entire organization is involved in it, instead of focusing on a single employee or sub-groups.

Predictive Performance Analytics

For talent management, HR analytics is a saving grace. Especially, owing to its predictive performance. Because of that, more and more employers are deploying this powerful skill to determine future hiring needs and structure a strong powerhouse of talent.

Rightfully so, predictive performance analytics use internal employee data to calculate potential employee turnover, but unfortunately, in some absurd cases, the same data can also be used to influence decisions regarding firing and promotion – and that becomes a problem.

Cutting edge machine learning algorithms dictate whether an event is going to happen or not, instead of what employees are doing or saying. Though it comes with its own advantages, its better when people frame decisions based on data. Because, people are unpredictable and so are the influencing factors.

Burn away irrelevant information

Sometimes, it may happen that employers instead of focusing on the meaningful things end up scrutinizing all the wrong things. For example, HR analytics show that employees living close to the office, geographically, are less likely to leave the office premise early. But, based on this, can we pass off top talent just because they reside a little farther from the office? We can’t, right?!

Hence, the bottom line is, whenever it comes to analyzing data, analysts should always look for the bigger picture rather giving stress on minute features – such as which employee is taking more number of leaves, and so on. Stay ahead of the curve by making the most productive decisions for employees as well as business, as a whole.

In the end, the power of data matters. HR analytics help guide the best decisions, but it’s us who are going to make them. We shouldn’t forget that. Use big data analytics responsibly to prevent any kind of mistrust or legal issues from the side of employees, and deploy them in coordination with employee feedback to come at the best conclusions ever. 

Those who are inclined towards big data hadoop certification, we’ve some droolworthy news for you! DexLab Analytics, a prominent data science learning platform has launched a new admission drive: #BigDataIngestion on in-demand skills: data science and big data with exclusive 10% discounts for all students. This summer, unfurl your career’s wings of success with DexLab Analytics!


Get the details here : www.dexlabanalytics.com/events/dexlab-analytics-presents-bigdataingestion


Reference:

The article has been sourced from https://www.entrepreneur.com/article/271753


Interested in a career in Data Analyst?

To learn more about Data Analyst with Advanced excel course – Enrol Now.
To learn more about Data Analyst with R Course – Enrol Now.
To learn more about Big Data Course – Enrol Now.

To learn more about Machine Learning Using Python and Spark – Enrol Now.
To learn more about Data Analyst with SAS Course – Enrol Now.
To learn more about Data Analyst with Apache Spark Course – Enrol Now.
To learn more about Data Analyst with Market Risk Analytics and Modelling Course – Enrol Now.

A Comprehensive Guide on Clustering and Its Different Methods

A Comprehensive Guide on Clustering and Its Different Methods

Clustering is used to make sense of large volumes of data, structured or unstructured, by dividing the data into groups. The members of a group are ‘’similar’’ between them and ‘’dissimilar’’ to objects in other groups. The similarity is based on characteristics such as equal distances from a point or people who read the same genre of book. These groups with similar members are called clusters. The various methods of clustering, which we shall be discussing subsequently, help break up data into logical groupings before analyzing the data more deeply.

If a CEO of a company presents a broad question like- ‘’ Help me understand our customers better so that we can improve marketing strategies’’, then the first thing analysts need to do is use clustering methods to the classify customers. Clustering has plenty of application in our daily lives. Some of the domains where clustering is used are:

  • Marketing: Used to group customers having similar interests or showing identical behavior from large databases of customer data, which contain information on their past buying activities and properties.
  • Libraries: Used to organize books.
  • Biology: Used to classify flora and fauna based on their features.
  • Medical science: Used for the classification of various diseases.
  • City-planning: identifying and grouping houses based on house type, value and geographical location.
  • Earthquake studies: clustering existing earthquake epicenters to locate dangerous zones.

Clustering can be performed by various methods, as shown in the diagram below:

Fig 1

The two major techniques used to perform clustering are:

  • Hierarchical Clustering: Hierarchical clustering seeks to develop a hierarchy of clusters. The two main techniques used for hierarchical clustering are:
  1. Agglomerative: This is a ‘’bottom up’’ approach where first each observation is assigned a cluster of its own, then pairs of clusters are merged as one moves up the hierarchy. The process terminates when only a single cluster is left.
  2. Divisive: This is a ‘’top down’’ approach wherein all observations start in one cluster, and splits are performed recursively as one moves down the hierarchy. The process terminates when each observation has been assigned a separate cluster.

Fig 2: Agglomerative clustering follows a bottom-up approach while divisive clustering follows a top-down approach.

  • Partitional Clustering: In partitional clustering a set of observations is divided into non-overlapping subsets, such that each observation is in exactly one subset. The main partitional clustering method is K-Means Clustering.

The most popular metric used for forming clusters or deciding the closeness of clusters is distance. There are various distance measures. All observations are measured using one particular distance measure and the observation having the minimum distance from a cluster is assigned to it. The different distance measures are:

  • Euclidean Distance: This is the most common distance measure of all. It is given by the formula:

Distance((x, y), (a, b)) = √(x – a)² + (y – b)²

For example, the Euclidean distance between points (2, -1) and (-2, 2) is found to be

Distance((2, -1), (-2, 2)) 

  • Manhattan Distance:

This gives the distance between two points measured along axes at right angles. In a plane with p1 at (x1, y1) and p2 at (x2, y2), Manhattan distance is |x1 – x2| + |y1 – y2|.

  • Hamming Distance:

Hamming distance between two vectors is the number of bits we must change to convert one into the other. For example, to find the distance between vectors 01101010 and 11011011, we observe that they differ in 4 places. So, the Hamming distance d(01101010, 11011011) = 4

  • Minkowski Distance:

The Minkowski distance between two variables X and Y is defined as

The case where p = 1 is equivalent to the Manhattan distance and the case where p = 2 is equivalent to the Euclidean distance.

These distance measures are used to measure the closeness of clusters in hierarchical clustering.

In the next blogs, we will discuss the different methods of clustering in more details, so make sure you follow DexLab Analytics– we provide the best big data Hadoop certification in Gurgaon. Do check our data analyst courses in Gurgaon.


Interested in a career in Data Analyst?

To learn more about Data Analyst with Advanced excel course – Enrol Now.
To learn more about Data Analyst with R Course – Enrol Now.
To learn more about Big Data Course – Enrol Now.

To learn more about Machine Learning Using Python and Spark – Enrol Now.
To learn more about Data Analyst with SAS Course – Enrol Now.
To learn more about Data Analyst with Apache Spark Course – Enrol Now.
To learn more about Data Analyst with Market Risk Analytics and Modelling Course – Enrol Now.

How Big Data is Revolutionizing Political Campaigns in America

How Big Data is Revolutionizing Political Campaigns in America

No doubt that big data is altering the manner in which politicians win elections in America, but it is also breaking American politics. So was the verdict in a column by NBC’s Chuck Todd and Carrie Dann.

According to Todd and Dann, recent technological advancements give access to detailed voter information and demographic data, like what they watch, what they shop and what they read; campaign initiators are completely aware of the preferences of voters. Hence, it enables them to target people who are most likely to vote for them through ads and other relevant content. They don’t feel the need to persuade the ones who are less likely to agree with their ideologies. Clearly, this is a crisis situation that fuels polarization within a governing system. It is encouraging campaigns to appeal to their most likely supporters rather than all their constituents. Also, this process is cheaper and faster.

Eitan Hersh, a notable professor of political science at Yale University conducted research on the role of big data and modern technology in mobilizing voters. So, let’s find out if his research work indicates the situation to be as adverse as Todd and Dann claims it to be.

New sources of data:

Earlier, campaigns relied on surveys to generate their data sets, which were based on a sample of the entire population. Now campaigns can use data that is based on the entire population. The data sets that are looked into include voter registration data, plenty of public datasets and consumer databases. Zonal data, like neighborhood income, can be accessed via the Census Bureau. Information about a voter, like her party affiliation, gender, age, race and voting history is often listed in public records. For example, if a democratic campaign is aware that a person has voted for a Democratic party previously, is Latino or of African origin and is under 25 years, then it is highly probable that this person will vote for them.

Once campaigns chalk out their team of supporters, they employ party workers and tools like mails and advertisements to secure their votes.

Hacking the electorate:

According to Eitan Hersh, it is truly impossible to completely understand the interests of the entire population of voters. However, campaigns are focusing heavily on gathering as much data as possible. The process consists of discovering new ways existing data can be utilized to manipulate voters; asking the right questions; predicting the likeliness of a group to vote for a particular candidate, etc. They need to find sophisticated ways to carry out these plans. The ever increasing volume of data is definitely aiding these processes. Campaigns can now customize their targeting based on individual behavior instead of the behavior of a standard constituent.

Types of targeting:

There are chiefly 4 methods of targeting, which are not only used for presidential elections but also for targeting in local elections. These are:

  1. Geographic targeting: This helps target people of a particular zip code, town or city and prevents wastage of money, as ads are focused on people belonging to a specific voting area.
  2. Demographic targeting: This helps targeting ads to specific groups of people, such as professionals working in blue-chip companies, men within ages 45 and 60 and workers whose salaries are within $60k per year for example.
  3. Targeting based on interest: For example, ads can be targeted to people interested in outdoor sports or conservation activities.
  4. Targeting based on behavior: This is basically the process in which past behavior and actions are analyzed and ads are structured based on that. Retargeting is an example of behavioral targeting where ads are targeted to those who have interacted with similar posts in the past.

To conclude, it can be said that victory in politics involves a lot more than using the power of big data to reduce voters to ones (likely voters) and zeros (unlikely voters). Trump’s victory and Clinton’s defeat is an example of this. Although, Clinton targeted voters through sophisticated data-driven campaigns, they might have overlooked hefty vote banks in rural areas.

2

To read more interesting blogs on big data and its applications, follow Dexlab Analytics – we provide top-quality big data Hadoop certification in Gurgaon. To know more, take a look at our big data Hadoop courses.

References: 

https://www.vox.com/conversations/2017/3/16/14935336/big-data-politics-donald-trump-2016-elections-polarization

https://www.entrepreneur.com/article/309356


Interested in a career in Data Analyst?

To learn more about Data Analyst with Advanced excel course – Enrol Now.
To learn more about Data Analyst with R Course – Enrol Now.
To learn more about Big Data Course – Enrol Now.

To learn more about Machine Learning Using Python and Spark – Enrol Now.
To learn more about Data Analyst with SAS Course – Enrol Now.
To learn more about Data Analyst with Apache Spark Course – Enrol Now.
To learn more about Data Analyst with Market Risk Analytics and Modelling Course – Enrol Now.

Big Data Could Solve Drug Overdose Mini Epidemic

Big Data Could Solve Drug Overdose Mini Epidemic

Big data has become an essential part of our everyday living. It’s altering the very ways we collect and process data.

Typically, big data in identifying at-risk groups also shows signs of considerable growth; the reasons being easy availability of data and superior computational power.

The issue of overprescribing of opioids is serious, and over 63000 people has died in the United States last year from drug overdose, out of which more than 75% of deaths occurred due to opioids. Topping that, there are over 2million people in the US alone, diagnosed with opioid use disorder.

But of course, thanks to Big Data: it can help physicians take informed decisions about prescribing opioid to patients by understanding their true characteristics, what makes them vulnerable towards chronic opioid-use disorder. A team from the University of Colorado accentuates how this methodology helps hospitals ascertain which patients incline towards chronic opioid therapy after discharge.

For big data training in Gurgaon, choose DexLab Analytics.

Big Data offers helps

The researchers at Denver Health Medical Center developed a prediction model based on their electronic medical records to identify which hospitalized patients ran the risk of progressing towards chronic opioid use after are discharged from the hospital. The electronic data in the record aids the team in identifying the number of variables linked to the advancement to COT (Chronic Opioid Therapy); for example, a patient’s history of substance abuse is exposed.

As good news, the model was successful in predicting COT in 79% of patients and no COT in 78% of patients. No wonder, the team claims that their work is a trailblazer for curbing COT risk, and scores better than software like Opioid Risk Tool (ORT), which according to them is not suitable for hospital setting.

Therefore, the prediction model is to be incorporated into electronic health record and activated when a healthcare specialist orders opioid medication. It would help the physician decipher the patient’s risk for developing COT and alter ongoing prescribing practices.

“Our goal is to manage pain in hospitalized patients, but also to better utilize effective non-opioid medications for pain control,” the researchers stated. “Ultimately, we hope to reduce the morbidity and mortality associated with long-term opioid use.”

As parting thoughts, the team thinks it would be relatively cheaper to implement this model and of great support for the doctors are always on the go. What’s more, there are no extra requirements on the part of physicians, as data is already available in the system. However, the team needs to test the cutting edge system a number of times in other health care platforms to determine if it works for a diverse range of patient populations.

On that note, we would like to say DexLab Analytics offers SAS certification for predictive modeling. We understand how important the concept of predictive analytics has become, and accordingly we have curated our course itinerary.


The blog has first appeared on – https://dzone.com/articles/using-big-data-to-reduce-drug-overdoses


Interested in a career in Data Analyst?

To learn more about Data Analyst with Advanced excel course – Enrol Now.
To learn more about Data Analyst with R Course – Enrol Now.
To learn more about Big Data Course – Enrol Now.

To learn more about Machine Learning Using Python and Spark – Enrol Now.
To learn more about Data Analyst with SAS Course – Enrol Now.
To learn more about Data Analyst with Apache Spark Course – Enrol Now.
To learn more about Data Analyst with Market Risk Analytics and Modelling Course – Enrol Now.

10 Key Areas to Focus When Settling For an Alternative Data Vendor

10 Key Areas to Focus When Settling For an Alternative Data Vendor

Unstructured data is the new talk of the town! More than 80% of the world’s data is in this form, and big wigs of financial world need to confront the challenges of administering such volumes of unstructured data through in-house data consultants.

FYI, deriving insights from unstructured data is an extremely tiresome and expensive process. Most buy-sides don’t have access to these types of data, hence big data vendors are the only resort. They are the ones who transform unstructured content into tradable market data.

Here, we’ve narrowed down 10 key areas to focus while seeking an alternative data vendor.

Structured data

Banks and hedge funds should seek alternative data vendors that can efficiently process unstructured data into 100% machine readable structured format – irrespective of data form.

Derive a fuller history

Most of the alternative data providers are new kid in the block, thus have no formidable base of storing data. This makes accurate back-testing difficult.

Data debacles

The science of alternative data is punctured with a lot of loopholes. Sometimes, the vendor fails to store data at the time of generation – and that becomes an issue. Transparency is very crucial to deal with data integrity issues so as to nudge consumers to come at informed conclusions about which part of data to use and not to use.

Context is crucial

While you look at unstructured content, like text, the NLP or natural language processing engine must be used to decode financial terminologies. As a result, vendors should create their own dictionary for industry related definitions.

Version control

Each day, technology gets better or the production processes change; hence vendors must practice version control on their processes. Otherwise, future results will be surely different from back-testing performance.

Let’s Take Your Data Dreams to the Next Level

Point-in-time sensitivity

This generally means that your analysis includes data that is downright relevant and available at particular periods of time. In other cases, there exists a higher chance for advance bias being added in your results.

Relate data to tradable securities

Most of the alternative data don’t include financial securities in its scope. The users need to figure out how to relate this information with a tradable security, such as bonds and stocks.

Innovative and competitive

AI and alternative data analytics are dramatically changing. A lot of competition between companies urges them to stay up-to-date and innovative. In order to do so, some data vendors have pooled in a dedicated team of data scientists.

Data has to be legal

It’s very important for both vendors and clients to know from where data is coming, and what exactly is its source to ensure it don’t violate any laws.

Research matters

Few vendors have very less or no research establishing the value of their data. In consequence, the vendor ends up burdening the customer to carry out early stage research from their part.

In a nutshell, alternative data in finance refer to data sets that are obtained to inject insight into the investment process. Most hedge fund managers and deft investment professionals employ these data to derive timely insights fueling investment opportunities.

Big data is a major chunk of alternative data sets. Now, if you want to arm yourself with a good big data hadoop certification in Gurgaon then walk into DexLab Analytics. They are the best analytics training institute in India.

The article has been sourced from – http://dataconomy.com/2018/03/ten-tips-for-avoiding-an-alternative-data-hangover


Interested in a career in Data Analyst?

To learn more about Machine Learning Using Python and Spark – click here.

To learn more about Data Analyst with Advanced excel course – click here.
To learn more about Data Analyst with SAS Course – click here.
To learn more about Data Analyst with R Course – click here.
To learn more about Big Data Course – click here.

How Data Exhaust is Leveraged for Your Business

How Data Exhaust is Leveraged for Your Business

Big data is the KING of corporate kingdom. Every company is somehow using this vital tech tool; even if they are not using it, they are thinking of it.

A 2017 survey says, around 53% of companies were relying on big data for their business operations. Each company focuses on a particular variant of data. Some of the data types are considered most important, while others are left out. Now what happens to the data that is kept aside?

Data exhaust can be a valuable addition for a company – if leveraged properly.

Let’s Take Your Data Dreams to the Next Level

Explaining Data Exhaust

It entirely deals with the data that is leftover but produced by the company itself. Keep in mind, when you try collect information from a specific set of data, a whole lot of information is also collected at the same time. So, many organizations might be sitting on a gold mine of data but without acknowledging the importance of that data. In instances like this, data exhaust can be very helpful across numerous business development channels.

Market Research

The best way to use data exhaust is through extensive market research. Know your audience is the key. Customers are crucial for effective marketing and product development. Nevertheless, the former involves manual research as well as analytical research, which once again leads us to analytics.

Through data exhaust, you get to know everything your customers do on your website – thus, can understand what they like better.

Cyber Security

As a potent threat, cyber crime results into potential costs to businesses all across the world. So, what role does data exhaust play? At best, it can help determine risk across different databases to develop superior cyber security plan.

Product Development

Importantly, businesses work on a plethora of projects at the same time. As a result, the issue of time crunch pops up. No one can do everything all at once, and data exhaust helps in sharpening whatever is important. Like, if your excess data says that most of your viewers visit your site through mobile device, it’s better to develop a mobile app to serve the customers better.

All Data Is Not Important

All data is not useful. Though data exhaust is useful, yet there would be times when you will come across bad data. You need to shed off those data, and get rid of data of that manner that is meaningless. Ask data experts which data to keep and which is irrelevant. Data that is of no use needs to be destroyed, because a company cannot keep trash for long.

Be Responsible for Data

Its clear data exhaust is all good and great for business, but it’s always suggestible to be cautious and responsible. There can be many legal implications, hence its suggestible to consult a data professional who have the desired know-how, otherwise things can get a bit complicated.

In this world of competitive technology, businesses have to be very careful about how they are using data to avoid any kind of negative outcomes. Be responsible and use data correctly; big data help frame a highly effective business strategy.

Looking for good big data courses? We have good news rolling your way – DexLab Analytics offers excellent big data training in Gurgaon. If interested, check out the course itinerary RN.

The blog is sourced from – http://dataconomy.com/2018/03/how-data-exhaust-can-be-leveraged-to-benefit-your-company


Interested in a career in Data Analyst?

To learn more about Machine Learning Using Python and Spark – click here.

To learn more about Data Analyst with Advanced excel course – click here.
To learn more about Data Analyst with SAS Course – click here.
To learn more about Data Analyst with R Course – click here.
To learn more about Big Data Course – click here.

Discover: Interesting Ways Netflix Relies on Big Data

Discover: Interesting Ways Netflix Relies on Big Data

Netflix boasts of over 100 million subscribers – a humongous wealth of data is stored and analyzed to enhance user experience. Big data makes Netflix the King of Stream; it keeps the customers engaged and content.

Big data recommends Netflix a list of programs that interests the viewers and this system actually influences 80% of content that is available on Netflix. Estimates say the cutting edge algorithms save $1 billion a year in value from customer retention – undoubtedly, a whopping figure for the entertainment industry.

Big data is used extensively all through Netflix application, BUT the Holy Grail is the prediction part: what the customers want to watch and enjoy matters the most. Moreover, big data is the fuel that powers up the recommendation engines that are created to serve the purpose.

netflix-and-devices-243

Healthy prediction of viewing habits

Efforts started way back in 2006, when Netflix was primarily into DVD-mailing business. It initiated the Netflix prize, rewarding $1 million to any group, which can devise the best algorithm to predict how a customer would rate a particular movie, based on previous ratings. Today, though the algorithms are constantly updated, but the principles still remain a key characteristic of a recommendation engine.

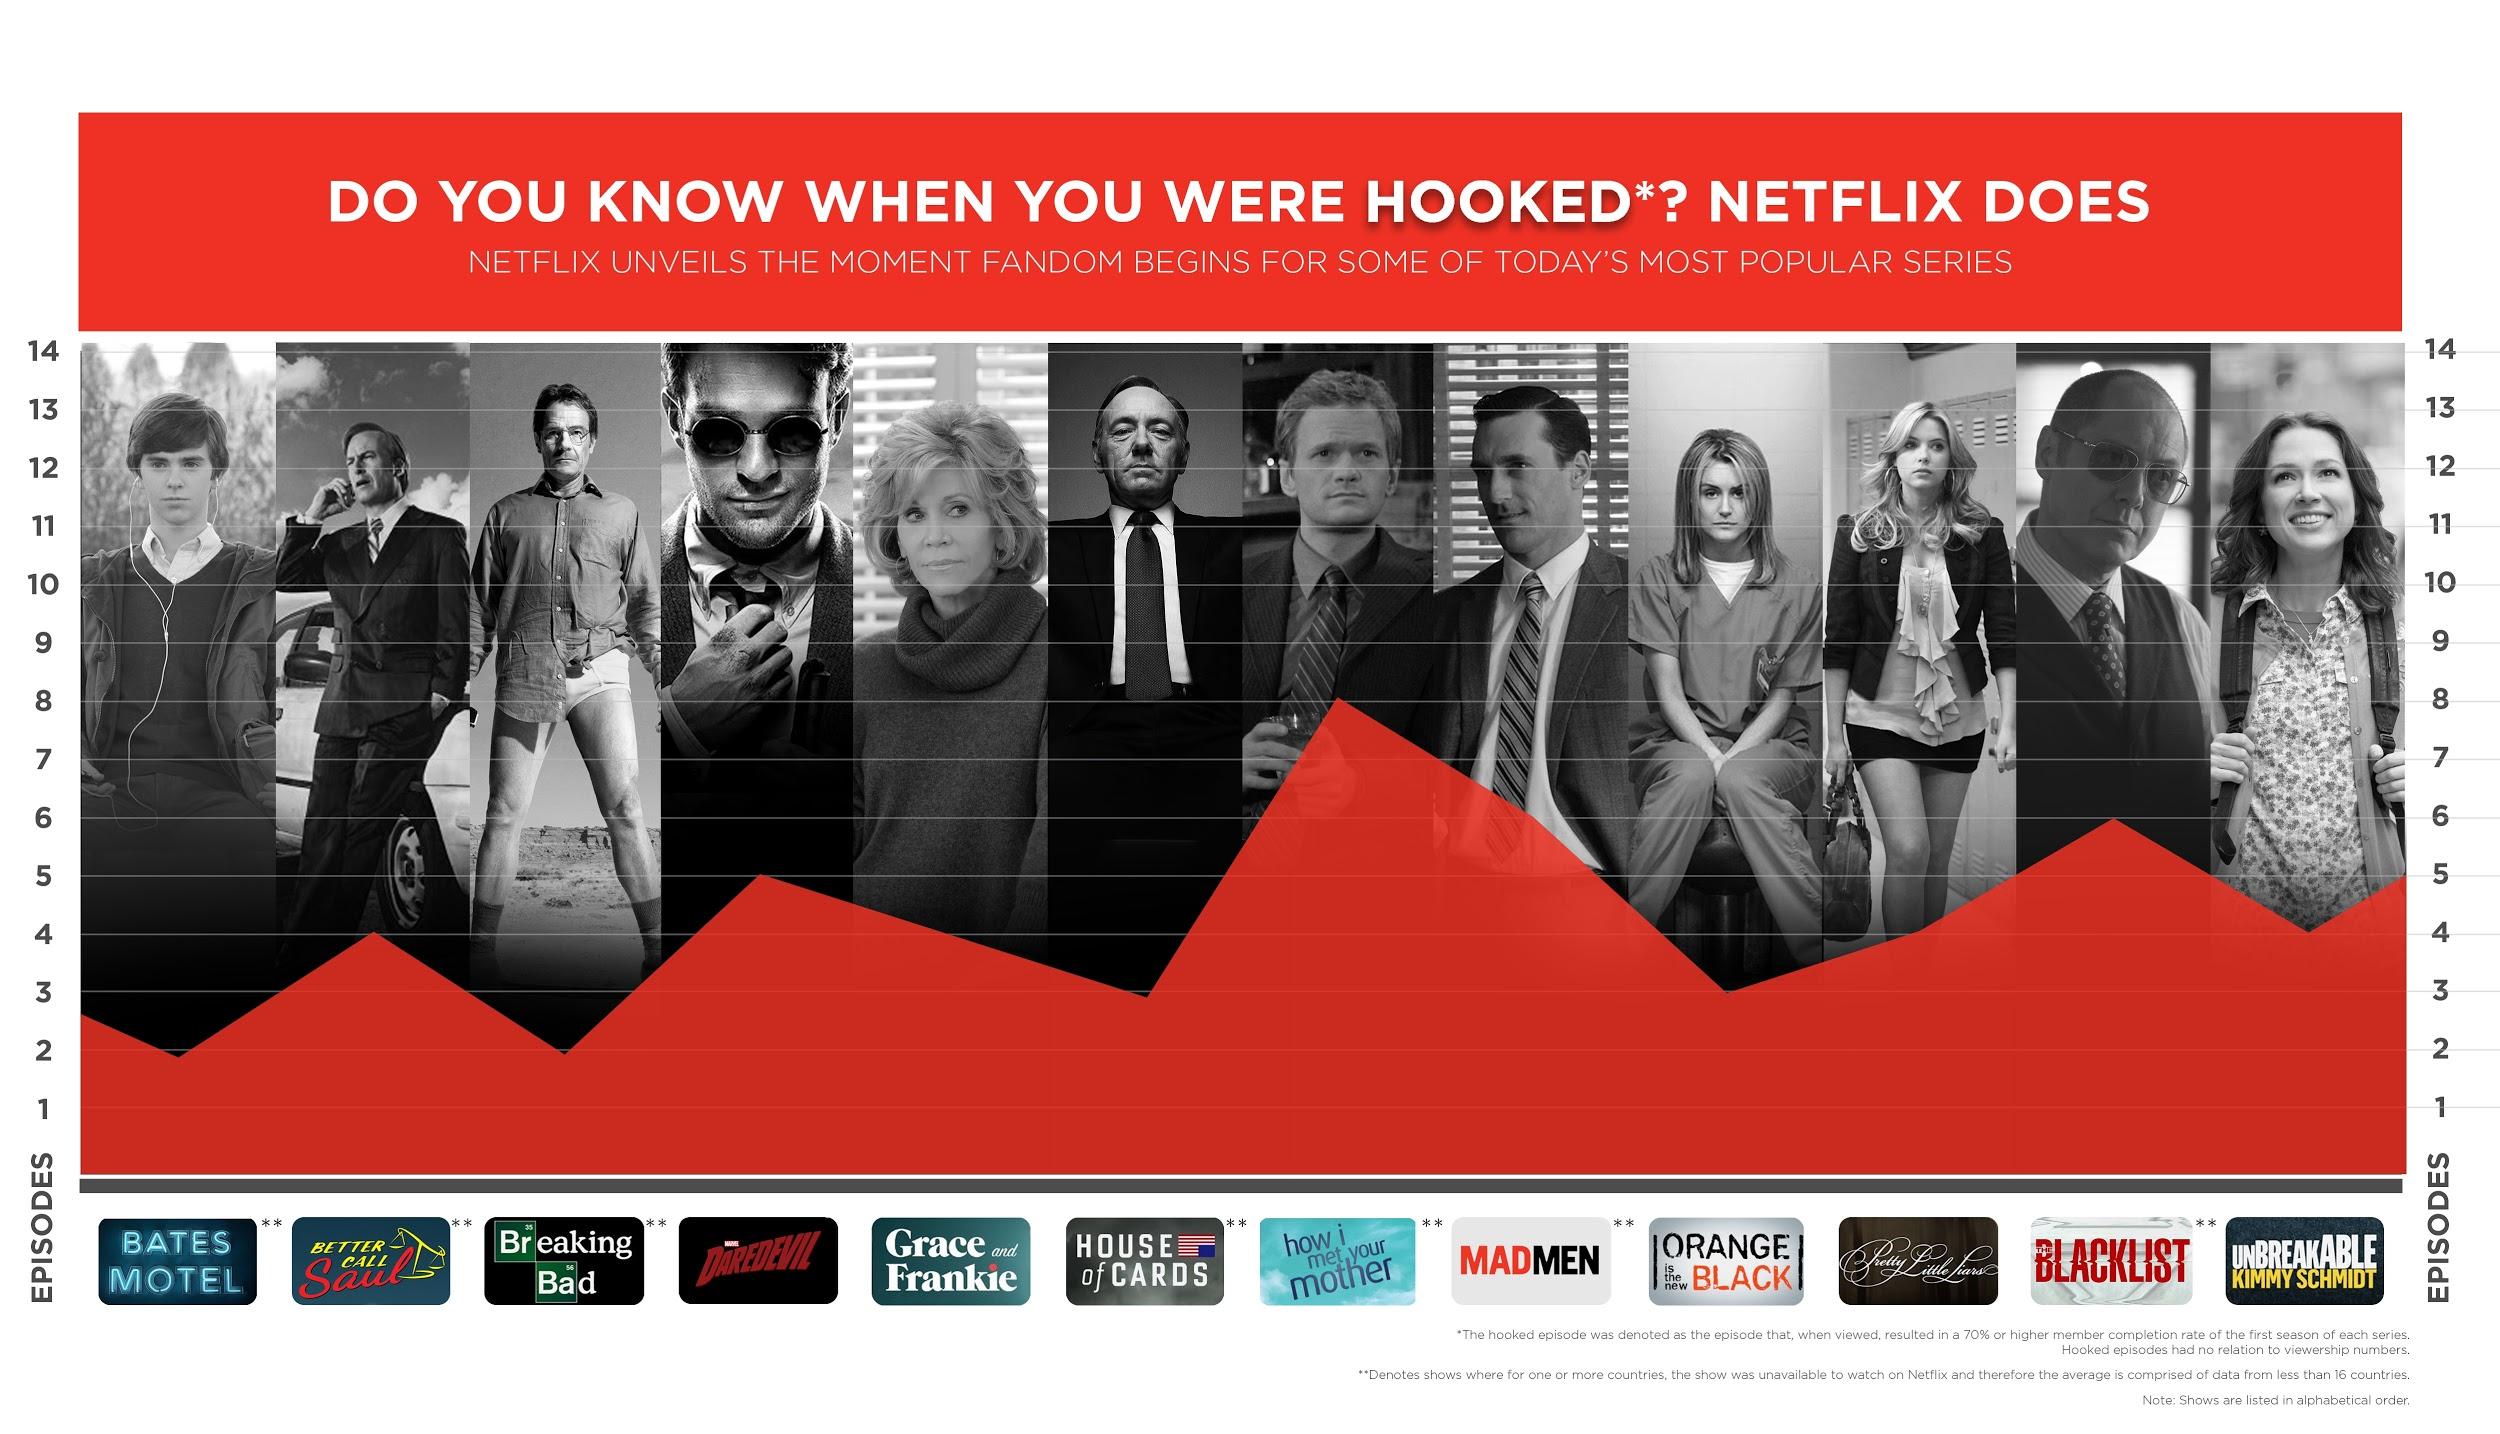
In the beginning, analysts were left with very little data about their customers, but as soon as streaming became more mainstream, new data points about their customers became easily available. What affects a particular movie had on a viewer could be assessed, as well as models were built to predict the ‘perfect storm’ situation for customers who were served with the movies they like.

Infographic-Netflix-knows-when-youre-Hooked

Identifying the next smashing series

Of late, Netflix has broadened its scope to include content creation, instead of limiting itself to being a distribution method for movie studios and other channels. This strategy is of course backed by meaningful data – which highlighted how its viewers are hungry for content directed by David Fincher and starring Kevin Spacey.

Every minute part of the production of the series is structured on data, including the colors used on the cover image of the series to draw in subscribers.

Netflix

For a quality experience

Netflix takes the quality aspect into great consideration. It closely monitors and analyzes the various factors that affect user behavior. Even, it develops models to explore how they perform. While, a large number of shows are hosted internally on its own distributed network of servers, they are also reflected around the world by ISPs and other hosts. Along with improving the user experience, efficient content streaming reduces costs for ISPs – shielding them from the cost of downloading data from Netflix server.

Big data and analytics have positioned themselves in the right order to dictate the operations across all Netflix platforms. They surely lead the pack of data by taking over distribution and production networks and re-modifying them through constant evolution and innovation of data.

Not only this, Netflix has reduced its promotional campaign budgets by targeting only the most relevant and interested people at the same time. All possible because of big data.

So, next time, when you peruse through your favorite shows in Netflix, do think and thank the power of big data. Because, big data is much more than what you think!

DexLab Analytics, a renowned big data training institute in Gurgaon is the best place to start a big data certification endeavor. The consultants are proficient in what they teach, the course curriculum is comprehensive and flexible course modules are suitable for everyone, irrespective of professionals or students.

The article has been sourced from:                                 

https://insidebigdata.com/2018/01/20/netflix-uses-big-data-drive-success

http://dataconomy.com/2018/03/infographic-how-netflix-uses-big-data-to-drive-success

https://www.linkedin.com/pulse/amazing-ways-netflix-uses-big-data-drive-success-bernard-marr


Interested in a career in Data Analyst?

To learn more about Machine Learning Using Python and Spark – click here.

To learn more about Data Analyst with Advanced excel course – click here.
To learn more about Data Analyst with SAS Course – click here.
To learn more about Data Analyst with R Course – click here.
To learn more about Big Data Course – click here.

5 Steps to Reassess Your Big Data Business Strategy

5 Steps to Reassess Your Big Data Business Strategy

Company employees at all levels need to understand the role of big data in planning business strategies. Strategic planning has to be dynamic- constantly revised and aligned with the current market trends.

As the first quarter of 2018 is nearing to its end, here are 5 domains every business needs to pay attention to:-

  • Information retention for field-based technology:

In the current tech-driven business world, a lot of information needs to be collected from field-based technologies, like drones and sensors. Owing to internet bandwidth constraints, this data has to be stored locally instead of transmitting them for collection in a central location. Bandwidth constraints affect cloud-based storage systems too. Thus, companies need to restore traditional practices of distributed data storage, which involve collecting data locally and storing them on servers or disks.

2

  • Collaboration with cloud vendors:

Cloud hosting is popular among businesses, especially in small and midsized enterprises. Onsite data activities of companies include maintenance of infrastructure and networks that ensure internal IT access. With the shift towards cloud-based applications, businesses need to revise disaster recovery plans for all kinds of data. It should be ensured that vendors adhere to corporate governance standards, implement failover if needed, and SLAs (Service Level Agreements) match business needs. It is often seen that IT strategic plans lack strong objectives pertaining to vendor management and stipulated IT service levels.

  • How a company defines ROI:

In the constantly evolving business scenario, it is necessary to periodically re-evaluate the ROI (return on investments) for a technology that was set at the time of purchasing it. Chief information officers (CIOs) should regularly evaluate ROIs of technological investments and adjust business course accordingly. ROI evaluation should be a part of IT strategic planning and needs to be revisited at least once a year. An example of changing business value that calls for ROI re-assessment is the use of IoT technology in tracking foot traffic in physical retail stores. At a point of time, this technology helped managers display the most desirable products in best positions within a store. With the shift of customer base from physical to online venues, this tech has become redundant in terms of physical merchandising.

  • How business performance is assessed:

Like shifting ROIs, KPIs (key performance indicators) for companies that are based on inferences drawn from their data, are expected to change over time. Hence, monitoring these shifting KPIs should be a part of a company’s IT strategic plan. For example, customer engagements for a business might shift from social media promotions to increased mentions of product defects. Therefore, to improve customer satisfaction, businesses should consider reducing the number of remanufacture material authorizations and IoT alerts for sensors/devices in the production processes of these goods.

  • Adoption of AI and ML:

Artificial intelligence and machine learning play major roles in the current technological overhaul. Companies need to efficiently incorporate AI-powered and ML-based technologies in their business processes. Business leaders play key roles in identifying areas of a business where these techs could add value; and then testing their effectiveness through small-scale preliminary projects. This should be an important goal in the R&D strategic planning of business houses.

Let’s Take Your Data Dreams to the Next Level

As mentioned in Harvard Business review, ‘’the problem is that, in many cases, big data is not used well. Companies are better at collecting data-about their customers, about their products, about competitors-than analyzing the data and designing strategy around it.’’

‘’Used well’’ means not only designing superior strategies but also evolving these strategies with changing market trends.

From IT to marketing- professionals in every sector are going for big data training courses to enhance their competence. Enroll for the big data Hadoop certification course in Gurgaon at DexLab Analytics– a premier data analyst training institute in Delhi.


Interested in a career in Data Analyst?

To learn more about Machine Learning Using Python and Spark – click here.

To learn more about Data Analyst with Advanced excel course – click here.
To learn more about Data Analyst with SAS Course – click here.
To learn more about Data Analyst with R Course – click here.
To learn more about Big Data Course – click here.

How Conversational AI and Chatbots are Revolutionizing Indian banking Industry

Thanks to the advancements in AI and ML, bank work can now be done with the click of a phone button! Innovations in the field of customer services form an important part of the technology overhaul. The banking sector is making hefty investments on AI technology to simplify user experience and enhance overall performance of financial institutes.

Let’s take a look at how conversational AI and chatbots are revolutionizing the Indian banking industry.

  • Keya by Kotak Mahindra Bank

Keya is the first AI-powered chatbot in Indian banking sector. It is incorporated in Kotak’s phone-banking helpline to improve its long-established interactive voice response (IVR) system.

‘’Voice commands form a significant share of search online. In addition, the nature of the call is changing with customers using voice as an escalation channel. Keya is an intelligent voicebot developed keeping in mind the customers’ changing preference for voice over text. It is built on a technology that understands a customer’s query and steers the conversation to provide a quick and relevant response”, says Puneet Kapoor, Senior Executive Vice President, Kotak Mahindra Bank.

2

  • Bank of Baroda chatbot

Akhil Handa, Head of Fintech Initiatives, Bank of Baroda said that their chatbot will manage product-related queries. He believes that the services of the chatbot will result in better customer satisfaction, speedy responses and cost minimization.

  • Citi Union Bank’s Lakshmi Bot

Lakshmi, India’s first humanoid banker is a responsive robot powered by AI. It can converse with customers on more than 125 topics, including balance, interest rates and transactional history.

  • IBM Watson by SBI

Digital platforms of SBI, like SBI inTouch, are utilizing AI-powered bots, such as IBM Watson, to enhance customer experience. SBI stated that modern times will witness the coexistence of men and machines in banks.

  • AI-driven digital initiatives by YES Bank in partnership with Payjo

Payjo is a top AI Banking platform based out of Silicon Valley in California. YES Bank has partnered with Payjo to launch YES Pay Bot, its first Bot using AI, which improves already popular wallet services. The YES Pay wallet service is trusted by more than half-a-million customers.

  • YES TAG chatbot

YES TAG chatbot has been launched by YES Bank and enables transactions through 5 messaging apps. Customers can carry out a wide range of activities, such as check balance, FD details, status of cheque, transfer money, etc. It is currently used in Android and will soon be available on Apple App Store.

  • Digibank

Asia’s largest bank, DBS Bank, has developed Digibank, which is India’s first mobile bank that is ‘chatbot staffed’. It provides real-time solution to banking related issues. This chatbot employs a trained AI platform, called KAI, which is a product of New York startup- Kasisto.

  • Axis Bank launches intelligent chatbot in association with Active.ai

Axis Bank facilitates smart banking with the launch of a chatbot that employs conversational interface to offer interactive mobile banking solutions. This intelligent chatbot was developed in association with Singapore based AI company- Active AI.

  • HDFC Bank launches OnChat in partnership with Niki.ai

To enable smooth ecommerce and banking transactions, HDFC in partnership with Niki.ai has launched a conversational chatbot, called OnChat. It is available on Facebook messenger even to people who aren’t HDFC customers. Users can recharge phone, book cabs and pay utility bills through this chatbot.

  • EVA by HDFC Bank

EVA is exclusively for the customers of HDFC Bank. It is an electronic virtual assistant developed in partnership with Senseforth, an AI startup based in Bengaluru.

  • mPower by YES Bank

mPower is a chatbot for loan products that has been developed by YES Bank in association with Gupshup-a leading bot company. It assists customers on a variety of loan related topics like personal loans, car loans and loan against securities.

In the future, there will be three kinds of bots- speech-based bot, textbots and video chatbots. Conversational bots work in harmony with human employees to enrich customer experience.

Thus, AI-powered technology is the way forward. To be industry-ready in this AI-era, enroll for the Machine Learning course in Gurgaon at Dexlab Analytics. It is a premier Analytics training institute in Delhi.


Interested in a career in Data Analyst?

To learn more about Data Analyst with Advanced excel course – Enrol Now.
To learn more about Data Analyst with R Course – Enrol Now.
To learn more about Big Data Course – Enrol Now.

To learn more about Machine Learning Using Python and Spark – Enrol Now.
To learn more about Data Analyst with SAS Course – Enrol Now.
To learn more about Data Analyst with Apache Spark Course – Enrol Now.
To learn more about Data Analyst with Market Risk Analytics and Modelling Course – Enrol Now.

Call us to know more