Big Data Analytics Archives - Page 5 of 18 - DexLab Analytics | Big Data Hadoop SAS R Analytics Predictive Modeling & Excel VBA

How Hadoop Data Lake Architecture Helps Data Integration

How Hadoop Data Lake Architecture Helps Data Integration

New data objects, like data planes, data streaming and data fabrics are gaining importance these days. However, let’s not forget the shiny data object from a few years back-Hadoop data lake architecture. Real-life Hadoop data lakes are the foundation around which many companies aim to develop better predictive analytics and sometimes even artificial intelligence.

This was the crux of discussions that took place in Hortonworks’ DataWorks Summit 2018. Here, bigwigs like Sudhir Menon shared the story behind every company wanting to use their data stores to enable digital transformation, as is the case in tech startups, like Airbnb and Uber.

In the story shared by Menon, vice president of enterprise information management at hotelier Hilton Worldwide, Hadoop data lake architecture plays a key role. He said that all the information available in different formats across different channels is being integrated into the data lake.

The Hadoop data lake architecture forms the core of a would-be consumer application that enables Hilton Honors program guests to check into their rooms directly.

A time-taking procedure:

Menon stated that the Hadoop data lake project, which began around two years back, is progressing rapidly and will start functioning soon. However, it is a ‘’multiyear project’’. The project aims to buildout the Hadoop-based Hotonworks Data Platform (HDP) into a fresh warehouse for enterprise data in a step-by-step manner.

The system makes use of a number of advanced tools, including WSO2 API management, Talend integration and Amazon Redshift cloud data warehouse software. It also employs microservices architecture to transform an assortment of ingested data into JSON events. These transformations are the primary steps in the process of refining the data. The experience of data lake users shows that the data needs to be organized immediately so that business analysts can work with the data on BI tools.

This project also provides a platform for smarter data reporting on the daily. Hilton has replaced 380 dashboards with 40 compact dashboards.

For companies like Hilton that have years of legacy data, shifting to Hadoop data lake architectures can take a good deal of effort.

Another data lake project is in progress at United Airlines, a Chicago-based airline. Their senior manager for big data analytics, Joe Olson spoke about the move to adopt a fresh big data analytics environment that incorporates data lake and a ‘’curated layer of data.’’ Then again, he also pointed out that the process of handling large data needs to be more efficient. A lot of work is required to connect Teradata data analytics warehouse with Hortonworks’ platform.

Difference in file sizes in Hadoop data lakes and single-client implementations may lead to problems related to garbage collection and can hamper the performance.

Despite these implementation problems, the Hadoop platform has fueled various advances in analytics. This has been brought about by the evolution of Verizon Wireless that can now handle bigger and diverse data sets.

2

In fact, companies now want the data lake platforms to encompass more than Hadoop. The future systems will be ‘’hybrids of on-premises and public cloud systems and, eventually, will be on multiple clouds,’’ said Doug Henschen, an analyst at Constellation Research.

Large companies are very much dependent on Hadoop for efficiently managing their data. Understandably, the job prospects in this field are also multiplying.

Are you a big data aspirant? Then you must enroll for big data Hadoop training in Gurgaon. At Dexlab industry-experts guide you through theoretical as well as practical knowledge on the subject. To help your endeavors, we have started a new admission drive #BigDataIngestion. All students get a flat discount on big data Hadoop certification courses. To know more, visit our website.


Reference: searchdatamanagement.techtarget.com/news/252443645/Hadoop-data-lake-architecture-tests-IT-on-data-integration


Interested in a career in Data Analyst?

To learn more about Data Analyst with Advanced excel course – Enrol Now.
To learn more about Data Analyst with R Course – Enrol Now.
To learn more about Big Data Course – Enrol Now.

To learn more about Machine Learning Using Python and Spark – Enrol Now.
To learn more about Data Analyst with SAS Course – Enrol Now.
To learn more about Data Analyst with Apache Spark Course – Enrol Now.
To learn more about Data Analyst with Market Risk Analytics and Modelling Course – Enrol Now.

Industry Use Cases of Big Data Hadoop Using Python – Explained

Industry Use Cases of Big Data Hadoop Using Python – Explained

Welcome to the BIG world of Big Data Hadoop – the encompassing eco-system of all open-source projects and procedures that constructs a formidable framework to manage data. Put simply, Hadoop is the bedrock of big data operations. Though the entire framework is written in Java language, it doesn’t exclude other programming languages, such as Python and C++ from being used to code intricate distributed storage and processing framework. Besides Java architects, Python-skilled data scientists can also work on Hadoop framework, write programs and perform analysis. Easily, programs can be written in Python language without the need to translate them into Java jar files.

Python as a programming language is simple, easy to understand and flexible. It is capable and powerful enough to run end-to-end advanced analytical applications. Not to mention, Python is a versatile language and here we present a few popular Python frameworks in sync with Hadoop:


  • Hadoop Streaming API
  • Dumbo
  • Mrjob
  • Pydoop
  • Hadoopy


Now, let’s take a look at how some of the top notch global companies are using Hadoop in association with Python and are bearing fruits!

Amazon

Based on the consumer research and buying pattern, Amazon recommends suitable products to the existing users. This is done by a robust machine learning engine powered by Python, which seamlessly interacts with Hadoop ecosystem, aiding in delivering top of the line product recommendation system and boosting fault tolerant database interactions.

Facebook

In the domain of image processing, Facebook is second to none. Each day, Facebook processes millions and millions of images based on unstructured data – for that Facebook had to enable HDFS; it helps store and extract enormous volumes of data, while using Python as the backend language to perform a large chunk of its Image Processing applications, including Facial Image Extraction, Image Resizing, etc.

Rightfully so, Facebook relies on Python for all its image related applications and simulates Hadoop Streaming API for better accessibility and editing of data.

Quora Search Algorithm

Quora’s backend is constructed on Python; hence it’s the language used for interaction with HDFS. Also, Quora needs to manage vast amounts of textual data, thanks to Hadoop, Apache Spark and a few other data-warehousing technologies! Quora uses the power of Hadoop coupled with Python to drag out questions from searches or for suggestions.

2

End Notes

The use of Python is varied; being dynamically typed, portable, extendable and scalable, Python has become a popular choice for big data analysts specializing in Hadoop. Mentioned below are a couple of other notable industries where use cases of Hadoop using Python are to be found:


  • YouTube uses a recommendation engine built using Python and Apache Spark.
  • Limeroad functions on an integrated Hadoop, Apache Spark and Python recommendation system to retain online visitors through a proper, well-devised search pattern.
  • Iconic animation companies, like Disney depend on Python and Hadoop; they help manage frameworks for image processing and CGI rendering.


Now, you need to start thinking about arming yourself with big data hadoop certification course – these big data courses are quite in demand now – as it’s expected that the big data and business analytics market will increase from $130.1 billion to more than $203 billion by 2020.


This article first appeared on – www.analytixlabs.co.in/blog/2016/06/13/why-companies-are-using-hadoop-with-python


Interested in a career in Data Analyst?

To learn more about Data Analyst with Advanced excel course – Enrol Now.
To learn more about Data Analyst with R Course – Enrol Now.
To learn more about Big Data Course – Enrol Now.

To learn more about Machine Learning Using Python and Spark – Enrol Now.
To learn more about Data Analyst with SAS Course – Enrol Now.
To learn more about Data Analyst with Apache Spark Course – Enrol Now.
To learn more about Data Analyst with Market Risk Analytics and Modelling Course – Enrol Now.
Why Portability is Gaining Momentum in the Field of Data

Why Portability is Gaining Momentum in the Field of Data

Ease and portability are of prime importance to businesses. Companies want to handle data in real-time; so there’s need for quick and smooth access to data. Accessibility is often the deciding factor that determines if a business will be ahead or behind in competition.

Data portability is a concept that is aimed at protecting users by making data available in a structured, machine-readable and interoperable format. It enables users to move their data from one controller to another. Organizations are required to follow common technical standards to assist transfer of data instead of storing data in ‘’walled gardens’’ that renders the data incompatible with other platforms.

Now, let’s look a little closer into why portability is so important.

Advantages:

Making data portable gives consumers the power to access data across multiple channels and platforms. It improves data transparency as individuals can look up and analyze relevant data from different companies. It will also help people to exercise their data rights and find out what information organizations are holding. Individuals will be able to make better queries.

From keeping a track of travel distance to monitoring energy consumption on the move, portable data is able to connect with various activities and is excellent for performing analytical examinations on. Portable data may be used by businesses to map consumers better and help them make better decisions, all the while collecting data very transparently. Thus, it improves data personalization.

For example, the portable data relating to a consumers grocery purchases in the past can be utilized by a grocery store to provide useful sales offers and recipes. Portable data can help doctors find quick information about a patient’s medical history- blood group, diet, regular activities and habits, etc., which will benefit the treatment. Hence, data portability can enhance our lifestyle in many ways.

Struggles:

Portable data presents a plethora of benefits for users in terms of data transparency and consumer satisfaction. However, it does have its own set of limitations too. The downside of greater transparency is security issues. It permits third parties to regularly access password protected sites and request login details from users. Scary as it may sound; people who use the same password for multiple sites are easy targets for hackers and identity thieves. They can easily access the entire digital activity of such users.

Although GDPR stipulates that data should be in a common format, that alone doesn’t secure standardization across all platforms. For example, one business may name a domain ‘’Location” while another business might call the same field ‘’Locale”.  In such cases, if the data needs to be aligned with other data sources, it has to be done manually.

According to GDPR rules, if an organization receives a request pertaining to data portability, then it has to respond within one month. While they might be willing to readily give out data to general consumers, they might hold off the same information if they perceive the request as competition.

2

Future:

Data portability runs the risk of placing unequal power in the hands of big companies who have the money power to automate data requests, set up an entire department to cater to portability requests and pay GDPR fines if needed.

Despite these issues, there are many positives. It can help track a patient’s medical statistics and provide valuable insights about the treatment; and encourage people to donate data for good causes, like research.

As businesses as well as consumers weigh the pros and cons of data portability, one thing is clear- it will be an important topic of discussion in the years to come.

Businesses consider data to be their most important asset. As the accumulation, access and analysis of data is gaining importance, the prospects for data professionals are also increasing. You must seize these lucrative career opportunities by enrolling for Big Data Hadoop certification courses in Gurgaon. We at Dexlab Analytics bring together years of industry experience, hands-on training and a comprehensive course structure to help you become industry-ready.

DexLab Analytics Presents #BigDataIngestion

Don’t miss the summer special course discounts on big data Hadoop training in Delhi. We are offering flat 10% discount to all interested students. Hurry!


Interested in a career in Data Analyst?

To learn more about Data Analyst with Advanced excel course – Enrol Now.
To learn more about Data Analyst with R Course – Enrol Now.
To learn more about Big Data Course – Enrol Now.

To learn more about Machine Learning Using Python and Spark – Enrol Now.
To learn more about Data Analyst with SAS Course – Enrol Now.
To learn more about Data Analyst with Apache Spark Course – Enrol Now.
To learn more about Data Analyst with Market Risk Analytics and Modelling Course – Enrol Now.
For a Seamless, Real-Time Integration and Access across Multiple Data Siloes, Big Data Fabric Is the Solution

For a Seamless, Real-Time Integration and Access across Multiple Data Siloes, Big Data Fabric Is the Solution

Grappling with diverse data?

No worries, data fabrics for big data is right here.

The very notion of a fabric joining computing resources and offering centralized access to a set of networks has been doing rounds since the conceptualization of grid computing as early as 1990s. However, a data fabric is a relatively new concept based on the same underlying principle, but it’s associated with data instead of a system.

As data have become increasingly diversified, the importance of data fabrics too spiked up. Now, integrating such vast pools of data is quite a problem, as data collected across various channels and operations is often withhold in discrete silos. The responsibility lies within the enterprise to bring together transactional data stores, data lakes, warehouses, unstructured data sources, social media storage, machine logs, application storage and cloud storage for management and control.  

The Change That Big Data Brings In

The escalating use of unstructured data resulted in significant issues with proper data management. While the accuracy and usability quotient remained more or less the same, the ability to control them has been reduced because of increasing velocity, variety, volume and access requirements of data. To counter the pressing challenge, companies have come with a number of solutions but the need for a centralized data access system prevails – on top of that big data adds concerns regarding data discovery and security that needs to be addressed only through a particular single access mechanism.

To taste success with big data, the enterprises need to seek access to data from a plethora of systems in real time in perfectly digestible formats – also connecting devices, including smartphones and tablets enhances storage related issues. Today, big data storage is abundantly available in Apache Spark, Hadoop and NoSQL databases that are developed with exclusive management demands.

2

The Popularity of Data Fabrics

Huge data and analytics vendors are the biggest providers of big data fabric solutions. They help offer access to all kinds of data and conjoin them into a single consolidated system. This consolidated system – big data fabric – should tackle diverse data stores, nab security issues, offer consistent management through unified APIs and software access, provide auditability, flexibility and be upgradeable and process smooth data ingestion, curation and integration.

With the rise of machine learning and artificial intelligence, the requirements of data stores increase as they form the fundamentals of model training and operations. Therefore, enterprises are always seeking a single platform and a single point for data access, they tend to reduce the intricacies of the system and ensure easy storage of data. Not only that, data scientists no longer need to focus on the complexities of data access, rather they can give their entire attention to problem-solving and decision-making.

To better understand how data fabrics provide a single platform and a single point for data access across myriad siloed systems, you need a top of the line big data certification today. Visit DexLab Analytics for recognized and well-curated big data hadoop courses in Gurgaon.

DexLab Analytics Presents #BigDataIngestion

DexLab Analytics Presents #BigDataIngestion

 
Referenes: https://tdwi.org/articles/2018/06/20/ta-all-data-fabrics-for-big-data.aspx
 

Interested in a career in Data Analyst?

To learn more about Data Analyst with Advanced excel course – Enrol Now.
To learn more about Data Analyst with R Course – Enrol Now.
To learn more about Big Data Course – Enrol Now.

To learn more about Machine Learning Using Python and Spark – Enrol Now.
To learn more about Data Analyst with SAS Course – Enrol Now.
To learn more about Data Analyst with Apache Spark Course – Enrol Now.
To learn more about Data Analyst with Market Risk Analytics and Modelling Course – Enrol Now.
Hadoop or Spark: Which Big Data Framework to Choose?

Hadoop or Spark:  Which Big Data Framework to Choose?

Feeling confused?

Of late, Spark has overtaken Hadoop for being the most active open source big data project. Though they have their differences, they both have many common uses.

To begin, they both are incredible big data frameworks. For some years, Hadoop has been leading the open source big data framework clusters but recently highly advanced Spark tends to have captured the market. The latter has become increasingly popular and for all the right reasons. But that is not to say, Hadoop is losing its significance entirely.

They don’t perform exactly the similar tasks. Neither are they mutually exclusive. Though it’s been heard that Spark can work 100X faster than Hadoop in some scenarios, it doesn’t come with its own distributed storage system, which is quite fundamental to big data projects. Distributed storage offers elaborate multi-petabyte dataset storage solution across almost infinite number of computer hard drives. As compared to expensive machinery customization which holds everything in one device, distributed system is cheap as well as scalable, which means as many devices can be added if the network of data set ever grows.

Moreover, Spark doesn’t have its own file system; it cannot organize files in a distributed way without help from third party. This is the reason why several companies think of installing Spark after Hadoop, so that superior analytical applications of Spark can employ data stored using HDFS.

So, what makes Spark win over Hadoop? It’s the SPEED. Spark is a champion of handling a large chunk of its operations ‘in memory’- this reduces a lot of time and effort, indeed. Thanks to MapReduce!

2

MapReduce writes of the data right to its physical storage medium after each activity. The main purpose of this was to ensure a fully recovery if something goes wrong – nevertheless, Spark organizes data in Resilient Distributed Datasets, where data can be easily recovered following failure or any kind of mishap.

The main driving factor behind growth of Spark lies in its adept functionality for tackling advanced data processing tasks, including machine learning and real-time stream processing. Real-time processing stands for feeding data into analytical applications the moment it’s seized, and insights are right away directed back to the users through a dashboard to inspire action. This kind of processing is nowadays very much used in big data, thus making Spark enjoy an upper hand against its Hadoop counterpart.

The technology of machine learning is right at the kernel of digital revolution – artificial intelligence and creating far-fetched algorithms is an area of analytics Spark excels at. Its speed and the sound capability to tackle streaming data are the reasons behind. Spark has its own machine learning libraries, known as MLib, while Hadoop needs to collaborate with third-party machine learning library, for example Apache Mahout.

As closing thoughts, though it appears that the two big data frameworks are stiff competitors of each other, yet this is really not the case in the reality. The corporate uses offers both the application services, letting the buyer decide which one they prefer to pick, subject to their functionality and need.

DexLab Analytics Presents #BigDataIngestion

DexLab Analytics Presents #BigDataIngestion


The good news is that DexLab offers both Hadoop and Apache Spark Certification Training. What’s more, a recent admission drive is ongoing #BigDataIngestion. Enroll now and enjoy 10% discount on big data certification training courses.


The blog originally was published on – www.forbes.com/sites/bernardmarr/2015/06/22/spark-or-hadoop-which-is-the-best-big-data-framework/2/#714061d161d6


Interested in a career in Data Analyst?

To learn more about Data Analyst with Advanced excel course – Enrol Now.
To learn more about Data Analyst with R Course – Enrol Now.
To learn more about Big Data Course – Enrol Now.

To learn more about Machine Learning Using Python and Spark – Enrol Now.
To learn more about Data Analyst with SAS Course – Enrol Now.
To learn more about Data Analyst with Apache Spark Course – Enrol Now.
To learn more about Data Analyst with Market Risk Analytics and Modelling Course – Enrol Now.
Hierarchical Clustering: Foundational Concepts and Example of Agglomerative Clustering

Hierarchical Clustering: Foundational Concepts and Example of Agglomerative Clustering

Clustering is the process of organizing objects into groups called clusters. The members of a cluster are ‘’similar’’ between them and ‘’dissimilar’’ to members of other groups.

In the previous blog, we have discussed basic concepts of clustering and given an overview of the various methods of clustering. In this blog, we will take up Hierarchical Clustering in greater details.

Hierarchical Clustering:

Hierarchical Clustering is a method of cluster analysis that develops a hierarchy (ladder) of clusters. The two main techniques used for hierarchical clustering are Agglomerative and Divisive.

Agglomerative Clustering:

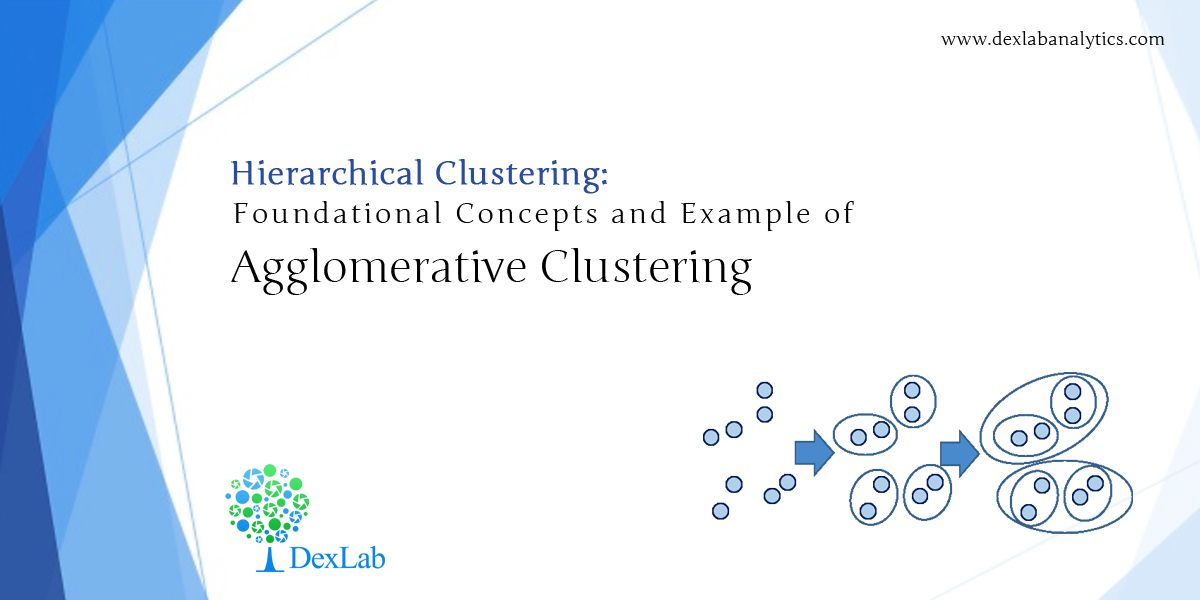
In the beginning of the analysis, each data point is treated as a singleton cluster. Then, clusters are combined until all points have been merged into a single remaining cluster. This method of clustering wherein a ‘’bottom up’’ approach is followed and clusters are merged as one moves up the hierarchy is called Agglomerative clustering.

Linkage types:

The clustering is done with the help of linkage types. A particular linkage type is used to get the distance between points and then assign it to various clusters. There are three linkage types used in Hierarchical clustering- single linkage, complete linkage and average linkage.

Single linkage hierarchical clustering: In this linkage type, two clusters whose two closest members have the shortest distance (or two clusters with the smallest minimum pairwise distance) are merged in each step.

Complete linkage hierarchical clustering: In this type, two clusters whose merger has the smallest diameter (two clusters having the smallest maximum pairwise distance) are merged in each step.

Average linkage hierarchical clustering: In this type, two clusters whose merger has the smallest average distance between data points (or two clusters with the smallest average pairwise distance), are merged in each step.

Single linkage looks at the minimum distance between points, complete linkage looks at the maximum distance between points while average linkage looks at the average distance between points.

Now, let’s look at an example of Agglomerative clustering.

The first step in clustering is computing the distance between every pair of data points that we want to cluster. So, we form a distance matrix. It should be noted that a distance matrix is symmetrical (distance between x and y is the same as the distance between y and x) and has zeros in its diagonal (every point is at a distance zero from itself). The table below shows a distance matrix- only lower triangle is shown an as the upper one can be filled with reflection.

Next, we begin clustering. The smallest distance is between 3 and 5 and they get merged first into the cluster ‘35’.

After this, we replace the entries 3 and 5 by ‘35’ and form a new distance matrix. Here, we are employing complete linkage clustering. The distance between ‘35’ and a data point is the maximum of the distance between the specific data point and 3 or the specific data point and 5. This is followed for every data point. For example, D(1,3)=3 and D(1,5) =11, so as per complete linkage clustering rules we take D(1,’35’)=11. The new distance matrix is shown below.

Again, the items with the smallest distance get clustered. This will be 2 and 4. Following this process for 6 steps, everything gets clustered. This has been summarized in the diagram below. In this plot, y axis represents the distance between data points at the time of clustering and this is known as cluster height.

Complete Linkage

If single linkage clustering was used for the same distance matrix, then we would get a single linkage dendogram as shown below. Here, we start with cluster ‘35’. But the distance between ‘35’ and each data point is the minimum of D(x,3) and D(x,5). Therefore, D(1,’35’)=3.

Single Linkage

Agglomerative hierarchical clustering finds many applications in marketing. It is used to group customers together on the basis of product preference and liking. It effectively determines variations in consumer preferences and helps improving marketing strategies.

In the next blog, we will explain Divisive clustering and other important methods of clustering, like Ward’s Method. So, stay tuned and follow Dexlab Analytics. We are a leading big data Hadoop training institute in Gurgaon. Enroll for our expert-guided certification courses on big data Hadoop and avail flat 10% discount!

DexLab Analytics Presents #BigDataIngestion

DexLab Analytics Presents #BigDataIngestion


Check back for the blog A Comprehensive Guide on Clustering and Its Different Methods


Interested in a career in Data Analyst?

To learn more about Data Analyst with Advanced excel course – Enrol Now.
To learn more about Data Analyst with R Course – Enrol Now.
To learn more about Big Data Course – Enrol Now.

To learn more about Machine Learning Using Python and Spark – Enrol Now.
To learn more about Data Analyst with SAS Course – Enrol Now.
To learn more about Data Analyst with Apache Spark Course – Enrol Now.
To learn more about Data Analyst with Market Risk Analytics and Modelling Course – Enrol Now.
Predicting World Cup Winner 2018 with Big Data

Predicting World Cup Winner 2018 with Big Data

Is there any way to predict who will win World Cup 2018?

Could big data be used to decipher the internal mechanisms of this beautiful game?

How to collect meaningful insights about a team before supporting one?

Data Points

Opta Sports and STATS help predict which teams will perform better. These are the two sports companies that have answers to all the above questions. Their objective is to collect data and interpret it for their clients, mainly sports teams, federations and of course media, always hungry for data insights.

How do they do it? Opta’s marketing manager Peter Deeley shares that for each football match, his company representatives collects as many as 2000 individual data points, mostly focused on ‘on-ball’ actions. Generally, a team of three analysts operates from the company’s data hub in Leeds; they record everything happening on the pitch and analyze the positions on the field where each interaction takes place. The clients receive live data; that’s the reason why Gary Lineker, former England player is able to share information like possession and shots on goal during half time.

The same procedure is followed at Stats.com; Paul Power, a data scientist from Stats.com explains how they don’t rely only on humans for data collection, but on latest computer vision technologies. Though computer vision can be used to log different sorts of data, yet it can never replace human beings altogether. “People are still best because of nuances that computers are not going to be able to understand,” adds Paul.

Who is going to win?

In this section, we’re going to hit the most important question of this season – which team is going to win this time? As far as STATS is concerned, it’s not too eager to publish its predictions this year. The reason being they believe is a very valuable piece of information and by spilling the beans they don’t want to upset their clients.

On the other hand, we do have a prediction from Opta. According to them, veteran World Cup champion Brazil holds the highest chance of taking home the trophy – giving them a 14.2% winning chance. What’s more, Opta also has a soft corner for Germany – thus giving them an 11.4% chance of bringing back the cup once again.

If it’s about prediction and accuracy, we can’t help but mention EA Sports. For the last 3 World Cups, it maintained a track record of predicting the eventual World Cup winner impeccably. Using the encompassing data about the players and team rankings in FIFA 2018, the company representatives ran a simulation of the tournament, in which France came out to be the winner, defeating Germany in the final. As it has already predicted right about Germany and Spain in 2014 and 2010 World Cups, consecutively, this new revelation is a good catch.

So, can big data predict the World Cup winner? We guess yes, somehow.

DexLab Analytics Presents #BigDataIngestion

If you are interested in big data hadoop certification in Noida, we have some good news coming your way! DexLab Analytics has started a new admission drive for prospective students interested in big data and data science certification. Enroll in #BigDataIngestion and enjoy 10% off on in-demand courses, including data science, machine learning, hadoop and business analytics.


The blog has been sourced from – https://www.techradar.com/news/world-cup-2018-predictions-with-big-data-who-is-going-to-win-what-and-when


Interested in a career in Data Analyst?

To learn more about Data Analyst with Advanced excel course – Enrol Now.
To learn more about Data Analyst with R Course – Enrol Now.
To learn more about Big Data Course – Enrol Now.

To learn more about Machine Learning Using Python and Spark – Enrol Now.
To learn more about Data Analyst with SAS Course – Enrol Now.
To learn more about Data Analyst with Apache Spark Course – Enrol Now.
To learn more about Data Analyst with Market Risk Analytics and Modelling Course – Enrol Now.

Secrets behind the Success of AI Implanted Analytics Processes

Secrets behind the Success of AI Implanted Analytics Processes

Big data combined with machine learning results in a powerful tool. Businesses are using this combination more and more, with many believing that the age of AI has already begun. Machine learning embedded in analytics processes opens new gateways to success, but companies must be careful about how they use this power. Organizations use this powerful platform in various domains, such as fraud detection, boosting cybersecurity and carrying out personalized marketing campaigns.

Machine learning isn’t a technology that simply speeds up the process of solving existing problems, it holds the potential to provide solutions that weren’t even thought of before; boost innovation and identify problem areas that went unnoticed.  To utilize this potent tech the best possible way, companies need to be aware of AI’s strengths as well as limitations. Businesses need to adopt renewed ways of harnessing the power of AI and analytics. Here are the top 4 ways to make the most out of AI and big data.

Context is the key:

Sifting through available information, machine learning can provide insights that are compelling and trustworthy. But, it lacks the ability to judge which results are valuable. For example, taking up a query from a garment store owner, it will provide suggestions based on previous sales and demographic information. However, the store owner might see that some of these suggestions are redundant or impractical. Moreover, humans need to program AI so that it takes into account variables and selects relevant data sets to analyze. Hence, context is the key. Business owners need to present the proper context, based on which AI will provide recommendations.

Broaden your realm of queries:

Machine learning can offer a perfect answer to your query. But, it can do much more. It might stun you by providing appropriate solutions to queries you didn’t even ask. For example, if you are trying to convince a customer to take a particular loan, then machine learning can crunch huge data sets and provide a solution. But is drawing more loans your real goal? Or is the bigger goal increasing revenues? If this is your actual goal, then AI might provide amazing solutions, like opening a new branch, which you probably didn’t even think about. In order to elicit such responses, you must broaden the realm of queries so that it covers different responses.

Have faith in the process:

AI can often figure things out that it wasn’t trained to understand and we might never comprehend how that happened. This is one of the wonders of AI. For example, Google’s neural network was shown YouTube videos for a few days and it learnt to identify cats, something it wasn’t taught.

Such unprecedented outcomes might be welcome for Google, but most businesses want to trust AI, and for that they seek to know how techs arrive at solutions. The insights provided by machine learning are amazing but businesses can act on them only if they trust the tech. It takes time to trust machines, just like it is with humans. In the beginning we might feel the need to verify outputs, but as the algorithms give good results repeatedly, trust comes naturally.

2

Act sensibly:

Machine learning is a powerful tool that can backfire too. An example of that is the recent misuse of Facebook’s data by Cambridge Analytica, which couldn’t be explained by Facebook authorities too. Companies need to be aware of the consequences of using such an advanced technology. They need to be mindful of how employees use results generated by analytics tools and how third parties handle data that has been shared. All employees don’t need to know that AI is used for inner business processes.

Artificial Intelligence can fuel growth and efficiency for companies, but it takes people to make the best use of it. And how can you take advantage of this data-dominated business world? Enroll for big data Hadoop certification in Gurgaon. As DexLab Analytic’s #BigDataIngestion campaign is ongoing, interested students can enjoy flat 10% discount on big data Hadoop training and data science certifications.

Enjoy 10% Discount, As DexLab Analytics Launches #BigDataIngestion
DexLab Analytics Presents #BigDataIngestion

References: https://www.infoworld.com/article/3272886/artificial-intelligence/big-data-ai-context-trust-and-other-key-secrets-to-success.html


Interested in a career in Data Analyst?

To learn more about Data Analyst with Advanced excel course – Enrol Now.
To learn more about Data Analyst with R Course – Enrol Now.
To learn more about Big Data Course – Enrol Now.

To learn more about Machine Learning Using Python and Spark – Enrol Now.
To learn more about Data Analyst with SAS Course – Enrol Now.
To learn more about Data Analyst with Apache Spark Course – Enrol Now.
To learn more about Data Analyst with Market Risk Analytics and Modelling Course – Enrol Now.

7-Step Framework to Ensure Big Data Quality

7-Step Framework to Ensure Big Data Quality

Ensuring data quality is of paramount importance in today’s data-driven business world because poor quality can render all kinds of data completely useless. Moreover, this data is unreliable and lead to faulty business strategies if analyzed. Data quality is the key to making trustworthy business decisions.

Companies lacking correct data-quality framework are likely to encounter a crisis situation. According to certain reports, big companies are incurring losses of around $9 million/year due to poor data quality. Back in 2013, US Postal Service spent around $1.5 billion in processing mails that were undelivered due to bad data quality.

2

While the sources of poor quality data can be many, including data entry, data processing and stale data, data in motion is the most vulnerable. The moment data enters the systems of an organization it starts to move. There’s a lot of uncertainty about how to monitor moving data, and the existing processes are fragmented and ad-hoc. Data environments are becoming more and more complex, and the volume, variety and speed of big data can be quite overwhelming.

Here, we have listed some essential steps to ensure that your data is consistently of good quality.

  • Discover: Systems carrying critical information need to be identified first. For this, source and target system owners must jointly work to discover existing data issues, set quality standards and fix measurement metrics. So, this step ensures that the company has established yardsticks against which data quality of various systems will be measured. However, this isn’t a onetime process, rather it a continuous process that needs to evolve with time.
  • Define: it is crucial to clearly define the pain points and potential risks associated with poor data quality. Often, some of these definitions might be relevant to only one particular organization, whereas many times these are associated with regulations of the industry/sector the company belongs to.
  • Assessment: Existing data needs to be assessed against different dimensions, such as accuracy, completeness and consistency of key attributes; timeliness of data, etc. Depending upon the data, qualitative or quantitative assessment might be performed. Existing data policies and their adherence to industry guidelines need to be reviewed.
  • Measurement Scale: It is important to develop a data measurement scale that can assign numerical values to different attributes. It is better to express definitions using arithmetic values, such as percentages. For example: Instead of categorizing data as good data and bad data, it can be classified as- acceptable data has >95% accuracy.
  • Design: Robust management processes need to be designed to address risks identified in the previous steps. The data-quality analysis rules need to apply to all the processes. This is especially important for large data sets, where entire data sets need to be analyzed instead of samples, and in such cases the designed solutions must run on Hadoop.
  • Deploy: Set up appropriate controls, with priority given to the most risky data systems. People executing the controls are as important as the technologies behind them.
  • Monitor: Once the controls are set up, data quality standards determined in ‘discovery’ phase need to be monitored closely. An automated system is the best for continuous monitoring as it saves both time and money.

Thus, achieving high-quality data requires an all-inclusive platform that continuously monitors data and flags and stops bad data before they can harm business processes. Hadoop is the popular choice for data quality management across the entire enterprise.

Enjoy 10% Discount, As DexLab Analytics Launches #BigDataIngestion
DexLab Analytics Presents #BigDataIngestion


If you are looking for big data Hadoop certification in Gurgaon, visit Dexlab Analytics. We are offering flat 10% discount on our big data Hadoop training courses in Gurgaon. Interested students all over India must visit our website for more details. Our professional guidance will prove highly beneficial for all those wanting to build a career in the field of big data analytics.


Interested in a career in Data Analyst?

To learn more about Data Analyst with Advanced excel course – Enrol Now.
To learn more about Data Analyst with R Course – Enrol Now.
To learn more about Big Data Course – Enrol Now.

To learn more about Machine Learning Using Python and Spark – Enrol Now.
To learn more about Data Analyst with SAS Course – Enrol Now.
To learn more about Data Analyst with Apache Spark Course – Enrol Now.
To learn more about Data Analyst with Market Risk Analytics and Modelling Course – Enrol Now.

Call us to know more