Analytics Archives - Page 4 of 9 - DexLab Analytics | Big Data Hadoop SAS R Analytics Predictive Modeling & Excel VBA

7-Step Framework to Ensure Big Data Quality

7-Step Framework to Ensure Big Data Quality

Ensuring data quality is of paramount importance in today’s data-driven business world because poor quality can render all kinds of data completely useless. Moreover, this data is unreliable and lead to faulty business strategies if analyzed. Data quality is the key to making trustworthy business decisions.

Companies lacking correct data-quality framework are likely to encounter a crisis situation. According to certain reports, big companies are incurring losses of around $9 million/year due to poor data quality. Back in 2013, US Postal Service spent around $1.5 billion in processing mails that were undelivered due to bad data quality.

2

While the sources of poor quality data can be many, including data entry, data processing and stale data, data in motion is the most vulnerable. The moment data enters the systems of an organization it starts to move. There’s a lot of uncertainty about how to monitor moving data, and the existing processes are fragmented and ad-hoc. Data environments are becoming more and more complex, and the volume, variety and speed of big data can be quite overwhelming.

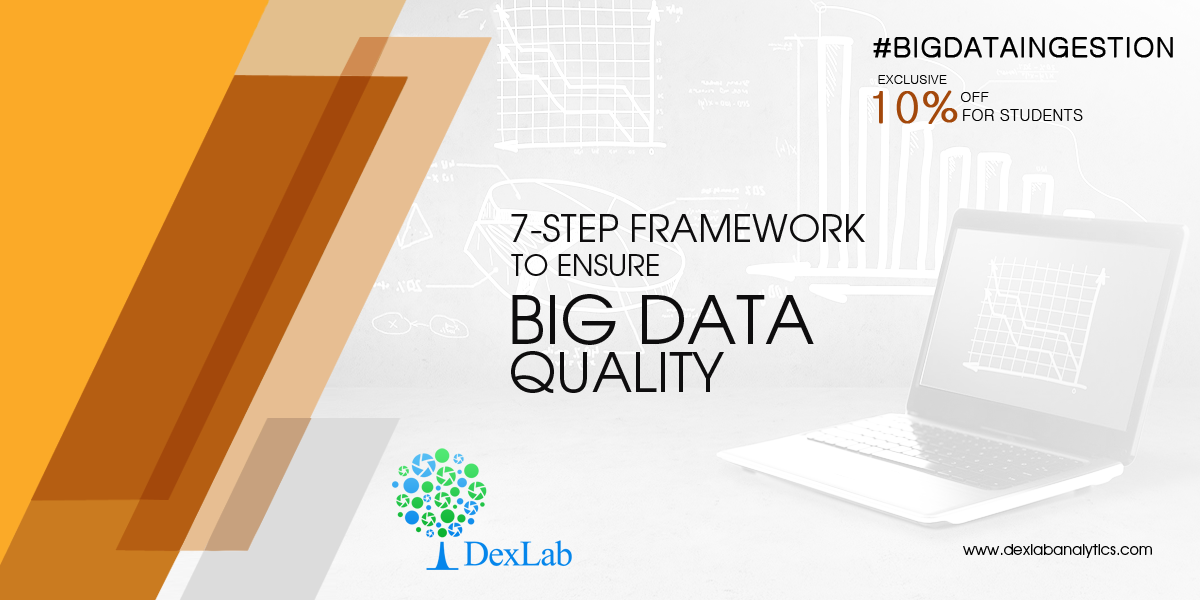
Here, we have listed some essential steps to ensure that your data is consistently of good quality.

  • Discover: Systems carrying critical information need to be identified first. For this, source and target system owners must jointly work to discover existing data issues, set quality standards and fix measurement metrics. So, this step ensures that the company has established yardsticks against which data quality of various systems will be measured. However, this isn’t a onetime process, rather it a continuous process that needs to evolve with time.
  • Define: it is crucial to clearly define the pain points and potential risks associated with poor data quality. Often, some of these definitions might be relevant to only one particular organization, whereas many times these are associated with regulations of the industry/sector the company belongs to.
  • Assessment: Existing data needs to be assessed against different dimensions, such as accuracy, completeness and consistency of key attributes; timeliness of data, etc. Depending upon the data, qualitative or quantitative assessment might be performed. Existing data policies and their adherence to industry guidelines need to be reviewed.
  • Measurement Scale: It is important to develop a data measurement scale that can assign numerical values to different attributes. It is better to express definitions using arithmetic values, such as percentages. For example: Instead of categorizing data as good data and bad data, it can be classified as- acceptable data has >95% accuracy.
  • Design: Robust management processes need to be designed to address risks identified in the previous steps. The data-quality analysis rules need to apply to all the processes. This is especially important for large data sets, where entire data sets need to be analyzed instead of samples, and in such cases the designed solutions must run on Hadoop.
  • Deploy: Set up appropriate controls, with priority given to the most risky data systems. People executing the controls are as important as the technologies behind them.
  • Monitor: Once the controls are set up, data quality standards determined in ‘discovery’ phase need to be monitored closely. An automated system is the best for continuous monitoring as it saves both time and money.

Thus, achieving high-quality data requires an all-inclusive platform that continuously monitors data and flags and stops bad data before they can harm business processes. Hadoop is the popular choice for data quality management across the entire enterprise.

Enjoy 10% Discount, As DexLab Analytics Launches #BigDataIngestion
DexLab Analytics Presents #BigDataIngestion


If you are looking for big data Hadoop certification in Gurgaon, visit Dexlab Analytics. We are offering flat 10% discount on our big data Hadoop training courses in Gurgaon. Interested students all over India must visit our website for more details. Our professional guidance will prove highly beneficial for all those wanting to build a career in the field of big data analytics.


Interested in a career in Data Analyst?

To learn more about Data Analyst with Advanced excel course – Enrol Now.
To learn more about Data Analyst with R Course – Enrol Now.
To learn more about Big Data Course – Enrol Now.

To learn more about Machine Learning Using Python and Spark – Enrol Now.
To learn more about Data Analyst with SAS Course – Enrol Now.
To learn more about Data Analyst with Apache Spark Course – Enrol Now.
To learn more about Data Analyst with Market Risk Analytics and Modelling Course – Enrol Now.

How Big Data Is Influencing HR Analytics for Employees and Employers, Both

How Big Data Is Influencing HR Analytics for Employees and Employers, Both

HR analytics powered by big data is aiding talent management and hiring decisions. A Deloitte 2015 report says 35% of companies surveyed revealed that they were actively developing suave data analytics strategies for HR. Moreover, big data analytics isn’t leaving us anytime soon; it’s here to stay for good.

Now, with that coming, employers are of course in an inapt position: whether to use HR analytics or not? And even if they do use the data, how are they going to do that without violating any HR policies/laws or upsetting the employees?

2

Health Data

While most of the employers are concerned about healthcare and wellness programs for their employees, a whole lot of other employees have started employing HR analytics for evaluation of the program’s effectiveness and addressing the gaps in healthcare coverage with an aim to improve overall program performance.

Today, data is the lifeblood of IT services. Adequate pools of employee data in conjunction with company data are aiding discoveries of the best benefit package for employees where they get best but affordable care. However, in the process, the employers need to be very careful and sensitive to employee privacy at the same time. During data analysis, the process should appear as if the entire organization is involved in it, instead of focusing on a single employee or sub-groups.

Predictive Performance Analytics

For talent management, HR analytics is a saving grace. Especially, owing to its predictive performance. Because of that, more and more employers are deploying this powerful skill to determine future hiring needs and structure a strong powerhouse of talent.

Rightfully so, predictive performance analytics use internal employee data to calculate potential employee turnover, but unfortunately, in some absurd cases, the same data can also be used to influence decisions regarding firing and promotion – and that becomes a problem.

Cutting edge machine learning algorithms dictate whether an event is going to happen or not, instead of what employees are doing or saying. Though it comes with its own advantages, its better when people frame decisions based on data. Because, people are unpredictable and so are the influencing factors.

Burn away irrelevant information

Sometimes, it may happen that employers instead of focusing on the meaningful things end up scrutinizing all the wrong things. For example, HR analytics show that employees living close to the office, geographically, are less likely to leave the office premise early. But, based on this, can we pass off top talent just because they reside a little farther from the office? We can’t, right?!

Hence, the bottom line is, whenever it comes to analyzing data, analysts should always look for the bigger picture rather giving stress on minute features – such as which employee is taking more number of leaves, and so on. Stay ahead of the curve by making the most productive decisions for employees as well as business, as a whole.

In the end, the power of data matters. HR analytics help guide the best decisions, but it’s us who are going to make them. We shouldn’t forget that. Use big data analytics responsibly to prevent any kind of mistrust or legal issues from the side of employees, and deploy them in coordination with employee feedback to come at the best conclusions ever. 

Those who are inclined towards big data hadoop certification, we’ve some droolworthy news for you! DexLab Analytics, a prominent data science learning platform has launched a new admission drive: #BigDataIngestion on in-demand skills: data science and big data with exclusive 10% discounts for all students. This summer, unfurl your career’s wings of success with DexLab Analytics!


Get the details here : www.dexlabanalytics.com/events/dexlab-analytics-presents-bigdataingestion


Reference:

The article has been sourced from https://www.entrepreneur.com/article/271753


Interested in a career in Data Analyst?

To learn more about Data Analyst with Advanced excel course – Enrol Now.
To learn more about Data Analyst with R Course – Enrol Now.
To learn more about Big Data Course – Enrol Now.

To learn more about Machine Learning Using Python and Spark – Enrol Now.
To learn more about Data Analyst with SAS Course – Enrol Now.
To learn more about Data Analyst with Apache Spark Course – Enrol Now.
To learn more about Data Analyst with Market Risk Analytics and Modelling Course – Enrol Now.

Discover: Interesting Ways Netflix Relies on Big Data

Discover: Interesting Ways Netflix Relies on Big Data

Netflix boasts of over 100 million subscribers – a humongous wealth of data is stored and analyzed to enhance user experience. Big data makes Netflix the King of Stream; it keeps the customers engaged and content.

Big data recommends Netflix a list of programs that interests the viewers and this system actually influences 80% of content that is available on Netflix. Estimates say the cutting edge algorithms save $1 billion a year in value from customer retention – undoubtedly, a whopping figure for the entertainment industry.

Big data is used extensively all through Netflix application, BUT the Holy Grail is the prediction part: what the customers want to watch and enjoy matters the most. Moreover, big data is the fuel that powers up the recommendation engines that are created to serve the purpose.

netflix-and-devices-243

Healthy prediction of viewing habits

Efforts started way back in 2006, when Netflix was primarily into DVD-mailing business. It initiated the Netflix prize, rewarding $1 million to any group, which can devise the best algorithm to predict how a customer would rate a particular movie, based on previous ratings. Today, though the algorithms are constantly updated, but the principles still remain a key characteristic of a recommendation engine.

In the beginning, analysts were left with very little data about their customers, but as soon as streaming became more mainstream, new data points about their customers became easily available. What affects a particular movie had on a viewer could be assessed, as well as models were built to predict the ‘perfect storm’ situation for customers who were served with the movies they like.

Infographic-Netflix-knows-when-youre-Hooked

Identifying the next smashing series

Of late, Netflix has broadened its scope to include content creation, instead of limiting itself to being a distribution method for movie studios and other channels. This strategy is of course backed by meaningful data – which highlighted how its viewers are hungry for content directed by David Fincher and starring Kevin Spacey.

Every minute part of the production of the series is structured on data, including the colors used on the cover image of the series to draw in subscribers.

Netflix

For a quality experience

Netflix takes the quality aspect into great consideration. It closely monitors and analyzes the various factors that affect user behavior. Even, it develops models to explore how they perform. While, a large number of shows are hosted internally on its own distributed network of servers, they are also reflected around the world by ISPs and other hosts. Along with improving the user experience, efficient content streaming reduces costs for ISPs – shielding them from the cost of downloading data from Netflix server.

Big data and analytics have positioned themselves in the right order to dictate the operations across all Netflix platforms. They surely lead the pack of data by taking over distribution and production networks and re-modifying them through constant evolution and innovation of data.

Not only this, Netflix has reduced its promotional campaign budgets by targeting only the most relevant and interested people at the same time. All possible because of big data.

So, next time, when you peruse through your favorite shows in Netflix, do think and thank the power of big data. Because, big data is much more than what you think!

DexLab Analytics, a renowned big data training institute in Gurgaon is the best place to start a big data certification endeavor. The consultants are proficient in what they teach, the course curriculum is comprehensive and flexible course modules are suitable for everyone, irrespective of professionals or students.

The article has been sourced from:                                 

https://insidebigdata.com/2018/01/20/netflix-uses-big-data-drive-success

http://dataconomy.com/2018/03/infographic-how-netflix-uses-big-data-to-drive-success

https://www.linkedin.com/pulse/amazing-ways-netflix-uses-big-data-drive-success-bernard-marr


Interested in a career in Data Analyst?

To learn more about Machine Learning Using Python and Spark – click here.

To learn more about Data Analyst with Advanced excel course – click here.
To learn more about Data Analyst with SAS Course – click here.
To learn more about Data Analyst with R Course – click here.
To learn more about Big Data Course – click here.

5 Steps to Reassess Your Big Data Business Strategy

5 Steps to Reassess Your Big Data Business Strategy

Company employees at all levels need to understand the role of big data in planning business strategies. Strategic planning has to be dynamic- constantly revised and aligned with the current market trends.

As the first quarter of 2018 is nearing to its end, here are 5 domains every business needs to pay attention to:-

  • Information retention for field-based technology:

In the current tech-driven business world, a lot of information needs to be collected from field-based technologies, like drones and sensors. Owing to internet bandwidth constraints, this data has to be stored locally instead of transmitting them for collection in a central location. Bandwidth constraints affect cloud-based storage systems too. Thus, companies need to restore traditional practices of distributed data storage, which involve collecting data locally and storing them on servers or disks.

2

  • Collaboration with cloud vendors:

Cloud hosting is popular among businesses, especially in small and midsized enterprises. Onsite data activities of companies include maintenance of infrastructure and networks that ensure internal IT access. With the shift towards cloud-based applications, businesses need to revise disaster recovery plans for all kinds of data. It should be ensured that vendors adhere to corporate governance standards, implement failover if needed, and SLAs (Service Level Agreements) match business needs. It is often seen that IT strategic plans lack strong objectives pertaining to vendor management and stipulated IT service levels.

  • How a company defines ROI:

In the constantly evolving business scenario, it is necessary to periodically re-evaluate the ROI (return on investments) for a technology that was set at the time of purchasing it. Chief information officers (CIOs) should regularly evaluate ROIs of technological investments and adjust business course accordingly. ROI evaluation should be a part of IT strategic planning and needs to be revisited at least once a year. An example of changing business value that calls for ROI re-assessment is the use of IoT technology in tracking foot traffic in physical retail stores. At a point of time, this technology helped managers display the most desirable products in best positions within a store. With the shift of customer base from physical to online venues, this tech has become redundant in terms of physical merchandising.

  • How business performance is assessed:

Like shifting ROIs, KPIs (key performance indicators) for companies that are based on inferences drawn from their data, are expected to change over time. Hence, monitoring these shifting KPIs should be a part of a company’s IT strategic plan. For example, customer engagements for a business might shift from social media promotions to increased mentions of product defects. Therefore, to improve customer satisfaction, businesses should consider reducing the number of remanufacture material authorizations and IoT alerts for sensors/devices in the production processes of these goods.

  • Adoption of AI and ML:

Artificial intelligence and machine learning play major roles in the current technological overhaul. Companies need to efficiently incorporate AI-powered and ML-based technologies in their business processes. Business leaders play key roles in identifying areas of a business where these techs could add value; and then testing their effectiveness through small-scale preliminary projects. This should be an important goal in the R&D strategic planning of business houses.

Let’s Take Your Data Dreams to the Next Level

As mentioned in Harvard Business review, ‘’the problem is that, in many cases, big data is not used well. Companies are better at collecting data-about their customers, about their products, about competitors-than analyzing the data and designing strategy around it.’’

‘’Used well’’ means not only designing superior strategies but also evolving these strategies with changing market trends.

From IT to marketing- professionals in every sector are going for big data training courses to enhance their competence. Enroll for the big data Hadoop certification course in Gurgaon at DexLab Analytics– a premier data analyst training institute in Delhi.


Interested in a career in Data Analyst?

To learn more about Machine Learning Using Python and Spark – click here.

To learn more about Data Analyst with Advanced excel course – click here.
To learn more about Data Analyst with SAS Course – click here.
To learn more about Data Analyst with R Course – click here.
To learn more about Big Data Course – click here.

How American Express Uses Data Analytics to Promote a Data-Driven Culture

data analytics training institute

Since 2010, American Express, with an encompassing database crossing over 100 million credit cards accounting for more than $ 1 trillion in charge volume annually, is harnessing the power of big data. Undeniably, it resulted in incredible improvements in speed and performance.

In the last four decades, the entire financial services industry has undergone a massive change, notably in the spheres of:

Electronic payments – Online payments, comprising credit and debit cards have dramatically increased over cash, globally.

E-commerce – An excessive reliance on smartphones and internet have boosted E-commerce capabilities manifold times.

With an increasing interaction between company and customers, the latter’s online and offline identity is being collaborated for an encompassing 360-degree view. This eventually drives innovation in product designing and marketing.

Formulating a Data-Driven Culture

Data analytics is like the bull’s eye of effective marketing, and servicing and risk management. Data curation and management is now a prerequisite for competitive excellence.

Since its inception, American Express flaunts transformation: the company has transformed itself from being a trivial freight forwarding business to a top notch player in payments and customized service industry. Over the years, the working mechanism of the firm has changed dramatically, and today, it is #1 small business card issuer in the whole of the US.

No matter, while the company strives to evolve, its core values remain somewhat same. Keeping their customers above anything else and behave like a good citizen are two core values of American Express that are beyond alterations. To become a successful data-driven organization, they believe in investing on technology, analytics, along with human talent, emphasizing on a proper synthesis between technology and human cognition to trigger robust growth and future success.

How American Express Stays Relevant and Fresh?

Risk 2020 – American Express envisions how an economy or marketplace might look like after a few years, and in the process, assesses the risks to combat to address the weaker issues in the economy. A comprehensive approach, including cloud, deep learning, mobile computing and AI is the solution.

Cornerstone – This is an encompassing, global big data ecosystem. The data is stored and shared with global potentialities across trusted sources. In any organization, data is the centre of attraction, and the consultants at American Express recognize the essence of innovation lies at company’s DNA and not somewhere on the top.

The data-driven culture in American Express is simple, natural and nuanced. A huge data base is created, from acquisition to customer management, which eventually needs to be shared with third parties and partners to derive insightful conclusions for better customer experience and risk assessment. “At American Express, we take our responsibility to serve customers and the public seriously, always ensuring that solutions are best-in-class and valuable to our customers,” says Ash Gupta, president, Global Credit Risk & Information Management, American Express.

“American Express’ closed-loop data allows us to analyze a large volume of real spending that can help marketers across a range of industries connect with customers and provide unique value,” he further adds.

Data Science Machine Learning Certification

To know more about data-driven customer experience, visit DexLab Analytics, a premier data analyst training institute in Delhi. They offer a plethora of data analyst training courses for interested candidates.


The blog has been sourced from:

https://www.forbes.com/sites/ciocentral/2018/03/15/how-american-express-excels-as-a-data-driven-culture/#5c5ed1a81635

https://digit.hbs.org/submission/american-express-using-data-analytics-to-redefine-traditional-banking/


Interested in a career in Data Analyst?

To learn more about Data Analyst with Advanced excel course – Enrol Now.
To learn more about Data Analyst with R Course – Enrol Now.
To learn more about Big Data Course – Enrol Now.

To learn more about Machine Learning Using Python and Spark – Enrol Now.
To learn more about Data Analyst with SAS Course – Enrol Now.
To learn more about Data Analyst with Apache Spark Course – Enrol Now.
To learn more about Data Analyst with Market Risk Analytics and Modelling Course – Enrol Now.

How Credit Unions Can Capitalize on Data through Enterprise Integration of Data Analytics

credit risk analysis

To get valuable insights from the enormous quantity of data generated, credit unions need to move towards enterprise integration of data. This is a company-wide data democratization process that helps all departments within the credit union to manage and analyze their data. It allows each team member easy-access and proper utilization of relevant data.

However, awareness about the advantages of enterprise-wide data analytics isn’t sufficient for credit unions to deploy this system. Here is a three step guide to help credit unions get smarter in data handling.

Improve the quality of data

A robust and functional customer data set is of foremost importance. Unorganized data will hinder forming correct opinions about customer behavior. The following steps will ensure that relevant data enters the business analytics tools.

  • Integration of various analytics activity- Instead of operating separate analytics software for digital marketing, credit risk analytics, fraud detection and other financial activities, it is better to have a centralized system which integrates these activities. It is helpful for gathering cross-operational cognizance.
  • Experienced analytics vendors should be chosen- Vendors with experience can access a wide range of data. Hence, they can deliver information that is more valuable. They also provide pre-existing integrations.
  • Consider unconventional sources of data- Unstructured data from unconventional sources like social media and third-parties should be valued as it will prove useful in the future.
  • Continuous data cleansing that evolves with time- Clean data is essential for providing correct data. The data should be organized, error-free and formatted.

Data structure customized for credit unions

The business analytics tools for credit unions should perform the following analyses:

  • Analyzing the growth and fall in customers depending on their age, location, branch, products used, etc.
  • Measure the profit through the count of balances
  • Analyze the Performances of the staffs and members in a particular department or branch
  • Sales ratios reporting
  • Age distribution of account holders in a particular geographic location.
  • Perform trend analysis as and when required
  • Analyze satisfaction levels of members
  • Keep track of the transactions performed by members
  • Track the inquires made at call centers and online banking portals
  • Analyze the behavior of self-serve vs. non-self serve users based on different demographics
  • Determine the different types of accounts being opened and figure out the source responsible for the highest transactions.

User-friendly interfaces for manipulating data

Important decisions like growing revenue, mitigating risks and improving customer experience should be based on insights drawn using analytics tools. Hence, accessing the data should be a simple process. These following user-interface features will help make data user-friendly.

Dashboards- Dashboards makes data comprehensible even for non-techies as it makes data visually-pleasing. It provides at-a glance view of the key metrics, like lead generation rates and profitability sliced using demographics. Different datasets can be viewed in one place.

Scorecards- A scorecard is a type of report that compares a person’s performance against his goals. It measures success based on Key Performance Indicators (KPIs) and aids in keeping members accountable.

Automated reports- Primary stakeholders should be provided automated reports via mails on a daily basis so that they have access to all the relevant information.

Data analytics should encompass all departments of a credit union. This will help drawing better insights and improve KPI tracking. Thus, the overall performance of the credit union will become better and more efficient with time.

Technologies that help organizations draw valuable insights from their data are becoming very popular. To know more about these technologies follow Dexlab Analytics- a premier institute providing business analyst training courses in Gurgaon and do take a look at their credit risk modeling training course.

Interested in a career in Data Analyst?

To learn more about Machine Learning Using Python and Spark – click here.
To learn more about Data Analyst with Advanced excel course – click here.
To learn more about Data Analyst with SAS Course – click here.
To learn more about Data Analyst with R Course – click here.
To learn more about Big Data Course – click here.

How Big Data Plays the Key Role in Promoting Cyber Security

The number of data breaches and cyber attacks is increasing by the hour. Understandably, investing in cyber security has become the business priority for most organizations. Reports based on a global survey of 641 IT and cyber security professionals reveal that a whopping 69% of organizations have resolved to increase spending on cyber security. The large and varied data sets, i.e., the BIG DATA, generated by all organizations small or big, are boosting cyber security in significant ways.

How Big Data Plays the Key Role in Promoting Cyber Security

Business data one of the most valuable assets of a company and entrepreneurs are becoming increasingly aware of the importance of this data in their success in the current market economy. In fact, big data plays the central role in employee activity monitoring and intrusion detection, and thereby combats a plethora of cyber threats.

Let’s Take Your Data Dreams to the Next Level

  1. EMPLOYEE ACTIVITY MONITERING:

Using an employee system monitoring program that relies on big data analytics can help a company’s human resource division keep a track on the behavioral patterns of their employees and thereby prevent potential employee-related breaches. Following steps may be taken to ensure the same:

  • Restricting the access of information only to the staff that is authorized to access it.
  • Staffers should use theirlogins and other system applications to change data and view files that they are permitted to access. 
  • Every employee should be given different login details depending on the complexity of their business responsibilities.


  1. INTRUSION DETECTION:

A crucial measure in the big data security system would be the incorporation of IDS – Intrusion Detection System that helps in monitoring traffic in the divisions that are prone to malicious activities. IDS should be employed for all the pursuits that are mission-crucial, especially the ones that make active use of the internet. Big data analytics plays a pivotal role in making informed decisions about setting up an IDS system as it provides all the relevant information required for monitoring a company’s network.

The National Institute of Standards and Technology recommends continuous monitoring and real-time assessments through Big Data analytics. Also the application of predictive analytics in the domain of optimization and automation of the existing SIEM systems is highly recommended for identifying threat locations and leaked data identity.

  1. FUTURE OF CYBER SECURITY:

Security experts realize the necessity of bigger and better tools to combat cyber crimes. Building defenses that can withstand the increasingly sophisticated nature of cyber attacks is the need of the hour. Hence advances in big data analytics are more important than ever.

Relevance of Hadoop in big data analytics:

  • Hadoop provides a cost effective storage solution to businesses.
  • It facilitates businesses to easily access new data sources and draw valuable insights from different types of data.
  • It is a highly scalable storage platform.
  • The unique storage technique of Hadoop is based on a distributed file system that primarily maps the data when placed on a cluster. The tools for processing data are often on the same servers where the data is located. As a result data processing is much faster.
  • Hadoop is widely used across industries, including finance, media and entertainment, government, healthcare, information services, and retail.
  • Hadoop is fault-tolerant. Once information is sent to an individual node, that data is replicated in other nodes in the cluster. Hence in the event of a failure, there is another copy available for use.
  • Hadoop is more than just a faster and cheaper analytics tool. It is designed as a scale-out architecture that can affordably store all the data for later use by the company.


Developing economies are encouraging investment in big data analytics tools, infrastructure, and education to maintain growth and inspire innovation in areas such as mobile/cloud security, threat intelligence, and security analytics.

Thus big data analytics is definitely the way forward. If you dream of building a career in this much coveted field then be sure to invest in developing the relevant skill set. The Big Data training and Hadoop training imparted by skilled professionals at Dexlab Analytics in Gurgaon, Delhi is sure to give you the technical edge that you seek. So hurry and get yourself enrolled today!


Interested in a career in Data Analyst?

To learn more about Machine Learning Using Python and Spark – click here.

To learn more about Data Analyst with Advanced excel course – click here.
To learn more about Data Analyst with SAS Course – click here.
To learn more about Data Analyst with R Course – click here.
To learn more about Big Data Course – click here.

Data Analytics: The Key to Track and Curb Leakages in GST

Though our country may have got a One Nation, One Tax Policy, in the face of GST, its revenue collection figures are not so encouraging. In the beginning, GST revenue collection for the first three months went over 90000 crore, but the figures started dropping from October to 83346. And in November, it further slipped to 80808 crore. Since then, the figures mostly lingered around 86000 in the recent months.

 
Data Analytics: The Key to Track and Curb Leakages in GST
 

The Union Ministry of Finance had to figure out the reason of this discrepancy, the reason behind such huge revenue leakage in GST collection before it’s too late, and for that data analytics came to the rescue. After carrying out a thorough analysis, on its 26th meeting on Saturday, GST Council discovered several major data gaps between the self-declared liability in FORM GSTR-1 and FORM GSTR-3B.


Highlighting the outcome of basic data analysis, the GST Council stated that the GST Network (GSTN) and the Central Board of Excise and Customs have found some inconsistency between the amount of Integrated GST (IGST) and Compensation cess paid by importers at customs ports and input tax credit of the same claimed in GSTR-3B.


“Data analytics and better administration controls can help solve GST collection challenges” – said Pratik Jain, a national leader and partner, Indirect Tax at PricewaterhouseCoopers (PwC).


He added, “Government has a lot of data now. They can use the data analytics to find out what the problem areas are, and then try and resolve that.” He also said that to stop the leakage, the government need to be a lot more vigilant and practice better controls over the administration.


Moreover, of late a parliamentary committee has found that the monthly collection from GST is not up to the mark due to constant revisions of the rates, which has undoubtedly affected the stability of the tax structure and had led to an adverse impact for trade and business verticals.  


“The Committee is constrained to observe the not-so-encouraging monthly revenue collections from GST, which still have not stabilised with frequent changes in rates and issue of notifications every now and then. Further, the Committee is surprised to learn that no GST revenue targets have been fixed by the government,” said M Veerappa Moily, the head of Standing Committee on Finance and a veteran Congress leader in a recent report presented in the Parliament.


The original article appeared inanalyticsindiamag.com/government-using-data-analytics-to-track-leakages-in-gst/

To experience the full power of data analytics and the potentials it withholds, find a good data analyst training institute in Delhi NCR. A reliable data analytics training institute like DexLab Analytics can help you unearth the true potentials of a fascinating field of science – go get details now.


Interested in a career in Data Analyst?

To learn more about Machine Learning Using Python and Spark – click here.

To learn more about Data Analyst with Advanced excel course – click here.
To learn more about Data Analyst with SAS Course – click here.
To learn more about Data Analyst with R Course – click here.
To learn more about Big Data Course – click here.

How Data Analytics Is Shaping and Developing Improved Storage Solutions

Technology has penetrated deep into our lives – the last 5 decades of IT sector have been characterized by intense development in electronic storing solutions for recordkeeping.

 
How Data Analytics Is Shaping and Developing Improved Storage Solutions
 

Today, every file, every document is stored and archived safely and efficiently – rows of data are tabled in spreadsheets and stored in SQL relational databases for smooth access anytime by anyone, of course the authorized persons. Data is omnipresent. It is being found in data warehouses, data lakes, data mines and in pools. It is so much large in volume nowadays, that it can even be calculated in something like a Brontobyte.


Information is power. Data stored in archives are used to make accurate forecasts. And the data evaluation has begun within a subset of mathematics powered by a discipline named probability and statistical analysis.


Slowly, this discipline evolved into Business Intelligence that further into Data Science. The latter is the most sought after and well-paid career option for today’s tech-inspired generation. Grab a data science certification in Gurgaon and push your career to success.


Big Data Storage Challenges and Solutions

The responsibility of storage, ensuring security and provide accessibility for data is huge. Managing volumes and volumes of data is posing a challenge in itself – for example, even powering and cooling enough HDD RAID arrays to keep an Exabyte of raw data tends to break the bank for many companies.


Software-defined storage and flash devices are being deployed for big data storage. They promise of better direct business benefit. Also, increasingly Apache Spark Hadoop or simply Spark is taking care of the software side of big data analytics. Whether your big data cluster is developed on these open-source architectures or some other big data frameworks, it will for sure impact your storage decisions.


Hadoop is in this business of storage for big data for quite some time now. It is a robust open-source framework opted for suave processing of big data. It led to the emergence of server clusters and Facebook is known to have the largest Hadoop cluster containing millions of nodes.

 
google-ads-1-72890
 

Now, the question remains where and how you proceed with Hadoop – there are so many differing opinions about how you approach Hadoop clusters, at times it may leave you exasperated. For that, we can help you here.


With a huge array of data at play, we suggest to deploy a dedicated processing, storage and networking system in different racks to avoid latency or performance issues. It is for the same reasons, we ask you to stay away running Hadoop in a virtual environment.

Instead, implement HDFS (Hadoop Distributed File System) – it is perfect for distributed storage and processing with the help of commodity hardware. The structure is simple, tolerant, expandable and scalable.


Besides, the cost of data storage should also be given a look at – cost should be kept low and data compression features should likely to be implemented.

For Big Data Hadoop certification in Delhi NCR, drop by DexLab Analytics.

 
google-ads-1-250250

The Takeaway

Times are changing, and so are we. Big data analytics are becoming more real-time, hence better you scale up to real-time analytics. Today, data analytics have gone way beyond the conventional desktop considerations – it has now become a lot more, and to keep pace with the analytics evolution, you need to have sound storage infrastructure, where possible upgrades to computing, storage and networking is easily available and implementable.


To answer about big data or Hadoop, power yourself up with a good certification in Big Data Hadoop from DexLab Anlaytics – such intensive big data courses do help!


Interested in a career in Data Analyst?

To learn more about Machine Learning Using Python and Spark – click here.

To learn more about Data Analyst with Advanced excel course – click here.
To learn more about Data Analyst with SAS Course – click here.
To learn more about Data Analyst with R Course – click here.
To learn more about Big Data Course – click here.

Call us to know more