analytics training institute Archives - Page 5 of 5 - DexLab Analytics | Big Data Hadoop SAS R Analytics Predictive Modeling & Excel VBA

Microsoft Introduces FPGA Technology atop Google Chips through Project Brainwave

Microsoft Introduces FPGA Technology atop Google Chips through Project Brainwave

A Change Is In the Make – due to increasing competition among tech companies working on AI, several software makers are inventing their own new hardware. A few Google servers also include chips designed for machine learning, known as TPUs exclusively developed in-house to ensure higher power and better efficiency. Google rents them out to its cloud-computing consumers. Of late, Facebook too shared its interest in designing similar chips for its own data centers.

However, a big player in AI world, Microsoft is skeptical if the money spent is for good – it says the technology of machine learning is transforming so rapidly that it makes little sense to spend millions of dollars into developing silicon chips, which could soon become obsolete. Instead, Microsoft professionals are pitching for the idea of implementing AI-inspired projects, named FPGAs, which can be re-modified or reprogrammed to support latest forms of software developments in the technology domain.  The company is buying FPGAs from chip mogul, Intel, and already a few companies have started buying this very idea of Microsoft.

This week, Microsoft is back in action with the launch of a new cloud service for image-recognition projects, known as Project Brainwave. Powered by the very FPGA technology, it’s one of the first applications that Nestle health division is set to use to analyze the acuteness of acne, from images submitted by the patients. The specialty of Project Brainwave is the manner in which the images are processed – the process is quick as well as very low in cost than other graphic chip technologies used today.

It’s been said, customers using Project Brainwave are able to process a million images in just 1.8 milliseconds using a normal image recognition model for a mere 21 cents. Yes! You heard it right. Even the company claims that it performs better than it’s tailing rivals in cloud service, but unless the outsiders get a chance to test the new technology head-to-head against the other options, nothing concrete can be said about Microsoft’s technology. The biggest competitors of Microsoft in cloud-service platform include Google’s TPUs and graphic chips from Nvidia.

Let’s Take Your Data Dreams to the Next Level

At this stage, it’s also unclear how widely Brainwave is applicable in reality – FPGAs are yet to be used in cloud computing on a wide scale, hence most companies lack the expertise to program them. On the other hand, Nvidia is not sitting quietly while its contemporaries are break opening newer ideas in machine learning domain. The recent upgrades from the company lead us to a whole new world of specialized AI chips that would be more powerful than former graphic chips.

Latest reports also confirm that Google’s TPUs exhibited similar robust performance similar to Nvidia’s cutting edge chips for image recognition task, backed by cost benefits. The software running on TPUs is both faster and cheaper as compared to Nvidia chips.

In conclusion, companies are deploying machine learning technology in all areas of life, and the competition to invent better AI algorithms is likely to intensify manifold. In the coming days, several notable companies, big or small are expected to follow the footsteps of Microsoft.

For more machine learning related stories and feeds, follow DexLab Analytics. It is the best data analytics training institute in Gurgaon offering state of the art machine learning using python courses.

The article has been sourced from – https://www.wired.com/story/microsoft-charts-its-own-path-on-artificial-intelligence


Interested in a career in Data Analyst?

To learn more about Machine Learning Using Python and Spark – click here.

To learn more about Data Analyst with Advanced excel course – click here.
To learn more about Data Analyst with SAS Course – click here.
To learn more about Data Analyst with R Course – click here.
To learn more about Big Data Course – click here.

10 Key Areas to Focus When Settling For an Alternative Data Vendor

10 Key Areas to Focus When Settling For an Alternative Data Vendor

Unstructured data is the new talk of the town! More than 80% of the world’s data is in this form, and big wigs of financial world need to confront the challenges of administering such volumes of unstructured data through in-house data consultants.

FYI, deriving insights from unstructured data is an extremely tiresome and expensive process. Most buy-sides don’t have access to these types of data, hence big data vendors are the only resort. They are the ones who transform unstructured content into tradable market data.

Here, we’ve narrowed down 10 key areas to focus while seeking an alternative data vendor.

Structured data

Banks and hedge funds should seek alternative data vendors that can efficiently process unstructured data into 100% machine readable structured format – irrespective of data form.

Derive a fuller history

Most of the alternative data providers are new kid in the block, thus have no formidable base of storing data. This makes accurate back-testing difficult.

Data debacles

The science of alternative data is punctured with a lot of loopholes. Sometimes, the vendor fails to store data at the time of generation – and that becomes an issue. Transparency is very crucial to deal with data integrity issues so as to nudge consumers to come at informed conclusions about which part of data to use and not to use.

Context is crucial

While you look at unstructured content, like text, the NLP or natural language processing engine must be used to decode financial terminologies. As a result, vendors should create their own dictionary for industry related definitions.

Version control

Each day, technology gets better or the production processes change; hence vendors must practice version control on their processes. Otherwise, future results will be surely different from back-testing performance.

Let’s Take Your Data Dreams to the Next Level

Point-in-time sensitivity

This generally means that your analysis includes data that is downright relevant and available at particular periods of time. In other cases, there exists a higher chance for advance bias being added in your results.

Relate data to tradable securities

Most of the alternative data don’t include financial securities in its scope. The users need to figure out how to relate this information with a tradable security, such as bonds and stocks.

Innovative and competitive

AI and alternative data analytics are dramatically changing. A lot of competition between companies urges them to stay up-to-date and innovative. In order to do so, some data vendors have pooled in a dedicated team of data scientists.

Data has to be legal

It’s very important for both vendors and clients to know from where data is coming, and what exactly is its source to ensure it don’t violate any laws.

Research matters

Few vendors have very less or no research establishing the value of their data. In consequence, the vendor ends up burdening the customer to carry out early stage research from their part.

In a nutshell, alternative data in finance refer to data sets that are obtained to inject insight into the investment process. Most hedge fund managers and deft investment professionals employ these data to derive timely insights fueling investment opportunities.

Big data is a major chunk of alternative data sets. Now, if you want to arm yourself with a good big data hadoop certification in Gurgaon then walk into DexLab Analytics. They are the best analytics training institute in India.

The article has been sourced from – http://dataconomy.com/2018/03/ten-tips-for-avoiding-an-alternative-data-hangover


Interested in a career in Data Analyst?

To learn more about Machine Learning Using Python and Spark – click here.

To learn more about Data Analyst with Advanced excel course – click here.
To learn more about Data Analyst with SAS Course – click here.
To learn more about Data Analyst with R Course – click here.
To learn more about Big Data Course – click here.
5 Steps to Reassess Your Big Data Business Strategy

5 Steps to Reassess Your Big Data Business Strategy

Company employees at all levels need to understand the role of big data in planning business strategies. Strategic planning has to be dynamic- constantly revised and aligned with the current market trends.

As the first quarter of 2018 is nearing to its end, here are 5 domains every business needs to pay attention to:-

  • Information retention for field-based technology:

In the current tech-driven business world, a lot of information needs to be collected from field-based technologies, like drones and sensors. Owing to internet bandwidth constraints, this data has to be stored locally instead of transmitting them for collection in a central location. Bandwidth constraints affect cloud-based storage systems too. Thus, companies need to restore traditional practices of distributed data storage, which involve collecting data locally and storing them on servers or disks.

2

  • Collaboration with cloud vendors:

Cloud hosting is popular among businesses, especially in small and midsized enterprises. Onsite data activities of companies include maintenance of infrastructure and networks that ensure internal IT access. With the shift towards cloud-based applications, businesses need to revise disaster recovery plans for all kinds of data. It should be ensured that vendors adhere to corporate governance standards, implement failover if needed, and SLAs (Service Level Agreements) match business needs. It is often seen that IT strategic plans lack strong objectives pertaining to vendor management and stipulated IT service levels.

  • How a company defines ROI:

In the constantly evolving business scenario, it is necessary to periodically re-evaluate the ROI (return on investments) for a technology that was set at the time of purchasing it. Chief information officers (CIOs) should regularly evaluate ROIs of technological investments and adjust business course accordingly. ROI evaluation should be a part of IT strategic planning and needs to be revisited at least once a year. An example of changing business value that calls for ROI re-assessment is the use of IoT technology in tracking foot traffic in physical retail stores. At a point of time, this technology helped managers display the most desirable products in best positions within a store. With the shift of customer base from physical to online venues, this tech has become redundant in terms of physical merchandising.

  • How business performance is assessed:

Like shifting ROIs, KPIs (key performance indicators) for companies that are based on inferences drawn from their data, are expected to change over time. Hence, monitoring these shifting KPIs should be a part of a company’s IT strategic plan. For example, customer engagements for a business might shift from social media promotions to increased mentions of product defects. Therefore, to improve customer satisfaction, businesses should consider reducing the number of remanufacture material authorizations and IoT alerts for sensors/devices in the production processes of these goods.

  • Adoption of AI and ML:

Artificial intelligence and machine learning play major roles in the current technological overhaul. Companies need to efficiently incorporate AI-powered and ML-based technologies in their business processes. Business leaders play key roles in identifying areas of a business where these techs could add value; and then testing their effectiveness through small-scale preliminary projects. This should be an important goal in the R&D strategic planning of business houses.

Let’s Take Your Data Dreams to the Next Level

As mentioned in Harvard Business review, ‘’the problem is that, in many cases, big data is not used well. Companies are better at collecting data-about their customers, about their products, about competitors-than analyzing the data and designing strategy around it.’’

‘’Used well’’ means not only designing superior strategies but also evolving these strategies with changing market trends.

From IT to marketing- professionals in every sector are going for big data training courses to enhance their competence. Enroll for the big data Hadoop certification course in Gurgaon at DexLab Analytics– a premier data analyst training institute in Delhi.


Interested in a career in Data Analyst?

To learn more about Machine Learning Using Python and Spark – click here.

To learn more about Data Analyst with Advanced excel course – click here.
To learn more about Data Analyst with SAS Course – click here.
To learn more about Data Analyst with R Course – click here.
To learn more about Big Data Course – click here.
Predictive Analytics: What It is and Why It’s Important for Businesses

Predictive Analytics: What It is and Why It’s Important for Businesses

Did you know that 2.5 quintillion bytes of data are generated on a daily basis? Big data is a valuable asset for companies provided that this data can be utilized to improve their performance. Companies employ predictive analytics to uncover hidden patterns in data and develop quick and efficient strategies that will steer their businesses forward.

IMB Watson is a popular predictive analytics processor that employs natural language processing technology to analyze human speech. IBM Watson can analyze a vast amount of data, often in a fraction of a second, to answer human-framed questions.

What is predictive analytics?

Predictive analytics use a combination of statistical modeling and machine learning techniques to determine the likelihood of future events based on historical data, which can come from structured, unstructured and semi-structured sources. A good example of the use of predictive analytics is the preparation of a credit report of a customer by a financial institution.

large

Credit Score:

Financial lenders use predictive analytics to scrutinize relevant data of an individual who has applied for a loan, including data pertaining to the individual’s current assets and debts, his/her employment and history of paying off loans. All this data is analyzed and boiled down to a single value known as credit score. This value represents the lending risk and helps the lender determine a customer’s creditworthiness. The higher the credit score, the more confident is the lender that the customer will fulfill his/her credit obligation.

predictive_analytics_and_cross-selling-01_1

Predictive analytics help lenders make quick and efficient decisions, such as accepting or rejecting a customer and increasing or decreasing their loan value. Credit risk modeling training has become extremely important across many sectors, including banking, insurance and retail.

Importance of predictive analytics:

Thanks to the plethora or new age analytics tools and software, predictive analytics make it easier for organizations to plan the future and gain competitive advantage.

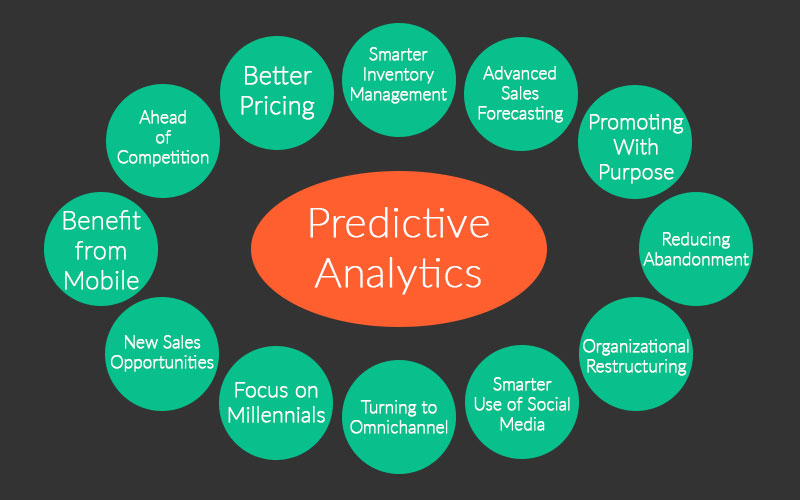
Below are some ways in which predictive analytics are used:

  • To predict the probability of certain diseases affecting a specific group of people so that the necessary preventive healthcare measures can be taken.
  • To predict the probability of certain machine parts failing so that preventive maintenance can be administered.
  • To predict the probability of an interruption in a business’s supply chain.
  • To predict customer behavior.
  • To predict safety risks on railroads.
  • To predict traffic flows and the infrastructure requirements of a city.

3-3infographic-pa-12345

How businesses use predictive analytics:

It is imperative for every company to include predictive analytics in their technology portfolio. The major vendors of predictive analytics include SAP, IBM, Oracle, SAS, Information Builders, etc. Their on-premise and cloud-based versions give companies a lot of options to choose their predictive analytics tools from.

On-premise predictive analytics systems are used by companies requiring high level of analytical power and predictive intelligence. These include companies in the drug and pharmaceutical sector; companies working on life science fields like genomics; and research institutes and universities.

Cloud-based versions provide predictive analytics solutions to companies on a per usage or subscription basis. These are highly beneficial for small and medium sized companies where predictive analytics aren’t the core component, but they are still critical for their success and need to be fitted in a stipulated IT budget. Companies can use the ‘’try and buy’’ facility provided by cloud-vendors to test if a particular software is working for them before finalizing a contract.

Companies that lack prior experience in predictive analytics can opt for SaaS (Software as a Service), which are cloud-based solutions with expertise in a specific sector, for example healthcare.

Role of Business Leaders:

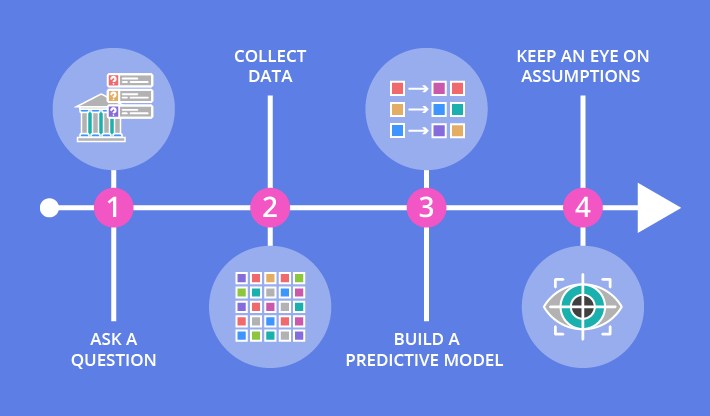
Business leaders must be skilled in using the insights provided by predictive analytics to develop strategies that drive their businesses forward. This includes two things; firstly coming up with well-construed questions and secondly identifying the right kind of data to analyze. These will determine whether predictive analytics is working for a company or not.

Companies in all industry verticals are employing predictive analytics to formulate future strategies. As mentioned in a report- ‘’the global market for predictive analytics is projected to grow to $3.6 billion USD by 2020.”

To more about predictive analytics follow Dexlab Analytics– a premier analytics training institute in Gurgaon. Do take a look at their credit risk modeling courses.


Interested in a career in Data Analyst?

To learn more about Machine Learning Using Python and Spark – click here.

To learn more about Data Analyst with Advanced excel course – click here.
To learn more about Data Analyst with SAS Course – click here.
To learn more about Data Analyst with R Course – click here.
To learn more about Big Data Course – click here.

Role of Self Service Analytics in Businesses

Role of Self Service Analytics in Businesses

Self Service Analytics is proving useful for business users, who are working on business data without necessarily having a background in technology and statistics. It is essentially bridging the gap between trained data analysts and normal business users.

Following are the characteristics of Self Service Analytics:

  1. Business Users Independence:

Self Service Analytics reduces dependency on IT and Data warehousing teams, thereby reducing the turnaround time for a request made by a business user.

It does so by continuously collating and loading real time data into a singular stream without disparity, which is easily accessible through browsers. Thus, it helps business users in taking decisions on Real-Time basis.

This feature benefits organizations because vital decisions made within time can be more profitable as compared to the traditional way of analysing data, which may not be a good idea in respect to the urgency constraint.

2

  1. Easier and Reduced Cost of Operations:

Often, the company’s data are fragmented and widespread across various divisions. This increases the headache of channelling the data meaningfully and in a wholesome manner.

Further to this, preparing reports using this data becomes a cumbersome job for the IT department or the department, which is serving such request. Hence, it may lead to increased cost of time or decreased quality of efficiency at which the operations have to run. However, many a times, these reports fail to give an overview of the operations in an organisation.

Self-service BI integrates data from different systems and delivers a “Single Version of Truth”. Accessing this data and running computations on it requires only a browser for access and eliminates the need to install, maintain and administer large-footprint software clients on each user’s workstation.

If Self Service Analytics is hosted on SaaS, it will further reduce the cost of machinery and maintenance associated with it. The provision for usage can be increased or decreased in no time according to the usage pattern. This really means that Self Service Analytics helps you adapt with time and Pay-Per-Use model, which is a leading trend in most of the industries.

  1. Resolving the conflict over accuracy:

Typically, a business user using Excel would have a local copy of data and run computations on it. He can merge and transform it by using various formulas and finally derive a conclusion.

This is dangerous because in live operations, data keeps changing and data integrity is at stake by working on local copies. Thus, accuracy in decision-making becomes a game of luck.

In Self Service BI, the data from the source is extracted, transformed and loaded into a unique data model, which goes with all operations. In this case, data integrity is assured. In addition, all business users have the same source of data, removing the risk that working with different local copies have.

Therefore, from the above stated facts, we can conclude that Self Service Analytics is a need for today’s businesses.

However, there are a few risks involved in Self Service Business Analytics:

  1. Loose corporate governance and make data available to business users directly may be taken advantage of in an undue manner.
  2. Business users may not be properly trained or skilled to make decisions.
  3. Relying heavily on any tool without some real life experience and insight into the background of that data can result into an impaired decision-making.

If all the above-mentioned risks are mitigated and proper corporate governance structure is in place, Self Service Analytics can be very beneficial for the success of any organization.

To excel in Self-Service Analytics, why not take up Machine Learning courses in Delhi from DexLab Analytics! They are informative, interesting and elaborate.


Interested in a career in Data Analyst?

To learn more about Data Analyst with Advanced excel course – Enrol Now.
To learn more about Data Analyst with R Course – Enrol Now.
To learn more about Big Data Course – Enrol Now.

To learn more about Machine Learning Using Python and Spark – Enrol Now.
To learn more about Data Analyst with SAS Course – Enrol Now.
To learn more about Data Analyst with Apache Spark Course – Enrol Now.
To learn more about Data Analyst with Market Risk Analytics and Modelling Course – Enrol Now.

5 Analytics Tools To Improve Your Business Decisions

5 Analytics Tools To Improve Your Business Decisions

Big Data has proved to be inevitable for business organisations in the quest for stepping ahead of their competitors. Nevertheless, only having Big Data at hand does not solve problems. You also need the availability of efficient analytics software that can put your data to the best use.

A business analytics tool is responsible for analysing massive amounts of data in order to extract valuable information. Such information in turn, can be used for improving operational efficiency and for taking better decisions.

2

So, let us here go through the top 10 data analytics tools available in the market.

  • Yellowfin BI

Yellowfin Business Intelligence (BI) is a reporting, dashboard and data analysis software. The software is able to conduct analysis of huge amounts of database, in order to figure out appropriate information. With Yellowfin, your dashboard can be easily accessible from everywhere including company intranet, mobile device or web page.

  • Business Intelligence & Reporting Tools (BIRT)

BIRT is open source software programmed for JAVA and JAVA EE platforms. It consists of a runtime component and a visual report designer, which can be used for creating reports, visual data, and charts and so on. Information gathered from this software can be used for tracking historical data and analysing it and as well as for monitoring ongoing developments in various fields. BIRT can also be used for real-time decision-making purposes.

  • Clear Analytics

Clear Analytics is quite easy to manage as the software is based on Excel spreadsheets. While the software allows you to continue managing data using Excel, it also adds some extra features like reports scheduling, administrative capabilities, version control, governance etc. for better decision making. In short, Clear Analytics can be your choice in case you want high-end performance in exchange of minimal effort.

  • Tableau

Tableau is BI software that provides insight into the data that a business organisation requires for connecting the dots, in order to make clear and effective decisions. Data visualisation in Tableau is much dynamic and elaborative as compared to the other programmes available. Besides, it also provides easier access to data given its extended mobile device support. Additionally, the costs of implementing this program as well as its upgrade are relatively low.

  • GoodData

GoodData is a service BI platform. It takes into account both internal and external datasets (cloud) of an organisation to analyse and provide better governance. The platform is programmed for managing data security and governance thereby, consequently providing the user with the desired results. The most important feature of this platform is that it can analyse datasets of any size, thus making it effective for its users. Recently, the company rebranded their software as an Open Analytics platform.

These are some of the major analytics tools used by organisations irrespective of their scale in order to enhance their business intelligence. Whether you are looking to enhance your career or take better business decisions, a Data analyst certification course can help you to achieve such objectives. Data Analysis helps you to track the competitive landscape and figure out the essentials that needs to be done, in order to get ahead of your competitors. If you are a manager, you can take precise decisions based on quantitative data. Since big data is potential of driving your success, it is your job to master the science and use it for your advantage.


Interested in a career in Data Analyst?

To learn more about Data Analyst with Advanced excel course – Enrol Now.
To learn more about Data Analyst with R Course – Enrol Now.
To learn more about Big Data Course – Enrol Now.

To learn more about Machine Learning Using Python and Spark – Enrol Now.
To learn more about Data Analyst with SAS Course – Enrol Now.
To learn more about Data Analyst with Apache Spark Course – Enrol Now.
To learn more about Data Analyst with Market Risk Analytics and Modelling Course – Enrol Now.

The Best Analytics Tools for Business And How to Make The Most of Them

The Best Analytics Tools for Business And How to Make The Most of Them

All companies are awash with useable data about their customers, prospects and internal business operations as well as suppliers and partners. But most of them are also ill-equipped with the requisite understanding to leverage this streaming flood of data and cannot convert it to actionable insights to increase their revenue by growing their revenue thus, increasing their efficiency. Business intelligence tools are technology that allows businesses to transform their data into actions for generating better business.

The Business Intelligence and analytics industry has been around for decades now and is considered by most analytics personnel as a mature industry. But this BI market is never static with constant evolution and innovation to prepare for meeting the ever expanding needs of businesses of all sizes and from a diverse range of industries. So, it is imperative that people gather an understanding of the different Business Analytics tools for better operation of their companies.

2

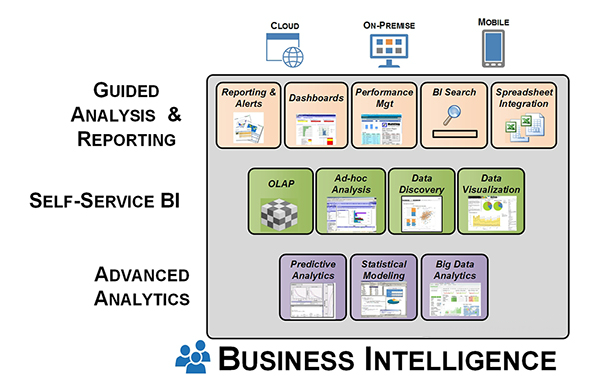
Business Intelligence tools can be categorised in three different groups:

  • Guided analysis and reporting
  • Self-service Business Intelligence and Analysis
  • Advanced Analytics

The first category of guided analysis and reporting includes Business Intelligence tools of traditional styles that have long been used for years to perform recurrent data analyses of specified data groups. This system of data analysis was only used for predefined static reporting several years ago, but today it is possible for data analysts to select, compare, visualize and analyse data using various tools and features.

Tool styles in this category include the following:

  • Reports
  • Scorecards and dashboards
  • Spreadsheet integration
  • BI Search
  • Corporate Performance Management

The second category of BI tools which falls under the category of self-service BI and analysis includes the tools BI users utilize to make ad hoc analysis of data. Such analytical practices may be a one-time analysis or building of a recurring analytical system that may with shared by others.

Usually the users of such Bi tools have a dual role to play – consumer of information and producer of analytical systems. They usually share or publish their BI application which they build with the self-service BI tool. The users of such tools will always have the term analyst in their job title. Staff members of the management department may also make use of such tools when they need to perform similar tasks as that of a business analyst, for their peers even if their job title does not imply that.

The Business Intelligence tools include in this category includes the following:

  • Ad hoc analyses and reporting
  • OLAP cubes i.e. online analytical processing
  • Data visualization
  • Data discovery

The third category of advanced analytics includes the tools that a data scientist uses to build predictive and prescriptive models of analysis. These are tools for predictive modelling, statistical modelling and data mining along with rigorous use of big data analytics software. In these cases data analyst spend a huge chunk of their time performing tasks like data ingestion, cleansing and integration.

To understand the full spectrum of different Business Intelligence tool classes here is a visual explanation:

dexlab

Who should invest in BI tools?

For a long time now investment and use of BI tools has been growing gradually regardless of the economic conditions. And it has especially accelerated in the recent times as companies crave for data for better growth and more organized operations. While data analytics tools were mainly associated with large enterprises due to their cost, complexity and demand of high skilled personnel, but those factors have now been grossly transformed as more and more SMBs (small and medium sized businesses) now being significant customers of BI tools and software.

Now that you have a good understanding of the different tool categories and how they should be deployed, the next step for you is to understand your  company specific needs and make the best use of these tools that are optimized for so.


Interested in a career in Data Analyst?

To learn more about Data Analyst with Advanced excel course – Enrol Now.
To learn more about Data Analyst with R Course – Enrol Now.
To learn more about Big Data Course – Enrol Now.

To learn more about Machine Learning Using Python and Spark – Enrol Now.
To learn more about Data Analyst with SAS Course – Enrol Now.
To learn more about Data Analyst with Apache Spark Course – Enrol Now.
To learn more about Data Analyst with Market Risk Analytics and Modelling Course – Enrol Now.

Data analysis resources to keep you updated

Data analysis resources to keep you updated

One should always be proactive about building upon what they already know and have learnt, and with explosion of the web such resources can be obtained fairly easily. The problem is not the availability of resources but the abundance from it. Due to the availability of too many choices it often becomes difficult to gauge if the sources are actually authentic.

2

So, here is a list of books, websites and other resources which we think are authentic:

To stay on top of the latest trends and analyses reports and what’s new in the realm of analytics here are the best latest blogs:

  • FiveThirtyEight: the main man behind this blog is Nate Silver, a data whiz kid, this blog is the place to find out data analysis and visualizations of political, economic and cultural issues. The content in his blogs are usually light-hearted and interactive yet pointed with illustrative examples of data can be used in day-to-day activities.
  • Flowing Data: this is an interesting blog where Dr. Nathan Yau, PhD reveals how the data personnel – like designers, analysts, scientists and statisticians can analyze and visualize data to gather a better understanding of the world around us. It is especially fun to read as Yau offers a funny approach about the regular challenges faced by a data professional in this field. One can also find job recommendations, tutorials and other resources in this blog.
  • Simply statistics: this is another blog that is managed by expert professors each from Ivy League colleges like Johns Hopkins University, Harvard University and the Dana Ferber Cancer Institute. These professors also talk about how data is being used or misused around the world in different industries.
  • Hunch: this blog has been created by John Langford from Microsoft Research, he is the doctor of learning there and his blog talks about machine learning basics of what we know and how we use what we know. This is a good read for those who are new in the field of machine learning and do not yet know how things work in machine learning as it provides an in-depth view of new ideas and events going on in this industry.

To connect to other fellow data scientists and analysts to inquire about questions that may arise while you try the tread the treacherous roads of the data world, these are few communities of data analysts you can follow.

    1. Kaggle competitions: this is a popular community that all data scientists are likely to come across. This is a platform where one can find data prediction competitors. This is a platform where one can search for upcoming competitions in data analysis the website also features a forum where a visitor can ask any question or find a partner for the competition, share resources and ask for support to make a good career in data science.
    2. Metaoptimize: this is a question and answer community for people who are into machine learning, natural language processing, data mining and more. Badges are awarded as per votes on questions are awarded. Thus, making it becomes simpler for the visitors to discover the most popular helpful answers to the questions.
    3. Datatau: this website is best described as hacker news for data scientists and it lives up to this description to the last word. People share career advice with each other; interesting articles are shared amongst the users and then commented upon also the people here share useful information to those new to the world of data analytics.
    4. DexLab Analytics blogs: while DexLab Analytics is one of the leading data analytics training institute in Gurgaon, but they maintain regular blogs about the latest developments in the field of data science and provide India-specific as well global data related news. For students pursuing or aspiring to pursue a career in data science must follow the daily posts from this institute.

In conclusion we would like to add that while there are several resources from where one can obtain valuable information about data analysis. Thus, keeping this list as a starting point you can find several other experts out there to help you learn more about data analytics.


Interested in a career in Data Analyst?

To learn more about Data Analyst with Advanced excel course – Enrol Now.
To learn more about Data Analyst with R Course – Enrol Now.
To learn more about Big Data Course – Enrol Now.

To learn more about Machine Learning Using Python and Spark – Enrol Now.
To learn more about Data Analyst with SAS Course – Enrol Now.
To learn more about Data Analyst with Apache Spark Course – Enrol Now.
To learn more about Data Analyst with Market Risk Analytics and Modelling Course – Enrol Now.

Call us to know more