analytics courses Archives - Page 10 of 11 - DexLab Analytics | Big Data Hadoop SAS R Analytics Predictive Modeling & Excel VBA

Business Intelligence: Now Every Person Can Use Data to Make Better Decisions

The fascinating world of Business Intelligence is expanding. The role of data scientists is evolving. The mysticism associated with data analytics is breaking off, making a way for non-technical background people to understand and dig deeper into the nuances and metrics of data science.
 
Business Intelligence: Now Every Person Can Use Data to Make Better Decisions
 

“Data democratization is about creating an environment where every person who can use data to make better decisions, has access to the data they need when they need it,” says Amir Orad, CEO of BI software company Sisense. Data is not to be limited only in the hands of data scientists, employees throughout the organization should have easy access to data, as and when required.

Continue reading “Business Intelligence: Now Every Person Can Use Data to Make Better Decisions”

Data Says This Game of Throne Character Carries the Maximum Weight

HBO’s fiery fantasy saga Game of Thrones Season 7 premiered last Sunday – by now the ardent stalwarts of this epic series have figured out the characters that matter the most. Just recently, a reputable data analytics firm Looker revealed some interesting facts, based on the data accumulated. So, want to know who secured the topmost rank?

 
Data Says This Game of Throne Character Carries the Maximum Weight
 

Head out for a Data analyst certification in Delhi. Dexlab Analytics is here.

Continue reading “Data Says This Game of Throne Character Carries the Maximum Weight”

Role of Self Service Analytics in Businesses

Role of Self Service Analytics in Businesses

Self Service Analytics is proving useful for business users, who are working on business data without necessarily having a background in technology and statistics. It is essentially bridging the gap between trained data analysts and normal business users.

Following are the characteristics of Self Service Analytics:

  1. Business Users Independence:

Self Service Analytics reduces dependency on IT and Data warehousing teams, thereby reducing the turnaround time for a request made by a business user.

It does so by continuously collating and loading real time data into a singular stream without disparity, which is easily accessible through browsers. Thus, it helps business users in taking decisions on Real-Time basis.

This feature benefits organizations because vital decisions made within time can be more profitable as compared to the traditional way of analysing data, which may not be a good idea in respect to the urgency constraint.

2

  1. Easier and Reduced Cost of Operations:

Often, the company’s data are fragmented and widespread across various divisions. This increases the headache of channelling the data meaningfully and in a wholesome manner.

Further to this, preparing reports using this data becomes a cumbersome job for the IT department or the department, which is serving such request. Hence, it may lead to increased cost of time or decreased quality of efficiency at which the operations have to run. However, many a times, these reports fail to give an overview of the operations in an organisation.

Self-service BI integrates data from different systems and delivers a “Single Version of Truth”. Accessing this data and running computations on it requires only a browser for access and eliminates the need to install, maintain and administer large-footprint software clients on each user’s workstation.

If Self Service Analytics is hosted on SaaS, it will further reduce the cost of machinery and maintenance associated with it. The provision for usage can be increased or decreased in no time according to the usage pattern. This really means that Self Service Analytics helps you adapt with time and Pay-Per-Use model, which is a leading trend in most of the industries.

  1. Resolving the conflict over accuracy:

Typically, a business user using Excel would have a local copy of data and run computations on it. He can merge and transform it by using various formulas and finally derive a conclusion.

This is dangerous because in live operations, data keeps changing and data integrity is at stake by working on local copies. Thus, accuracy in decision-making becomes a game of luck.

In Self Service BI, the data from the source is extracted, transformed and loaded into a unique data model, which goes with all operations. In this case, data integrity is assured. In addition, all business users have the same source of data, removing the risk that working with different local copies have.

Therefore, from the above stated facts, we can conclude that Self Service Analytics is a need for today’s businesses.

However, there are a few risks involved in Self Service Business Analytics:

  1. Loose corporate governance and make data available to business users directly may be taken advantage of in an undue manner.
  2. Business users may not be properly trained or skilled to make decisions.
  3. Relying heavily on any tool without some real life experience and insight into the background of that data can result into an impaired decision-making.

If all the above-mentioned risks are mitigated and proper corporate governance structure is in place, Self Service Analytics can be very beneficial for the success of any organization.

To excel in Self-Service Analytics, why not take up Machine Learning courses in Delhi from DexLab Analytics! They are informative, interesting and elaborate.


Interested in a career in Data Analyst?

To learn more about Data Analyst with Advanced excel course – Enrol Now.
To learn more about Data Analyst with R Course – Enrol Now.
To learn more about Big Data Course – Enrol Now.

To learn more about Machine Learning Using Python and Spark – Enrol Now.
To learn more about Data Analyst with SAS Course – Enrol Now.
To learn more about Data Analyst with Apache Spark Course – Enrol Now.
To learn more about Data Analyst with Market Risk Analytics and Modelling Course – Enrol Now.
Our Perception Must Include Data-Ception

Our Perception Must Include Data-Ception

Considering the complex competitive global environment, the world business today is witnessing a paradigm shift from mere data storage to data mining and other subsequent activities.

Thus, from a managerial perspective it is of prime importance to develop a psyche, which can interpret the collection of data. This psyche cannot be theoretically learnt from books, as it requires a knack to make data talk. Data is no more evaluated independently. Today, a cross-domain relationship between data exists, which on analysis depicts patterns, responsible enough to do wonders for the organization.

The question is how can we connect the dots? Following the recent trends, developers are grabbing every opportunity to break a huge chunk of data into meaningful relevant information. From the standpoint of technical professionals, along with an analytical mindset, they need to get hands on experience on the technological perspective to understand the real significance of data evaluation.

 Read Also : DexLab Analytics – Training the Future to be Big Data Analytics Fluent

The data not only aligns with the internal activity of the business but also is an integral part for consumer servicing. There is an intense need to study the needs of consumer and every decision he makes, which broadens the outlook of a business on how he/she is using their product. What are the expectations of the customer from an existing product? What more my customer needs? The answers to these questions cannot always be mapped quantitatively but a qualitative approach towards data is one of the key aspects of data analytics.

In this digital era, slightest technological ripples are going to reshuffle the whole industry scenario. And, that is why the omnipresence of data will aid businesses in setting new benchmarks in consumer and market findings. Growing pace of social media would open a Pandora’s Box for companies, who have their right audience in this particular domain.

The emergence of IOT, which primarily thrives on data, will cause disruption in the current business orientation. The data producing sensor architecture directly connected to the company can help the business to be fast and robust, which is the need of an hour. In addition, this analytics might influence mid-size distribution largely.

Simple example of this model: Sensors attached to tyres could sense data, and alert a tyre manufacturer about the usage of a consumer, which will help in servicing their customer at the right moment.

Thus, on an individualistic note there is need to develop a data analytical mindset and include data-ception in perception.

This blog has been contributed by Team Frontrunners, comprising members Ria Shah, Dishank Palan, Sanjay Sonwani from Welingkar College.


Interested in a career in Data Analyst?

To learn more about Data Analyst with Advanced excel course – Enrol Now.
To learn more about Data Analyst with R Course – Enrol Now.
To learn more about Big Data Course – Enrol Now.

To learn more about Machine Learning Using Python and Spark – Enrol Now.
To learn more about Data Analyst with SAS Course – Enrol Now.
To learn more about Data Analyst with Apache Spark Course – Enrol Now.
To learn more about Data Analyst with Market Risk Analytics and Modelling Course – Enrol Now.

5 Analytics Tools To Improve Your Business Decisions

5 Analytics Tools To Improve Your Business Decisions

Big Data has proved to be inevitable for business organisations in the quest for stepping ahead of their competitors. Nevertheless, only having Big Data at hand does not solve problems. You also need the availability of efficient analytics software that can put your data to the best use.

A business analytics tool is responsible for analysing massive amounts of data in order to extract valuable information. Such information in turn, can be used for improving operational efficiency and for taking better decisions.

2

So, let us here go through the top 10 data analytics tools available in the market.

  • Yellowfin BI

Yellowfin Business Intelligence (BI) is a reporting, dashboard and data analysis software. The software is able to conduct analysis of huge amounts of database, in order to figure out appropriate information. With Yellowfin, your dashboard can be easily accessible from everywhere including company intranet, mobile device or web page.

  • Business Intelligence & Reporting Tools (BIRT)

BIRT is open source software programmed for JAVA and JAVA EE platforms. It consists of a runtime component and a visual report designer, which can be used for creating reports, visual data, and charts and so on. Information gathered from this software can be used for tracking historical data and analysing it and as well as for monitoring ongoing developments in various fields. BIRT can also be used for real-time decision-making purposes.

  • Clear Analytics

Clear Analytics is quite easy to manage as the software is based on Excel spreadsheets. While the software allows you to continue managing data using Excel, it also adds some extra features like reports scheduling, administrative capabilities, version control, governance etc. for better decision making. In short, Clear Analytics can be your choice in case you want high-end performance in exchange of minimal effort.

  • Tableau

Tableau is BI software that provides insight into the data that a business organisation requires for connecting the dots, in order to make clear and effective decisions. Data visualisation in Tableau is much dynamic and elaborative as compared to the other programmes available. Besides, it also provides easier access to data given its extended mobile device support. Additionally, the costs of implementing this program as well as its upgrade are relatively low.

  • GoodData

GoodData is a service BI platform. It takes into account both internal and external datasets (cloud) of an organisation to analyse and provide better governance. The platform is programmed for managing data security and governance thereby, consequently providing the user with the desired results. The most important feature of this platform is that it can analyse datasets of any size, thus making it effective for its users. Recently, the company rebranded their software as an Open Analytics platform.

These are some of the major analytics tools used by organisations irrespective of their scale in order to enhance their business intelligence. Whether you are looking to enhance your career or take better business decisions, a Data analyst certification course can help you to achieve such objectives. Data Analysis helps you to track the competitive landscape and figure out the essentials that needs to be done, in order to get ahead of your competitors. If you are a manager, you can take precise decisions based on quantitative data. Since big data is potential of driving your success, it is your job to master the science and use it for your advantage.


Interested in a career in Data Analyst?

To learn more about Data Analyst with Advanced excel course – Enrol Now.
To learn more about Data Analyst with R Course – Enrol Now.
To learn more about Big Data Course – Enrol Now.

To learn more about Machine Learning Using Python and Spark – Enrol Now.
To learn more about Data Analyst with SAS Course – Enrol Now.
To learn more about Data Analyst with Apache Spark Course – Enrol Now.
To learn more about Data Analyst with Market Risk Analytics and Modelling Course – Enrol Now.

The Best Analytics Tools for Business And How to Make The Most of Them

The Best Analytics Tools for Business And How to Make The Most of Them

All companies are awash with useable data about their customers, prospects and internal business operations as well as suppliers and partners. But most of them are also ill-equipped with the requisite understanding to leverage this streaming flood of data and cannot convert it to actionable insights to increase their revenue by growing their revenue thus, increasing their efficiency. Business intelligence tools are technology that allows businesses to transform their data into actions for generating better business.

The Business Intelligence and analytics industry has been around for decades now and is considered by most analytics personnel as a mature industry. But this BI market is never static with constant evolution and innovation to prepare for meeting the ever expanding needs of businesses of all sizes and from a diverse range of industries. So, it is imperative that people gather an understanding of the different Business Analytics tools for better operation of their companies.

2

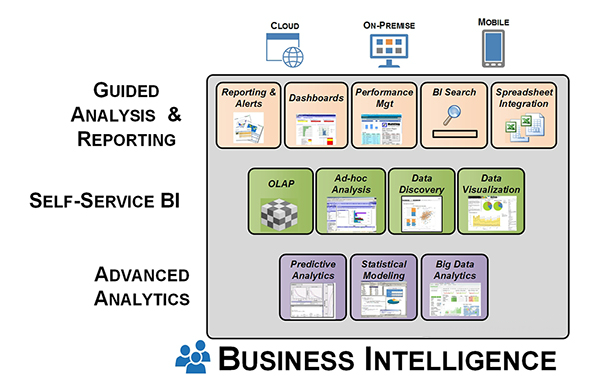
Business Intelligence tools can be categorised in three different groups:

  • Guided analysis and reporting
  • Self-service Business Intelligence and Analysis
  • Advanced Analytics

The first category of guided analysis and reporting includes Business Intelligence tools of traditional styles that have long been used for years to perform recurrent data analyses of specified data groups. This system of data analysis was only used for predefined static reporting several years ago, but today it is possible for data analysts to select, compare, visualize and analyse data using various tools and features.

Tool styles in this category include the following:

  • Reports
  • Scorecards and dashboards
  • Spreadsheet integration
  • BI Search
  • Corporate Performance Management

The second category of BI tools which falls under the category of self-service BI and analysis includes the tools BI users utilize to make ad hoc analysis of data. Such analytical practices may be a one-time analysis or building of a recurring analytical system that may with shared by others.

Usually the users of such Bi tools have a dual role to play – consumer of information and producer of analytical systems. They usually share or publish their BI application which they build with the self-service BI tool. The users of such tools will always have the term analyst in their job title. Staff members of the management department may also make use of such tools when they need to perform similar tasks as that of a business analyst, for their peers even if their job title does not imply that.

The Business Intelligence tools include in this category includes the following:

  • Ad hoc analyses and reporting
  • OLAP cubes i.e. online analytical processing
  • Data visualization
  • Data discovery

The third category of advanced analytics includes the tools that a data scientist uses to build predictive and prescriptive models of analysis. These are tools for predictive modelling, statistical modelling and data mining along with rigorous use of big data analytics software. In these cases data analyst spend a huge chunk of their time performing tasks like data ingestion, cleansing and integration.

To understand the full spectrum of different Business Intelligence tool classes here is a visual explanation:

dexlab

Who should invest in BI tools?

For a long time now investment and use of BI tools has been growing gradually regardless of the economic conditions. And it has especially accelerated in the recent times as companies crave for data for better growth and more organized operations. While data analytics tools were mainly associated with large enterprises due to their cost, complexity and demand of high skilled personnel, but those factors have now been grossly transformed as more and more SMBs (small and medium sized businesses) now being significant customers of BI tools and software.

Now that you have a good understanding of the different tool categories and how they should be deployed, the next step for you is to understand your  company specific needs and make the best use of these tools that are optimized for so.


Interested in a career in Data Analyst?

To learn more about Data Analyst with Advanced excel course – Enrol Now.
To learn more about Data Analyst with R Course – Enrol Now.
To learn more about Big Data Course – Enrol Now.

To learn more about Machine Learning Using Python and Spark – Enrol Now.
To learn more about Data Analyst with SAS Course – Enrol Now.
To learn more about Data Analyst with Apache Spark Course – Enrol Now.
To learn more about Data Analyst with Market Risk Analytics and Modelling Course – Enrol Now.
Big Data is the New Obsession of Small Business Owners

Big Data is the New Obsession of Small Business Owners

While this may seem somewhat counterintuitive, but instead of large organizations, it is actually small business owners and midsize companies who tend to be more inclined towards the applications of Big Data. They are also the first to adopt these latest technological innovations of which analytics is no exception – as these internet and data based insights are highly accessible and also affordable for SMBs.

As per the researchers in the fields of technology, the entry level capabilities in such fields like analytics has abruptly dropped which is why almost all types of industries from an array of sectors are engaging with them to enhance their competitiveness; and the wheels have already started to roll when it comes to increasing overall global competitiveness. Continue reading “Big Data is the New Obsession of Small Business Owners”

Are You a Student of Statistics? – You must know these 3 things

Are you a student of statistics?

We a premiere statistical and data analysis training institute offering courses on Big Data Hadoop, Business intelligence and Ai. We asked our faculty to tell us the three most important things that every student of elementary statistics should know.

So, let us get on with it:

  1. The notion that statistics is about numbers, is in the context only: statistics involves a rich treasure trove of numeric and graphical representation of displaying data to quantify them also it is very important to be capable of generating graphs along with numbers. But that is not the half part of statistics and the main interesting aspect is related to making the big leap from numbers and graphs to the realistic worldly interpretations. Uncannily statistics also poses to be a fascinating philosophical tension raising the question and healthy skepticism about we believe in and what we do not.
  2. The analysis part is not the most crucial part of a statistical study, the most important part lies with the when, where and how of gathering the data. We must not forget when we enter each number or data, calculate and plot the strategies we build on our understanding, but many a times at the time of interpretation that each every graph, data or number is a product of a fallible machine, be it organic or mechanical. If we are able to take proper care at the stage of sampling and observation we will be able to obtain great dividends at the final stage of interpretation and analysis of all our statistical efforts.
  3. All statistical functions off all kinds of mathematical sciences are based on a two-way communication system. This communication system should be between the statistician and non-statistician end. The main aim of statistical analysis is to put forward important social, public and scientific questions. A good statistician knows how to communicate with the public especially with those who are by and large not statisticians. Also the public here plays an important role and must possess simple idea of statistical conclusions to grasp what the statisticians have to say to them. This is an important criterion to be incorporated in the K-12 and college curriculum for elementary statistical students.

Data Science Machine Learning Certification

If you agree with our views and would like to discuss further on statistics and its application on data analysis then feel free drop by DexLab Analytics and stay updated on the latest trends in data management and mining.


Interested in a career in Data Analyst?

To learn more about Data Analyst with Advanced excel course – Enrol Now.
To learn more about Data Analyst with R Course – Enrol Now.
To learn more about Big Data Course – Enrol Now.

To learn more about Machine Learning Using Python and Spark – Enrol Now.
To learn more about Data Analyst with SAS Course – Enrol Now.
To learn more about Data Analyst with Apache Spark Course – Enrol Now.
To learn more about Data Analyst with Market Risk Analytics and Modelling Course – Enrol Now.
Decades On, SAS is Still the Market Leader

In the 2016 February report by Gartner, SAS bagged the top slot in its execution ability and was once again placed in the quadrant of leaders in the Magic Quadrant for Advanced Analytics Platforms.According to the description, as provided by Gartner, advanced analytics involves various sorts of data analysis through the use of quantitative methods of great sophistication like machine learning, statistics, simulation, data mining in its both predictive and descriptive forms as well as optimization.


Decades On , SAS Still The Leader


The goal is come up with insights that are unlikely to be discovered through approaching business intelligence traditionally like query and reporting.

Continue reading “Decades On, SAS is Still the Market Leader”

Call us to know more