analytics courses in delhi ncr Archives - Page 4 of 7 - DexLab Analytics | Big Data Hadoop SAS R Analytics Predictive Modeling & Excel VBA

Data Driven Projects: 3 Questions That You Need to Know

Data Driven Projects: 3 Questions That You Need to Know

Today, data is an asset. It’s a prized possession for companies – it helps derive crucial insights about customers, thus future business operations. It also boosts sales, predicts product development and optimizes delivery chains.

Nevertheless, several recent reports suggest that even though data floats around in abundance, a bulk of data-driven projects fail. In 2017 alone, Gartner highlighted 60% of big data projects fail – so what leads it? Why the availability of data still can’t ensure success of these projects?

2

Right data, do I have it?

It’s best to assume the data which you have is accurate. After all, organizations have been keeping data for years, and now it’s about time they start making sense out of it. The challenge that they come across is that this data might give crucial insights about past operations, but for present scenario, they might not be good enough.

To predict the future outcomes, you need fresh, real-time data. But do you know how to find it? This question leads us to the next sub-head.

Where to find relevant data?

Each and every company does have a database. In fact, many companies have built in data warehouses, which can be transformed into data lakes. With such vast data storehouses, finding data is no more a difficult task, or is it?

Gartner report shared, “Many of these companies have built these data lakes and stored a lot of data in them. But if you ask the companies how successful are you doing predictions on the data lake, you’re going to find lots and lots of struggle they’re having.”

Put simply, too many data storehouses may pose a challenge at times. The approach, ‘one destination for all data in the enterprise’ can be detrimental. Therefore, it’s necessary to look for data outside the data warehouses; third party sources can be helpful or even company’s partner network.

How to combine data together?

Siloed data can be calamitous. Unsurprisingly, data is available in all shapes and is derived from numerous sources – software applications, mobile phones, IoT sensors, social media platforms and lot more – compiling all the data sources and reconciling data to derive meaningful insights can thus be extremely difficult.

However, the problem isn’t about the lack of technology. A wide array of tools and software applications are available in the market that can speed up the process of data integration. The real challenge lies in understanding the crucial role of data integration. After all, funding an AI project is no big deal – but securing a budget to address the problem of data integration efficiently is a real challenge.

In a nutshell, however data sounds all promising, many organizations still don’t know how achieve full potential out of data analytics. They need to strengthen their data foundation, and make sure the data that is collected is accurate and pulled out from a relevant source.

A good data analyst course in Gurgaon can be of help! Several data analytics training institutes offer such in-demand skill training course, DexLab Analytics is one of them. For more information, visit their official site.

The blog has been sourced fromdataconomy.com/2018/10/three-questions-you-need-to-answer-to-succeed-in-data-driven-projects


Interested in a career in Data Analyst?

To learn more about Data Analyst with Advanced excel course – Enrol Now.
To learn more about Data Analyst with R Course – Enrol Now.
To learn more about Big Data Course – Enrol Now.

To learn more about Machine Learning Using Python and Spark – Enrol Now.
To learn more about Data Analyst with SAS Course – Enrol Now.
To learn more about Data Analyst with Apache Spark Course – Enrol Now.
To learn more about Data Analyst with Market Risk Analytics and Modelling Course – Enrol Now.

World’s Biggest Tech Companies 2018: A Comprehensive List

World’s Biggest Tech Companies 2018: A Comprehensive List

Talking of world’s biggest and most-valued companies, people instinctively turn their gaze to technology sector. Ever since the phenomenal dotcom boom and onset of WorldWideWeb, the tech firms have been garnering accolades owing to their huge market caps and power to disrupt conventional industries.

FYI: A public company’s market cap refers to market capitalization, which is a measurement of the value of its current outstanding shares. To calculate the market cap, you need to just multiply the current stock price with the outstanding number of shares. Talking about today’s market condition that would mean a lot of numbers.

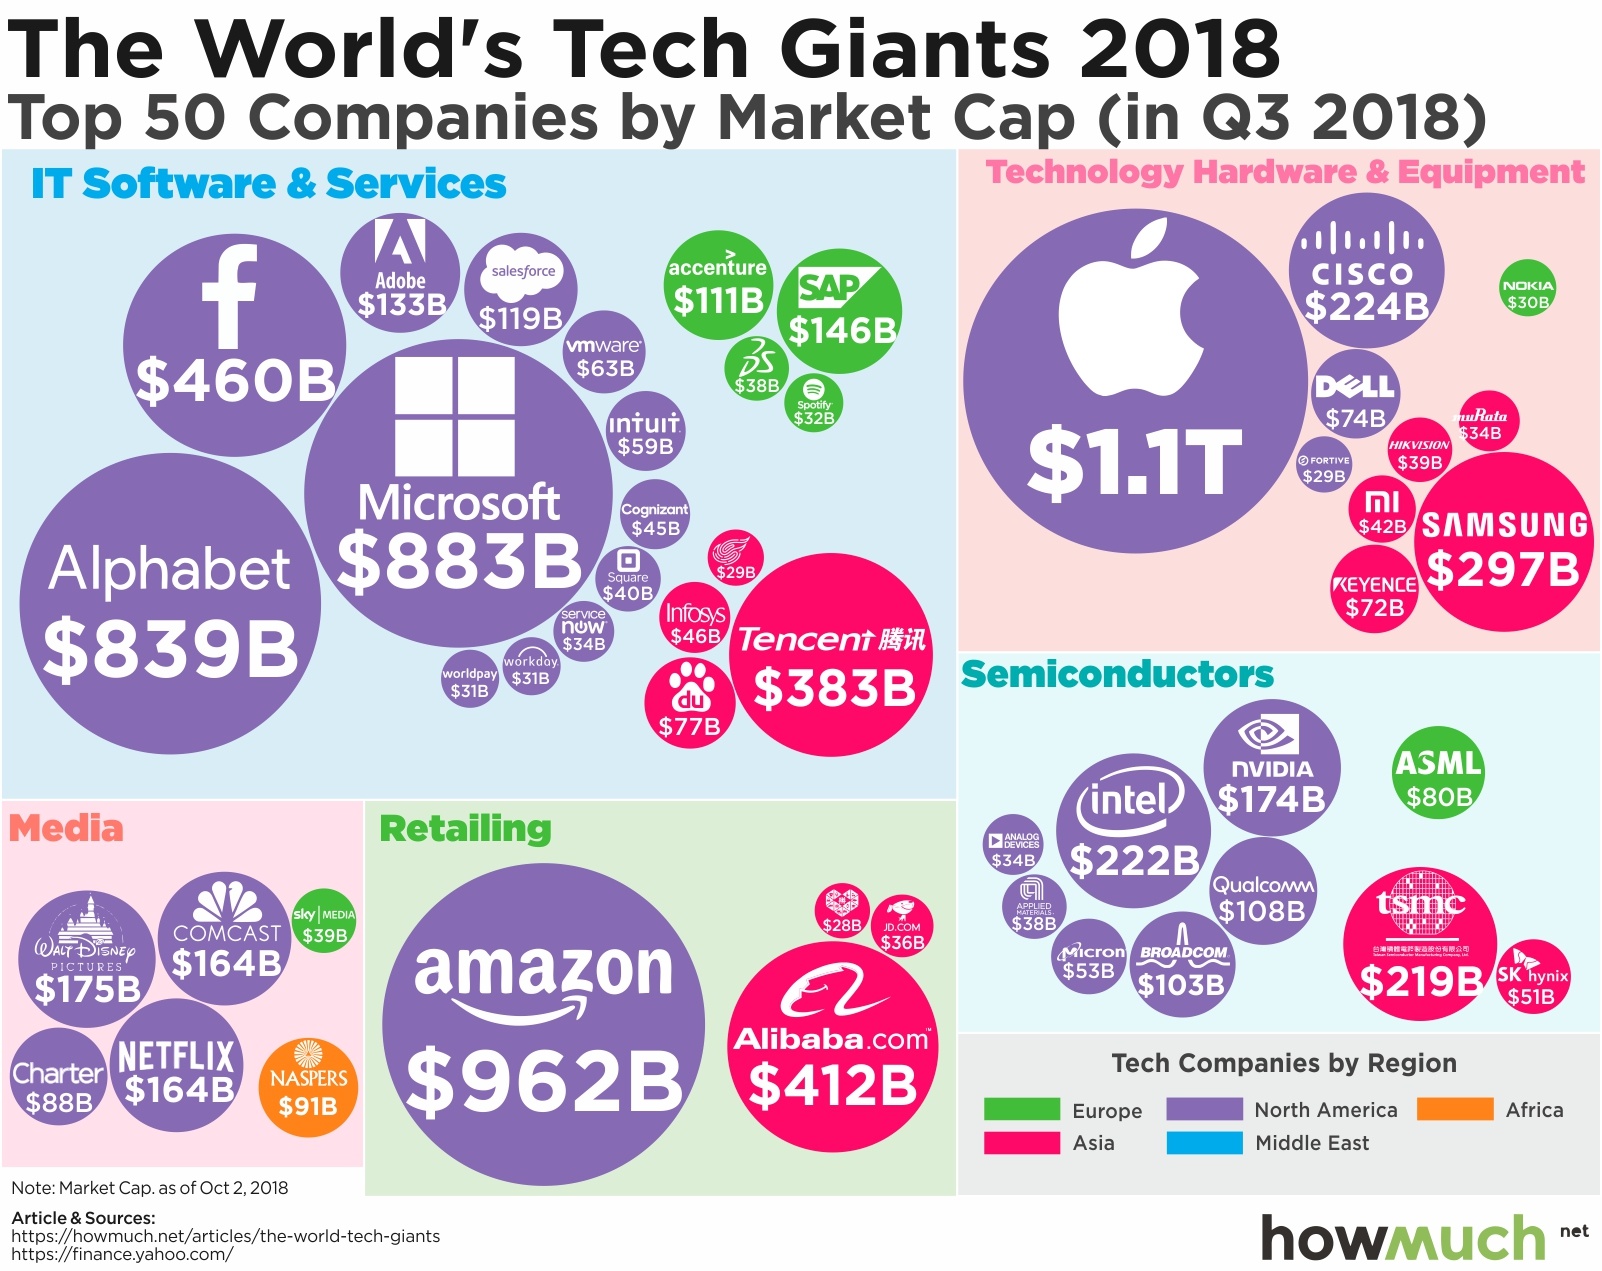
To evaluate the top notch tech companies across the globe, Howmuch.net took into consideration the market cap ranking given by Forbes and split it in an unique way. Obviously, the US and China houses some of the wealthiest companies, worth hundreds of billions of dollars.

2

Below we’ve 10 most high-valued tech companies on the planet, according to their market caps as of October 2018:

  • Apple: $1.1T
  • com: $962B
  • Microsoft: $883B
  • Alphabet: $839B
  • Facebook: $460B
  • Alibaba: $412B
  • Tencent Holdings: $383B
  • Samsung Electronics: $297B
  • Cisco Systems: $224B
  • Intel: $222B

(Give credits)

“At first glance, retailing and media appear to be much more evenly distributed than they actually are,” the report indicated. “Consider how Amazon has so dominated the market that its North American competitors are so small, they don’t even make it onto the list of top 50 companies. Amazon is so big, there is literally no other company in sight.”

Key Takeaways:

  • As always, Apple tops the list of tech companies, not only as the biggest tech company but it’s also the eighth largest company in the world according to Forbes’ Global 2000 list. The company saw $247.5 billion in sales, $53 billion in profit, $367.5 billion in assets and a market cap of $927 billion for the past year.
  • The AntiTrust Regulations and growth of 5G wireless can bring forth major changes in the modern tech market, and we are eagerly waiting for such shift in focus.

As parting thoughts, we would like to say that though the current market setup has been quite steady for a while, a surge of change may soon be here. Interestingly, Chinese tech bigwig, Alibaba is mostly likely to expand its scopes and capabilities, while 5G connectivity may appear fetching. Moreover, the speculation says antitrust regulation could disrupt functionalities of some of these companies.

To stay updated about technology-related news and innovations, follow DexLab Analytics. It’s a premier institution famous for state of the art data science courses in Delhi. For more, check out their homepage: an army of data science related courses are on offer.

 
The blog has been sourced from — www.techrepublic.com/article/the-10-most-valuable-tech-companies-in-the-world
 

Interested in a career in Data Analyst?

To learn more about Data Analyst with Advanced excel course – Enrol Now.
To learn more about Data Analyst with R Course – Enrol Now.
To learn more about Big Data Course – Enrol Now.

To learn more about Machine Learning Using Python and Spark – Enrol Now.
To learn more about Data Analyst with SAS Course – Enrol Now.
To learn more about Data Analyst with Apache Spark Course – Enrol Now.
To learn more about Data Analyst with Market Risk Analytics and Modelling Course – Enrol Now.
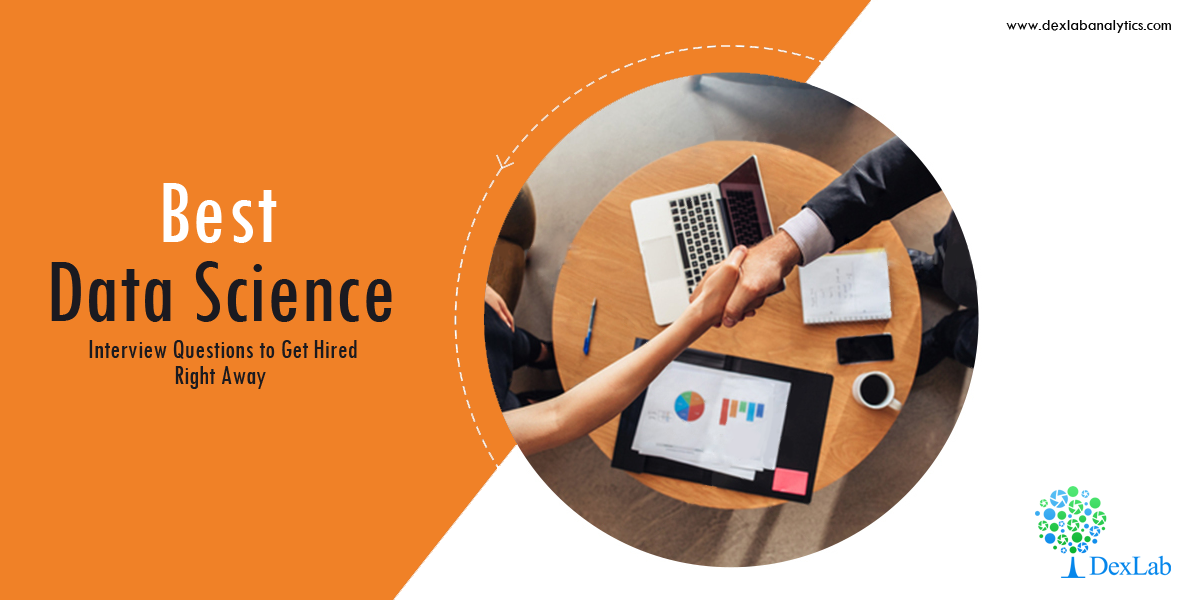
Best Data Science Interview Questions to Get Hired Right Away

Best Data Science Interview Questions to Get Hired Right Away

Data scientists are big data ninjas. They tackle colossal amounts of messy data, and utilize their imposing skills in statistics, mathematics and programming to collect, manage and analyze data. Next, they combine all their analytic abilities – including, industry expertise, encompassing knowledge and skepticism to unravel integral business solutions of meaningful challenges.

But how do you think they become such competent data wranglers? Years of experience or substantial pool of knowledge, or both? In this blog, we have penned down the most important interview data questions on data science – it will only aid you crack tough job interviews but also will test your knowledge about this promising field of study.

2

DexLab Analytics offers incredible Data Science Courses in Delhi. Start learning from the experts!

What do you mean by data science?

Data is a fine blend of statistics, technical expertise and business acumen. Together they are used to analyze datasets and predict the future trend.

Which is more appropriate for text analytics – R or Python?

Python includes a very versatile library, known as Pandas, which helps analysts use advanced level of data analysis tools and data structures. R doesn’t have such a feature. Therefore, Python is the one that’s highly suitable for text analytics.

Explain a Recommender System.

Today, a recommender system is extensively deployed across multiple fields – be it music recommendations, movie preferences, search queries, social tags, research and analysis – the recommender system works on a person’s past to build a model to predict future buying or movie-viewing or reading pattern in the individual.

What are the advantages of R?

  • A wide assortment of tools available for data analysis
  • Perform robust calculations on matrix and array
  • A well-developed yet simple programming language is R
  • It supports an encompassing set of machine learning applications
  • It poses as a middleman between numerous tools, software and datasets
  • Helps in developing ace reproducible analysis
  • Offers a powerful package ecosystem for versatile needs
  • Ideal for solving complex data-oriented challenges

What are the two big components of Big Data Hadoop framework?

HDFS – It is the abbreviated form of Hadoop Distributed File System. It’s the distributed database that functions over Hadoop. It stores and retrieves vast amounts of data in no time.

YARN – Stands for Yet Another Resource Negotiator. It aims to allocate resources dynamically and manage workloads.

How do you define logistic regression?

Logistic regression is nothing but a statistical technique that analyzes a dataset and forecasts significant binary outcomes. The outcome has to be in either zero or one or a yes or no.

How machine learning is used in real-life?

Following are the real-life scenarios where machine learning is used extensively:

  • Robotics
  • Finance
  • Healthcare
  • Social media
  • Ecommerce
  • Search engine
  • Information sharing
  • Medicine

What do you mean by Power Analysis?

Power analysis is best defined as the process of determining sample size required for determining an impact of a given size from a cause coupled with a certain level of assurance. It helps you understand the sample size estimate and in the process aids you in making good statistical judgments.

To get an in-depth understanding on data science, enroll for our intensive Data Science Certification – the course curriculum is industry-standard, backed by guaranteed placement assistance.

The blog has been sourced fromintellipaat.com/interview-question/data-science-interview-questions

Interested in a career in Data Analyst?

To learn more about Data Analyst with Advanced excel course – Enrol Now.
To learn more about Data Analyst with R Course – Enrol Now.
To learn more about Big Data Course – Enrol Now.

To learn more about Machine Learning Using Python and Spark – Enrol Now.
To learn more about Data Analyst with SAS Course – Enrol Now.
To learn more about Data Analyst with Apache Spark Course – Enrol Now.
To learn more about Data Analyst with Market Risk Analytics and Modelling Course – Enrol Now.
The Big Data Driven Future of Fashion: How Data Influences Fashion

The Big Data Driven Future of Fashion: How Data Influences Fashion

Big Data is revolutionizing every industry, including fashion. The nuanced notion of big data is altering the ways designers create and market their clothing. It’s not only aiding designers in understanding customer preferences but also helps them market their products well. Hadoop BI is one of the potent tools of technology that provides a wide pool of information for designers to design range of products that will sell.

2

How Does the Mechanism Work?

Large sets of data help draw patterns and obviously trends play a crucial role across the fashion industry. In terms of nature, fashion and trends both are social. Irrespective of the nature of data, structured or unstructured, framing trends and patterns in the fashion industry leads to emerging ideas, strategies, shapes and styles, all of which ushers you into bright and blooming future of fashion.

What Colors To Choose For Your Line?

KYC (Know Your Customer) is the key here too. A fashion house must know which colors are doing rounds amongst the customers. Big data tells a lot about which color is being popular among the customers, and based on that, you can change your offerings subject to trend, style picks and customer preferences.

Men’s or Women’s Clothing: Which to Choose?

Deciding between men’s or women fashion is a pivotal point for any designer. Keep in mind, target demographic for each designer is different, and they should know who will be their prospective customers and who doesn’t run a chance.

Big data tool derive insights regarding when customers will make purchases, how large will be the quantity and how many items are they going to buy. Choosing between men’s and women’s fashion could make all the difference in the world.

Arm yourself with business analyst training courses in Gurgaon; it’s high time to be data-friendly.

Transforming Runway Fashion into Retail Merchandise

Launching a brand in the eyes of the public garners a lot of attention, and the designs need to be stellar. But, in reality the fashion that we often see on runways is rarely donned by the ordinary customers; because, the dresses and outfits that are showcased on the ramp are a bit OTT, thus altered before being placed in the stores. So, big data aids in deciphering which attires are going to be successful, and which will fail down the line. So, use the power of big data prudently and reap benefit, unimaginable across the global retail stores.

Deciding Pricing of the Product

As soon as the garbs leave the runway, they are tagged with prices, which are then posted inside the stores, after analyzing how much the customers are willing to pay for a particular product. For averaging, big data is a saving grace. Big data easily averages the prices, and decides a single mean price, which seems to be quite justifiable.

However, remember, while pricing, each garments are designed keeping in mind a specified customer range. Attires that are incredibly expensive are sold off to only a selected affluent user base, while the pricing of items that are designed for general public are pegged down. Based on previous years’ data, big data consultants can decide the pricing policy so that there’s something for all.

The world of fashion is changing, and so is the way of functioning. From the perspective of fashion house owner, collect as much data as possible of customers and expand your offerings. Big data analytics is here to help you operate your business and modify product lines that appeals to the customers in future.

And from the perspective of a student, to harness maximum benefits from data, enroll in a data analyst course in Gurgaon. Ask the consultants of DexLab Analytics for more deets.


The article has been sourced from

channels.theinnovationenterprise.com/articles/8230-big-data-hits-the-runway-how-big-data-is-changing-the-fashion-industry

iamwire.com/2017/01/big-data-fashion-industry/147935

bbntimes.com/en/technology/big-data-is-stepping-into-the-fashion-world


Interested in a career in Data Analyst?

To learn more about Data Analyst with Advanced excel course – Enrol Now.
To learn more about Data Analyst with R Course – Enrol Now.
To learn more about Big Data Course – Enrol Now.

To learn more about Machine Learning Using Python and Spark – Enrol Now.
To learn more about Data Analyst with SAS Course – Enrol Now.
To learn more about Data Analyst with Apache Spark Course – Enrol Now.
To learn more about Data Analyst with Market Risk Analytics and Modelling Course – Enrol Now.

FAQs before Implementing a Data Lake

FAQs before Implementing a Data Lake

Data Lake – is a term you must have encountered numerous times, while working with data. With a sudden growth in data, data lakes are seen as an attractive way of storing and analyzing vast amounts of raw data, instead of relying on traditional data warehouse method.

But, how effective is it in solving big data related problems? Or what exactly is the purpose of a data lake?

Let’s start with answering that question –

What exactly is a data lake?

To begin with, the term ‘Data Lake’ doesn’t stand for a particular service or any product, rather it’s an encompassing approach towards big data architecture that can be encapsulated as ‘store now, analyze later’. In simple language, data lakes are basically used to store unstructured or semi-structured data that is derived from high-volume, high-velocity sources in a sudden stream – in the form of IoT, web interactions or product logs in a single repository to fulfill multiple analytic functions and cases.

2

What kind of data are you handling?

Data lakes are mostly used to store streaming data, which boasts of several characteristics mentioned below:

  • Semi-structured or unstructured
  • Quicker accumulation – a common workload for streaming data is tens of billions of records leading to hundreds of terabytes
  • Being generated continuously, even though in small bursts

However, if you are working with conventional, tabular information – like data available from financial, HR and CRM systems, we would suggest you to opt for typical data warehouses, and not data lakes.

What kind of tools and skills is your organization capable enough to provide?

Take a note, creating and maintaining a data lake is not similar to handling databases. Managing a data lake asks for so much more – it would typically need huge investment in engineering, especially for hiring big data engineers, who are in high-demand and very less in numbers.

If you are an organization and lack the abovementioned resources, you should stick to a data warehouse solution until you are in a position of hiring recommended engineering talent or using data lake platforms, such as Upsolver – for streamlining the methods of creating and administering cloud data lake without devoting sprawling engineering resources for the cause.

What to do with the data?

The manner of data storage follows a specific structure that would be suitable for a certain use case, like operational reporting but the purpose for data structuring leads to higher costs and could also put a limit to your ability to restructure the same data for future uses.

This is why the tagline: store now, analyze later for data lakes sounds good. If you are yet to make your mind whether to launch a machine learning project or boost future BI analysis, a data lake would fit the bill. Or else, a data warehouse is always there as the next best alternative.

What’s your data management and governance strategy?

In terms of governance, both data warehouses and lakes pose numerous challenges – so, whichever solution you chose, make sure you know how to tackle the difficulties. In data warehousing, the potent challenge is to constantly maintain and manage all the data that comes through and adding them consistently using business logic and data model. On the other hand, data lakes are messy and difficult to maintain and manage.

Nevertheless, armed with the right data analyst certification you can decipher the right ways to hit the best out of a data lake. For more details on data analytics training courses in Gurgaon, explore DexLab Analytics.


The article has been sourced from — www.sisense.com/blog/5-questions-ask-implementing-data-lake


Interested in a career in Data Analyst?

To learn more about Data Analyst with Advanced excel course – Enrol Now.
To learn more about Data Analyst with R Course – Enrol Now.
To learn more about Big Data Course – Enrol Now.

To learn more about Machine Learning Using Python and Spark – Enrol Now.
To learn more about Data Analyst with SAS Course – Enrol Now.
To learn more about Data Analyst with Apache Spark Course – Enrol Now.
To learn more about Data Analyst with Market Risk Analytics and Modelling Course – Enrol Now.

5 Trends Shaping the Future of Data Analytics

5 Trends Shaping the Future of Data Analytics

Data Analytics is popular. The future of data science and analytics is bright and happening. Terms like ‘artificial intelligence’ and ‘machine learning’ are taking the world by storm.

Annual demand for the fast-growing new roles of data scientist, data developers, and data engineers will reach nearly 700,000 openings by 2020, says Forbes, a leading business magazine.


Last year, at the DataHack Summit Kirk Borne, Principal Data Scientist and Executive Advisor at Booz Allen Hamilton shared some slivers of knowledge in the illuminating field of data science. He believes that the following trends will shape up the world of data analytics, and we can’t agree more.

Dive down to pore over a definitive list – thank us later!

Internet of Things (IoT)

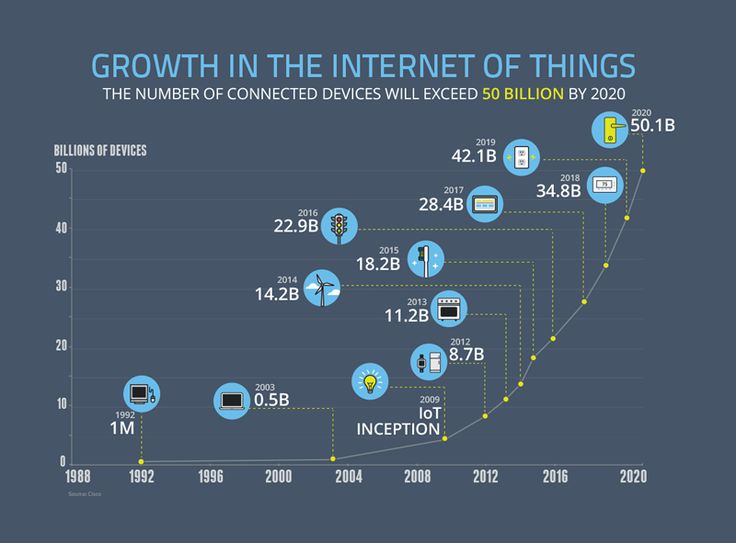
Does IoT ring any bell? Yes, it does, because it’s nothing but evolved wireless networks. The market of this fascinating new breed of tech is expected to grow from $170.57 billion in 2017 to $561.04 billion by 2022 – reasons being advanced analytics and superior data processing techniques.

Artificial Intelligence

An improved version of AI is Augmented Intelligence – instead of replacing human intelligence, this new sophisticated AI program largely focuses on AI’s assistive characteristic, enhancing human intelligence. The word ‘Augmented’ stands for ‘to improve’ and together it reinforces the idea of amalgamating machine intelligence with human conscience to tackle challenges and form relationships.

Augmented Reality

Look forward to better performances and successful models? Data is the weapon of all battles. Augmented Reality is indeed a reality now. The recent launch of Apple ARkit is a pivotal development in bulk manufacturing of AR apps. The power of AR is now in the fingertips of all iPhone users, and the development of Google’s Tango is an added thrust.

Hyper Personalization

#KnowYourCustomer, it has become an indispensable part of today’s retail marketing; the better you know your customers, the higher are the chances of selling a product. Yes, you heard that right. And Google Home and Amazon Echo is boosting the ongoing operations.

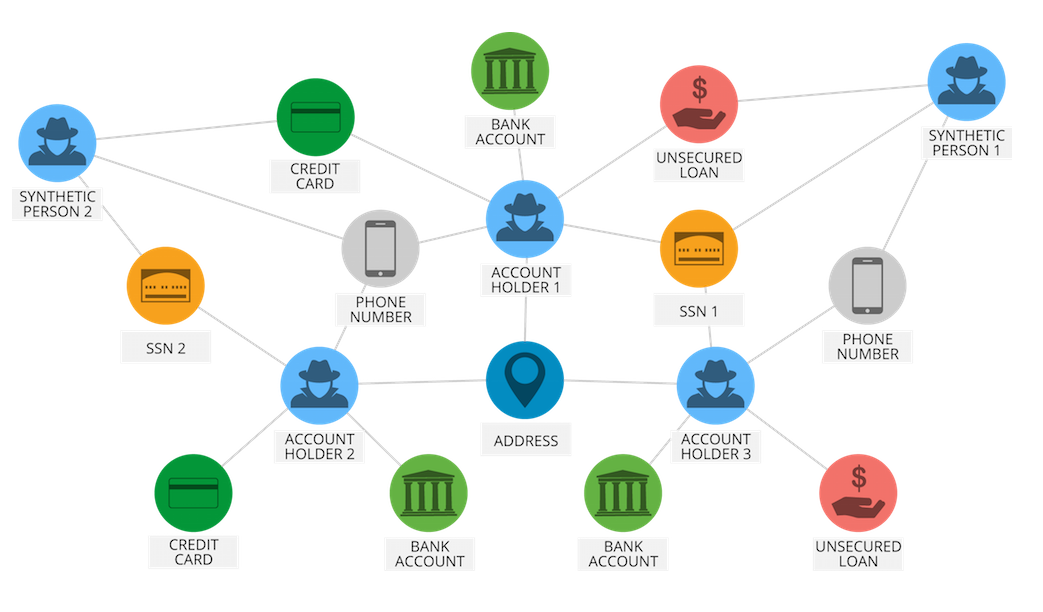
Graph Analytics

Mapping relationships across wide volumes of well connected critical data is the essence of graph analytics. It’s an intricate set of analytics tools used for unlocking insightful questions and delivering more accurate results. A few use cases of graph analytics is as follows:

  • Optimizing airline and logistic routes
  • Extensive life science researches
  • Influencer analysis for social network communities
  • Crime detection, including money laundering

 
Advice: Be at the edge of data accumulation – because data is power, and data analytics is the power-device.

Calling all data enthusiasts… DexLab Analytics offers state of the art data analytics training in Gurgaon within affordable budget. Apply now and grab amazing discounts and offers on data analyst course.


The article has been sourced from – yourstory.com/2017/12/data-analytics-future-trends


Interested in a career in Data Analyst?

To learn more about Data Analyst with Advanced excel course – Enrol Now.
To learn more about Data Analyst with R Course – Enrol Now.
To learn more about Big Data Course – Enrol Now.

To learn more about Machine Learning Using Python and Spark – Enrol Now.
To learn more about Data Analyst with SAS Course – Enrol Now.
To learn more about Data Analyst with Apache Spark Course – Enrol Now.
To learn more about Data Analyst with Market Risk Analytics and Modelling Course – Enrol Now.

A Comprehensive Study on Analytics and Data Science India Jobs 2018

A Comprehensive Study on Analytics and Data Science India Jobs 2018

India accounts for 1 in 10 data science job openings worldwide – with about 90,000 vacancies, India ranks as the second-biggest analytics hub, next to the US – according to a recent study compiled by two renowned skilling platforms. The latest figure shows a 76% jump from the last year.

With the advent of artificial intelligence and its overpowering influence, the demand for skill-sets in machine learning, data science and analytics is increasing rapidly. Job creation in other IT fields has hit a slow-mode in India, making it imperative for people to look towards re-skilling themselves with new emerging technologies… if they want to stay relevant in the industry. Some newer roles have also started mushrooming, with which we are not even acquainted now.

2

Top trends in analytics jobs in 2018 as follows:

  • The total number of data science and analytics jobs nearly doubled from 2017 to 2018.
  • There’s been a sharp contrast in the percentage increase of analytics job inventory in the past years – from 2015 to 2016, the number of analytics jobs increased by 52%, which increased by only 40% from 2014 to 2015.
  • Currently, if we go by the reports, nearly 50000 analytics job positions are currently available to get filled by suitable candidates. Although the exact numbers are difficult to ascertain.
  • Amazon, Goldman Sachs, Citi, E&Y, Accenture, IBM, HCL, JPMorgan Chase, KPMG and Capgemini – are 10 top-tier organizations with the highest number of analytics opening in India.

City Figures

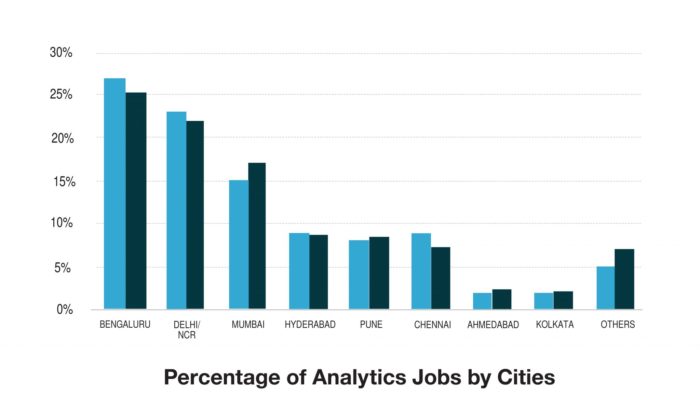
Bengaluru is the IT hub of India and accounts for the largest share of the data science and analytics jobs in India. Approximately, it accounted for 27% of jobs till the quarter of the last year.

Tier-II cities also witnessed a surging trend in such roles from 7% to 14% in between 2017 and 2018 – as startups started operating out of these locations.

Delhi/NCR ranks second contributing 22% analytics jobs in India, followed by Mumbai with 17%.

Industry Figures

Right from hospitality, manufacturing and finance to automobiles, job openings seem to be in every sector, and not just limited to hi-tech industries.

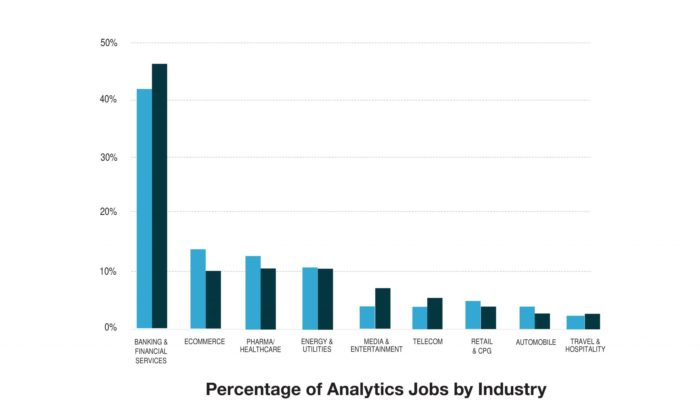
Banking and financial sector continued to be the biggest job drivers in analytics domain. Almost 41% of jobs were posted from the banking sector alone, though the share fell from last year’s 46%.

Ecommerce and media and entertainment followed the suit and contributed to analytics job inventory. Also, the energy and utilities seem to have an uptick in analytics jobs, contributing to almost 15% of all analytics jobs, 4% hike from the last year’s figure.

Education Requirement Figures

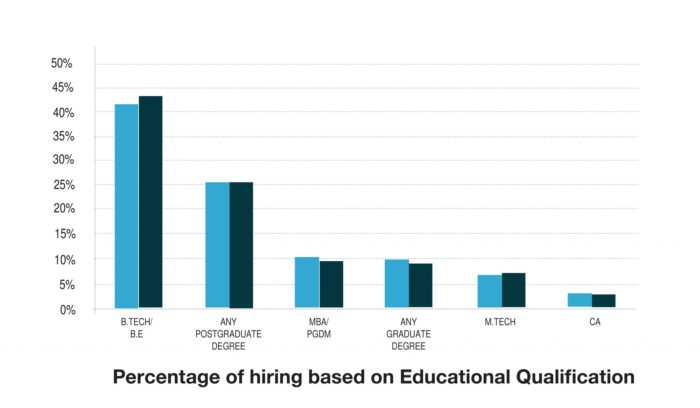
In terms of education, almost 42% of data analytics job requirements are looking for a B.Tech or B.E degree in candidates. 26% of them prefer a postgraduate degree, while only 10% seeks an MBA or PGDM.

In a nutshell, 80% of employers resort to hiring analytics professionals who have an engineering degree or a postgraduate degree.

As a result, Data analyst course has become widely popular. It’s an intensive, in-demand skill training that is intended for business, marketing and operations managers, data analyst and professionals and financial industry professionals. Find a reputable data analyst training institute in Gurgaon and start getting trained from the experts today.


The article has been sourced from:

https://qz.com/1297493/india-has-the-most-number-of-data-analytics-jobs-after-us

https://analyticsindiamag.com/analytics-and-data-science-india-jobs-study-2017-by-edvancer-aim


Interested in a career in Data Analyst?

To learn more about Data Analyst with Advanced excel course – Enrol Now.
To learn more about Data Analyst with R Course – Enrol Now.
To learn more about Big Data Course – Enrol Now.

To learn more about Machine Learning Using Python and Spark – Enrol Now.
To learn more about Data Analyst with SAS Course – Enrol Now.
To learn more about Data Analyst with Apache Spark Course – Enrol Now.
To learn more about Data Analyst with Market Risk Analytics and Modelling Course – Enrol Now.
An ABC Guide to Sampling Theory

An ABC Guide to Sampling Theory

Sampling theory is a study involving collection, analysis and interpretation of data accumulated from random samples of a population. It’s a separate branch of statistics that observes the relationship existing between a population and samples drawn from the population.

In simple terms, sampling means the procedure of drawing a sample out of a population. It aids us to draw a conclusion about the characteristics of the population after carefully studying only the objects present in the sample.

Here we’ve whisked out a few sampling-related terms and their definitions that would help you understand the nuanced notion of sampling better. Let’s have a look:

Sample – It’s the finite representative subset of a population. It’s chosen from a population with an aim to scrutiny its properties and principles.

Population – When a statistical investigation focuses on the study of numerous characteristics involving items on individuals associated with a particular group, this group under study is known as the population or the universe. A group containing a finite number of objects is known as finite population, while a group with infinite or large number of objects is called infinite population.

Population parameter – It’s an obscure numerical factor of the population. It’s no brainer that the primary objective of a survey is to find the values of different measures of population distribution; and the parameters are nothing but a functional variant inclusive of all population units.

2

Estimator – Calculated based on sample values, an estimator is a functional measure.

Sampling fluctuation of an estimator – When you draw a particular sample from a given population, it contains different set of population members. As a result, the value of the estimator varies from one sample to another. This difference in values of the estimator is known as the sampling fluctuations of an estimator.

Next, we would like to discuss about the types of sampling:

There are mainly two types of random sampling, and they are as follows:

Simple Random Sampling with Replacement

In the first case, the ‘n’ units of the sample are drawn from the population in such a way that at each drawing, each of the ‘n’ numbers of the population gets the same probability 1⁄N of being selected. Hence, this methods is called the simple random sampling with replacement, clearly, the same unit of population may occur more than once inj a simple. Hence, there are N^n samples, regard being to the orders in which ‘n’ sample unit occur and each such sample has the probability 1/N^n .

Simple Random Sampling Without Replacement

In the second case each of the ‘n’ members of the sample are drawn one by one but the members once drawn are not returned back to the population and at each stage remaining amount of the population is given the same probability of being includes in the sample. This method of drawing the sample is called SRSWOR therefore under SRSWOR at any r^th number of draw there remains (N-r+1) units. And each unit has the probability of 1/((N-r+1) ) of being drawn.

Remember, if we take ‘n’ individuals at once from a given population giving equal probability to each of the observations, then the total number of possible example in (_n^N)C i.e.., combination of ‘n’ members out of ‘N’ numbers of the population will from the total no. of possible sample in SRSWOR.

The world of statistics is huge and intensively challenging. And so is sampling theory.

But, fret now. Our data science courses in Noida will help you understand the nuances of this branch of statistics. For more, visit our official site.  

P.S: This is our first blog of the series ‘sampling theory’. The rest will follow soon. Stay tuned.


Interested in a career in Data Analyst?

To learn more about Data Analyst with Advanced excel course – Enrol Now.
To learn more about Data Analyst with R Course – Enrol Now.
To learn more about Big Data Course – Enrol Now.

To learn more about Machine Learning Using Python and Spark – Enrol Now.
To learn more about Data Analyst with SAS Course – Enrol Now.
To learn more about Data Analyst with Apache Spark Course – Enrol Now.
To learn more about Data Analyst with Market Risk Analytics and Modelling Course – Enrol Now.
Microsoft Introduces FPGA Technology atop Google Chips through Project Brainwave

Microsoft Introduces FPGA Technology atop Google Chips through Project Brainwave

A Change Is In the Make – due to increasing competition among tech companies working on AI, several software makers are inventing their own new hardware. A few Google servers also include chips designed for machine learning, known as TPUs exclusively developed in-house to ensure higher power and better efficiency. Google rents them out to its cloud-computing consumers. Of late, Facebook too shared its interest in designing similar chips for its own data centers.

However, a big player in AI world, Microsoft is skeptical if the money spent is for good – it says the technology of machine learning is transforming so rapidly that it makes little sense to spend millions of dollars into developing silicon chips, which could soon become obsolete. Instead, Microsoft professionals are pitching for the idea of implementing AI-inspired projects, named FPGAs, which can be re-modified or reprogrammed to support latest forms of software developments in the technology domain.  The company is buying FPGAs from chip mogul, Intel, and already a few companies have started buying this very idea of Microsoft.

This week, Microsoft is back in action with the launch of a new cloud service for image-recognition projects, known as Project Brainwave. Powered by the very FPGA technology, it’s one of the first applications that Nestle health division is set to use to analyze the acuteness of acne, from images submitted by the patients. The specialty of Project Brainwave is the manner in which the images are processed – the process is quick as well as very low in cost than other graphic chip technologies used today.

It’s been said, customers using Project Brainwave are able to process a million images in just 1.8 milliseconds using a normal image recognition model for a mere 21 cents. Yes! You heard it right. Even the company claims that it performs better than it’s tailing rivals in cloud service, but unless the outsiders get a chance to test the new technology head-to-head against the other options, nothing concrete can be said about Microsoft’s technology. The biggest competitors of Microsoft in cloud-service platform include Google’s TPUs and graphic chips from Nvidia.

Let’s Take Your Data Dreams to the Next Level

At this stage, it’s also unclear how widely Brainwave is applicable in reality – FPGAs are yet to be used in cloud computing on a wide scale, hence most companies lack the expertise to program them. On the other hand, Nvidia is not sitting quietly while its contemporaries are break opening newer ideas in machine learning domain. The recent upgrades from the company lead us to a whole new world of specialized AI chips that would be more powerful than former graphic chips.

Latest reports also confirm that Google’s TPUs exhibited similar robust performance similar to Nvidia’s cutting edge chips for image recognition task, backed by cost benefits. The software running on TPUs is both faster and cheaper as compared to Nvidia chips.

In conclusion, companies are deploying machine learning technology in all areas of life, and the competition to invent better AI algorithms is likely to intensify manifold. In the coming days, several notable companies, big or small are expected to follow the footsteps of Microsoft.

For more machine learning related stories and feeds, follow DexLab Analytics. It is the best data analytics training institute in Gurgaon offering state of the art machine learning using python courses.

The article has been sourced from – https://www.wired.com/story/microsoft-charts-its-own-path-on-artificial-intelligence


Interested in a career in Data Analyst?

To learn more about Machine Learning Using Python and Spark – click here.

To learn more about Data Analyst with Advanced excel course – click here.
To learn more about Data Analyst with SAS Course – click here.
To learn more about Data Analyst with R Course – click here.
To learn more about Big Data Course – click here.

Call us to know more