Recently a world’s top magazine crowned the job role of Data Analyst as the sexiest job of the 21st Century. But there is still much confusion as to why this title is so much in demand in the job market presently and what makes it such a desirable gig. So, we would like to take this opportunity to describe in detail what the job role of data analysts entail, why is it so much in demand, what can an aspiring data analyst expect in this job, what are the payment packages and what the future holds for this breed of pseudo-scientists. Continue reading “What Makes A Data Analyst?”
Author: Dexlab
We Analyzed The Statistics Of Game Of Thrones
Are you a data science enthusiast as well as a fan of Game of Thrones? Then this blog is where you should stick your eyes to and fear not as we will not give you any spoilers.
Of the zillion of characters in the show, ever imagined which is the main character the show is leading with? Amidst the characters like Tyrion, Bran, Dany and pals who is the main one in the Game of Thrones? Continue reading “We Analyzed The Statistics Of Game Of Thrones”
Most Commonly Asked Tableau Interview Questions
In the near future, the world’s data generation will nearly double in amount than what it is now. According to a survey conducted by the IDC (International Data Corporation) by 2020 we will generate 50 times more data than in 2011. Now that such a gargantuan amount of data will be generated which will come with real-world business implications, thus, businesses around the world will require tools which should be capable to analyze this data and gather actionable insights from them. Tableau is a tool that helps organizations do exactly that, i.e. data mining and visualizing business opportunities to take requisite actions for amplifying revenue generation. So, it is understandable that the demand for personnel proficient in Tableau is expected to rise by manifolds in the next few years.
So, we India’s leading Tableau training institute have compiled a list of the most commonly asked interview questions for a position of Tableau operator/executive in this post. If you have more such questions that you have recently come across in an interview and would like to know the answer feel free to drop them in the comments below and our data science training faculty will get to them ASAP. And if you would like to take up a Tableau Certification course or take up an online Tableau training check out our curriculum on Tableau BI Certification.

Common interview questions on Tableau:
Do you know the difference between Live Data and Extract Data in Tableau?
The best answer to this question: An ‘extract’ connection is a connection with a static database, which is refreshed every day/hour/period. In this case all data are copied from the data source to the Tableau Server. Refreshing the data source will not give you the latest data – you have to refresh the extract to get them.
A live connection will query the underlying data in the data source/database – refreshing the visualization will give you the latest results. In this case no data is copied to Tableau Server for pre-processing.
• Name a few of the different types of filters used in tableau.
The best answer to this question:
The 3 types of Filters in Tableau are:
1) Quick Filter
2) Data Source Filter
3) Context Filter
Can you tell me the difference between parameters and filters in Tableau?
The best answer to this question: The difference actually lies in the application. Parameters allow users to insert their values these can be float, integers, string, date that can be used in calculations. However, filters receive only values users choose to ‘filter by’ the list this cannot be used to perform calculations.
Users can dynamically change measures and dimensions in parameter but filters do not support of this feature.
How will you view underlying SQL Queries in Tableau?
The best answer to this question: Viewing underlying SQL Queries in Tableau can be done in two ways:
• Create a Performance Recording, to register performance information about the main events you interact with workbook. Users can view the performance metrics in a workbook created by Tableau.
Help> Settings and Performance> Start Performance Recording
Help> Setting and Performance > Stop Performance Recording
• Reviewing the Tableau Desktop Logs located at C:\Users\\My Documents\My Tableau Repository. For live connection to data source, you can check log.txt and tabprotosrv.txt files. For an extract, check tdeserver.txt file.
Do you know the difference between .(dot) twb and .(dot) twbx?
The best answer to this question: The .(dot) twb is the most common file extension used in Tableau, which presents an XML format file and comprises all the data present in each dashboard and sheet like what fields are used in the views, styles and formatting that are applied to a sheet and dashboard.
But this workbook does not contain any data. The Packaged Workbook merges the data in a Tableau workbook with the local data available (which is not on server). A. (dot) twbx serves as a zip file this includes custom images if any. Packaged Workbook allows users to share their workbook information with other Tableau Desktop users and let them open it in Tableau Reader.
How many maximum tables can you join in Tableau?
The best answer to this question: A maximum number of 32 tables can be joined in Tableau. A table size must also be limited to 255 columns (fields).
Here were the answers to the most commonly asked Tableau interview questions, for more such interesting data analytics news, job updates and discussions follow our daily uploads from DexLab Analytics. We have recently launched our new branch in Pune, so, now Maharashtrians can also get their data analytics certification from DexLab Analytics, we add values to dull data!
Best of luck for your Tableau interview!
Interested in a career in Data Analyst?
To learn more about Data Analyst with Advanced excel course – Enrol Now.
To learn more about Data Analyst with R Course – Enrol Now.
To learn more about Big Data Course – Enrol Now.To learn more about Machine Learning Using Python and Spark – Enrol Now.
To learn more about Data Analyst with SAS Course – Enrol Now.
To learn more about Data Analyst with Apache Spark Course – Enrol Now.
To learn more about Data Analyst with Market Risk Analytics and Modelling Course – Enrol Now.
The Right Tool For Statistical Analysis SAS Vs. Stata
Both SPSS and SAS have been around in the world of statistical analysis for several years now, so, the conundrum of which is better software for statistical analysis is an age-old question among data people.
To begin with SAS is in its version 9+ and has also enhanced its visual appeal greatly. But SPSS still comes with its popular “click and get results” interface. SPSS has also moved beyond its version 15.0+ and has also began adding different modules like its competitor SAS. Continue reading “The Right Tool For Statistical Analysis SAS Vs. Stata”
The First Sci-Fi Movie Written By An Algorithm!
If you thought algorithms were these boring formulas that have no point, then it is time for you to rethink. Algorithms these days are replacing the need for human intellect altogether (do you smell a hint of irony in there?). As much as this may sound totally unbelievable but it is in fact the truth. The first ever short film has been made that is completely written by an algorithm, and is finally out and it is pretty great. Although the convoluted dialogues of the screenplay needs a few mental gymnastics to be performed by the audience’s brains, but then again isn’t that the best thing about sci-fi movies after all?
The story behind this amazing film starts with an aspiring film-maker Oscar Sharp, named appropriately for the movie-making world (Again irony… Get it? Oscar… movies?!). This young screenplay writer wanted to submit a plot for Sci-Fi London’s 48 Hour Film Challenge. So, to create the next big hit in the world of Sci-Fi short films he read all the screenplays he could find, of the best sci-fi movies on the internet. Then the right inspiration struck him and he came up with the idea to feed all these movie plots into an algorithm, starting from movies like Ghostbusters to The X-Flies and movies like Interstellar, The Fifth Element and many more and let the algorithm work up on a script on its own. Ingenious you say or was it a complete idiocy? Only to be discovered later that it was a great idea only with the right algorithm. Continue reading “The First Sci-Fi Movie Written By An Algorithm!”
Difference between a Heat Map and a Tree Map
Are you planning to pursue a Tableau training course in Delhi? Then you must be well aware of this common confusion about the difference between these two widely used maps. There are two very useful charts which help in analyzing data, heat maps and tree maps. Heat maps and tree maps are highly insightful visualizations. However, many a times, there is a confusion between the two due to which analysts either use misuse it or totally avoid using it.
This article will help to draw a clear line between heat maps and tree maps, thus enabling analysts pursuing tableau certification, Gurgaon to create better visualizations.
We the faculty at Dexlab Analytics, the premiere Tableau Training Institute in Gurgaon aim to clarify this common doubt with this brief discussion on these two maps.

What are heat maps?
Heat map is a type of visualization tool that is very apt to compare different categories. It helps to visualize measures against dimensions with the help of colors and size to compare one or more dimensions & up to two measures. The layout is similar to a text table with variations in values encoded as colors. In heat map, you can quickly see a wide array of information.
In a heat map, one measure can be assigned to the color and another measure can be assigned to the size.
Quick Hands-On: Shows the sales and profit in all regions for different products category and sub-Category.
Analysis of visualization: The profit is represented by the color and ranges from red for loss to green for profit. The total sales are represented by the size.
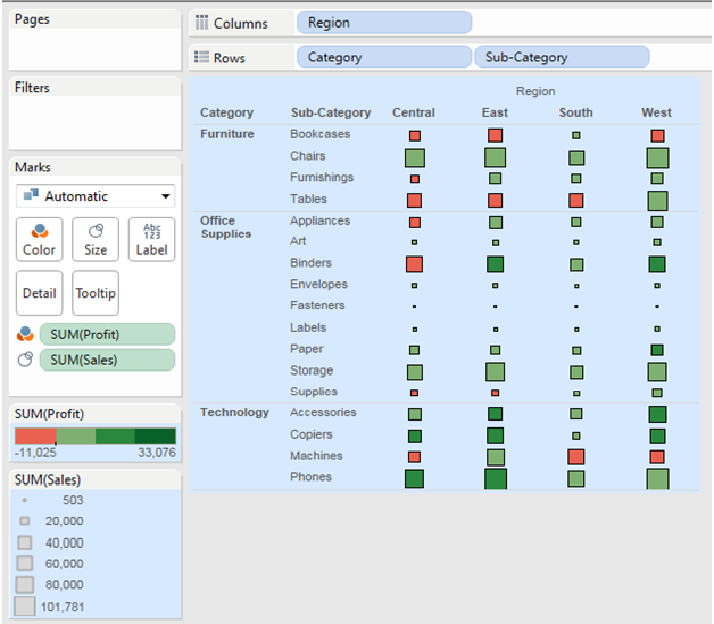
Hence, it is very easy to understand the performance of different products in different regions, at one glance, just by looking at the heat map.
What are tree maps?
Tree maps are a relatively new feature in Tableau, first appearing in version 8.0. The ‘tree map’ is a chart type that displays hierarchical or part-to-whole relationships via rectangles. In case of hierarchical (tree-structured) data these rectangles are nested. The space in the view is divided into rectangles that are sized and ordered by a measure. Nested rectangles mean that hierarchy levels in the data are expressed by larger rectangles (above in the hierarchy) containing smaller ones (below in the hierarchy). The rectangles in the tree map range in size from the top left corner of the chart to the bottom right corner, with the largest rectangle positioned in the top left corner and the smallest rectangle in the bottom right corner.
In a tree map 1 or more dimensions & up to 2 measures are used to create such a map.
Quick Hands- On: Show the sales and profit in all regions for different products category and Sub-Category.
Analysis of the visualization: The profit (color) and sales (size) of products are given at a Category and Sub- Category level. Bigger the size of the node, greater is the sales in that state. Similarly, the greener the node, more is the profit in that state.
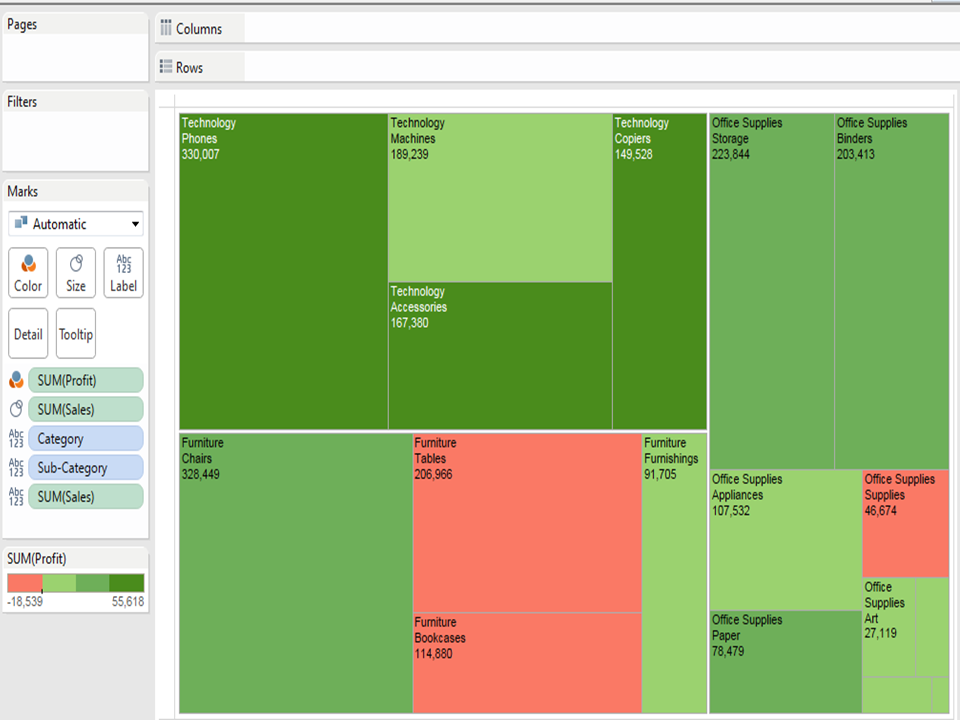
Summary: A slight disadvantage of using tree maps in Tableau is that, as the number of items increase, the amount of space allocated for each item decreases. Hence, the area available to print the labels, become small. As a result, usually, in a tree map almost all the squares or nodes will appear blank. This defect can be overcome by providing appropriate tooltips for each node. Like in heat maps, measures can be assigned to give different colors and sizes to the nodes in the tree map.
To learn the right use of these two maps in Tableau we recommend seeking a corporate Tableau Training in Delhi NCR for better understanding of this complex statistical application.
Interested in a career in Data Analyst?
To learn more about Data Analyst with Advanced excel course – Enrol Now.
To learn more about Data Analyst with R Course – Enrol Now.
To learn more about Big Data Course – Enrol Now.To learn more about Machine Learning Using Python and Spark – Enrol Now.
To learn more about Data Analyst with SAS Course – Enrol Now.
To learn more about Data Analyst with Apache Spark Course – Enrol Now.
To learn more about Data Analyst with Market Risk Analytics and Modelling Course – Enrol Now.
How Predictive Analysis Can Be Used In Healthcare For The Better
Medical predictive analysis is slowly being recognized as a system that if utilized well can completely change the very face of medicine and healthcare practices.
We have all been a patient at least once in our lives and there is a high likely that we will be so again. While some of us may require medical attention more frequently than others and some do not, but we have all been to the clinic at some point and we all desire the best of medical care. We believe that the doctors and technicians there are equipped to provide us with that and that there has been good research and understanding behind all their medical decisions. But that is often not the case. Continue reading “How Predictive Analysis Can Be Used In Healthcare For The Better”
Statistics of Workforce Inequality & Life After Work
Online companies and IT firms have been frequently criticized for their lack of diversity and gender inequality in the work force. So, we researched about some facts and statistics to understand these claims as after all we are data-driven being the premiere Analytics training institute, Pune. We found a gap in several US-based internet firms which have published diversity reports since, 2014 but what they claim has been starkly different from what the truth in the numbers happened to be. Surprisingly, being a developing nation, India has fared quite well in this realm with most of IT MNCs having addressed the issue of gender inequality in their workplace.
Here are some statistical facts about workplace diversity in internet companies in the US that show lack of diversity:
With majority of people that account for the AP (Advanced Placement) test takers in total only 20 percent were female in the tests for AP computer science test takers as of the data from 2014. Various US-based online corporations have been criticized for their apparent lack of tolerance and unwelcoming nature against females and non-Caucasians. Continue reading “Statistics of Workforce Inequality & Life After Work”
Aspiring Data Analysts Must Know the Answer to These Interview Questions
You have recently completed Data analyst certification and are hunting vigorously for a job as a data scientist. But the prospect of sitting for such an important job role at a corporate firm in front of a room full of C-suite interviewers is an intimidating prospect. But fear not as we at DexLab Analytics have got you covered both inside the class room as well out.
This megatrend on Big Data analysts started first in 2013, when the leading universities of the world began to realize the gap in between the demand and supply of Big Data professionals. And soon several , Data analyst training institutes cropped up here and there and rooms transformed into classrooms with several students being keen to learn about the steps to handle Big Data and to join the ranks of data scientists which is a highly sought after profession of these days. Continue reading “Aspiring Data Analysts Must Know the Answer to These Interview Questions”