Dexlab, Author at DexLab Analytics | Big Data Hadoop SAS R Analytics Predictive Modeling & Excel VBA - Page 71 of 80

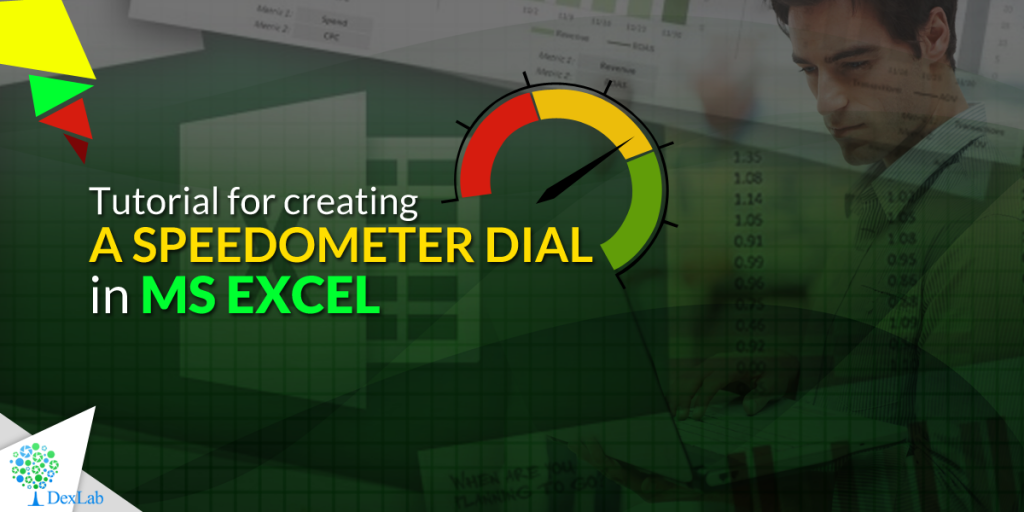
Tutorial for creating a Speedometer dial in MS Excel

 Tutorial for creating a Speedometer dial in MS Excel

Here in this video tutorial we have discussed in detailed steps, how to create a Speedometer chart in MS Excel. A Speedometer chart is often called as a gauge chart and combines two different type of charts, a pie chart and a doughnut chart.

The Speedometer dial is made with the help of using a Doughnut chart and needle is actually a combination of two types of charts, another doughnut chart and a pie chart.

A speedometer chart or a gauge chart can be created in other data visualization software as well, like for instance in Tableau and is usually easier to create due to availability of better controls and features.  It is due to the simplistic nature of these charts which is well adjusted to context of data and is a great use of space in a spreadsheet that charts like these are popular with non-data executives. Usually such non-data personnel do not want to dig deep into the contextual details like an analyst which is why these charts are great for using in a presentation where diverse departmental executives will be participating.

Gauge charts pack in a lot of horsepower and form a sort of ubiquitous symbol when it comes to understanding business metrics from an analytical point of view. So, learn to create these charts with our simple tutorial and for more such interesting lessons on data analysis software, join us every day as we share technical posts based on data on a regular basis.


Interested in a career in Data Analyst?

To learn more about Data Analyst with Advanced excel course – Enrol Now.
To learn more about Data Analyst with R Course – Enrol Now.
To learn more about Big Data Course – Enrol Now.

To learn more about Machine Learning Using Python and Spark – Enrol Now.
To learn more about Data Analyst with SAS Course – Enrol Now.
To learn more about Data Analyst with Apache Spark Course – Enrol Now.
To learn more about Data Analyst with Market Risk Analytics and Modelling Course – Enrol Now.

The Dark Data on Why Crime Against Women are on The Rise in India

India, a land known for its diversity, rich heritage, culture, colourful and flavoursome food, a never-ending list of occasions and holidays and the slightly recent addition of rape and other violent crimes against women!


The Dark Data on Why Crime Against Women are on The Rise in India


We though enraged by the death toll of Nibhayas’ in Delhi and the rest of the country are not here to write an infuriating open letter to the World Wide Web. When India’s daughter, the documentary made by a British film-maker made big news after its release on YouTube, the country’s protectors and ‘patriots’ jumped right in with a concoction of nicely cooked data showcasing how the rate of crime against women are similar in the UK as it is in India! But we as a data-friendly nation often forget the main utility of data analysis. Continue reading “The Dark Data on Why Crime Against Women are on The Rise in India”

A Deeper Look at Rajnikanth’s Movie Kabali from the Perspective of a Data Analyst

A Deeper Look at Rajnikanth’s Movie Kabali from the Perspective of a Data Analyst

As we can see from the above analytical assessment that while sultan needed the help of other factors like a special occasion such as Eid, Kabali’s success which is almost unmatchable to the success of Sultan needed no such push. The numbers suggest that Kabali was able to make a bigger splash in the overseas fan base Sultan was only able to rule its own country’s fan base.


These were simply the statistical reports on the comparison of the above mentioned two films done with the help of SAS. We in no intend to spark a war between the fan-bases of respective actors and respect both their talents in their own domain. Who’s to say who the real Sultan of Indian Film Industry is still a question too big for simple data folks to ascertain. May be you could help us find an answer to this unique analytical problem? Feel free to add your thoughts in the comments below. 


Interested in a career in Data Analyst?

To learn more about Data Analyst with Advanced excel course – click here.
To learn more about Data Analyst with SAS Course – click here.
To learn more about Data Analyst with R Course – click here.
To learn more about Big Data Course – click here.

The 1st Clinical Trial Predictive Model By Pfizer is Here

Joining the data analytics bandwagon, the pharmaceutical giant Pfizer has launched their first clinical trial predictive modelling system which is aimed at reducing study risk during protocol design and to better study execution phases. In a recent interview Jonathan Rowe, the Executive Director and Head of Clinical Development Quality Performance and Risk Management of Pfizer shed some light on these predictive modelling systems.


The 1st Clinical Trial Predictive Model By Pfizer is Here


When asked in the interview about the purpose of their predictive model and what it is meant to achieve, Rowe responded as follows…


It is true that there are quite a few models in the realm of GCP quality performance which we have developed and continue to refine. A relatively straightforward one is the correlation model where we correlate our clinical trial process performance to select the results of the GCP as is defined in the ICH E6. Continue reading “The 1st Clinical Trial Predictive Model By Pfizer is Here”

An Analysis of The Growing Popularity Of Pokémon Go

The virtual 8 bit Pokémon universe has now been unleashed into our HD smart phone screens which we carry with us everywhere. And there are players of this popular game walking around on their two feet with eyes glued to the mobile screen with the unrelenting thirst of catching them all! But why?! Why is this game of an almost forgotten popular cartoon show suddenly creating such an overwhelming hype? This craze of capturing all these digital monsters that have been placed in ones neighbourhood using the ingenious AR Technology, definitely a great time for game-lovers to be alive.


An Analysis of The Growing Popularity Of Pokémon Go


This game just released last Wednesday and has instantaneously become a growing global hit. This game has done the impossible, where the stereotypical imagery of computer nerds and gamers being over-weight or lazy and sitting around on their couches, have been transformed over-nightly into walkers around their parks, street corners and houses in search of these amusing virtual creatures. Even people who are older than the original fandom of the Pokémon series are now walking about to catch them all. The charm of augmented reality is such that it is sending the Android community in a frenzied treasure hunt like children. Continue reading “An Analysis of The Growing Popularity Of Pokémon Go”

The Beginners’ Guide to Data Science Jargon

The Beginners’ Guide to Data Science Jargon

Are you poised to join the ranks of c-suite data operatives working with the Big Word – Big Data? But before you set foot in the industry with the big players, you must train yourself how to talk the talk before you can walk the walk. Data science and analysis is a complex field as it is with mind-numbing numbers and lengthy algorithms and on top of that there is the jargon that is stranger than fiction in this field. So, to help you prepare your tongue right, here is our brief list of the most commonly used terminology in the data science industry. After you have the enlightenment of knowledge about these words, you will not need to be hesitant when hearing these words and silently think to yourself that, “This sounds data-related”.

Here is a list of data-related jargon to clear your doubts about from all over the Big Data spectrum:

Analytics: the process of drawing conclusions from raw information or data that is actionable. With the help of analysis raw data can be transformed into meaningful information that was otherwise useless to the company. The main emphasis of analytics remains on the inference rather than the systematic operations or even the software in use.


  • Predictive Analysis: after analysing the events that happened in the future and the historical data of a company or organization and then being able to make probable predictions about the company’s future. This may also involve proposing counteractive plans and strategies to prevent an incoming disaster or loss.
  • Descriptive Analysis: narrowing down or in other words boiling down huge numbers into small pieces of usable information. Instead of listing a lot of numbers and complex details these use a general narrative and thrust in the report. 


Prescriptive Analysis: this is the course of action that analytics personnel propose after landing upon a definite approach after days of analysis on a problem. Data is turned into actions and real world problems find solutions with the right decisions.


Algorithms: the mathematical formulas statistical procedures used to analyse data by analytical personnel. These are usually used in software processes and analyze any data that have been input.


Cloud: this is not the same stuff that the weather report talks about when speaking of an overcast day. But that being said, this cloud is also basically everywhere. This is the process of storing or accessing data, files and software over the World Wide Web, instead of the old system of hard drive storage.


R:  maybe not a very descriptive name for a programming language but nevertheless, this is a very commonly used programming language used in data science that uses statistical computing. This is also one of the easiest and most popularly used languages in data science.


SAS: Statistical Analysis System is a software suite developed by the SAS institute and is also a very commonly used data analysis language. It was developed in the North Carolina State University.


Machine Learning: a method considered equivalent to machine wizardry where data analysis is automated by teaching machines to use models, algorithms and other processes for analytics.  

2


Hadoop: better known as Apache Hadoop which is an open source software framework, it principally works by storing files and processing data, which is why it is still mostly used as a data warehousing system.


IoT: this is a proposed system wherein devices will be able to talk to each other. This is like a network of objects like, your phone, car, and smart wearables etc. which are embedded with network connectivity. The best examples are driverless vehicles.


These were the most commonly used data analytics jargon; for more such news and articles about data analytics stay hooked to daily uploads from Dexlab Analytics, creating an easier world with data backed decisions.


Interested in a career in Data Analyst?

To learn more about Data Analyst with Advanced excel course – Enrol Now.
To learn more about Data Analyst with R Course – Enrol Now.
To learn more about Big Data Course – Enrol Now.

To learn more about Machine Learning Using Python and Spark – Enrol Now.
To learn more about Data Analyst with SAS Course – Enrol Now.
To learn more about Data Analyst with Apache Spark Course – Enrol Now.
To learn more about Data Analyst with Market Risk Analytics and Modelling Course – Enrol Now.
Big Data is the New Obsession of Small Business Owners

Big Data is the New Obsession of Small Business Owners

While this may seem somewhat counterintuitive, but instead of large organizations, it is actually small business owners and midsize companies who tend to be more inclined towards the applications of Big Data. They are also the first to adopt these latest technological innovations of which analytics is no exception – as these internet and data based insights are highly accessible and also affordable for SMBs.

As per the researchers in the fields of technology, the entry level capabilities in such fields like analytics has abruptly dropped which is why almost all types of industries from an array of sectors are engaging with them to enhance their competitiveness; and the wheels have already started to roll when it comes to increasing overall global competitiveness. Continue reading “Big Data is the New Obsession of Small Business Owners”

Analysts’ Guide to Tableau Certification

Tableau helps data analysts to visually analyze your big data and is a great tool that helps to solve complex problems associated with data analytics. By data visualization we mean, describing information through visual rendering to gather immediate insight with the mind’s powerful and quick visual processing system.

Analysts’ Guide to Tableau Certification

To become a certified professional you must be a Qualified Associate in Tableau


Earlier Tableau used to offer certification for version 8 both Desktop and Server. But now Tableau has released version 9 certification exams. Thus, now you can no longer register for the version 8. If you are already certified in version 8 of Tableau and would now like to upgrade yourself, you can sit for the 9th version delta examination with the new features only. Continue reading “Analysts’ Guide to Tableau Certification”

Advertising Technology is Being Transformed with Big Data

Big Data is elemental these days and almost everything revolves around it, be it retail sales, technological developments or even movie-making and novels. But what about the most closely sector which has relied upon analytics since its very inception, advertising? Currently the whole advertising sector is having its commandments rewritten, driven by insights gathered from Big Data analytics.


However, the prevalent notion of the business coaches and market mentors are that big data can seem to be like Latin or Hebrew to the novice or companies using it for the first time. So, for the aspiring and ambitious youth it may be a good idea to learn some intuitive analytics tools and snippets to bank on this growing big data trend and make the most of the bandwagon effect that lures in all humans when it comes to making decisions. Continue reading “Advertising Technology is Being Transformed with Big Data”

Call us to know more