Dexlab, Author at DexLab Analytics | Big Data Hadoop SAS R Analytics Predictive Modeling & Excel VBA - Page 70 of 80

Latest Open Source Tools in Data Analytics Beyond Apache Spark

Latest Open Source Tools in Data Analytics Beyond Apache Spark

In the IT world change is always in the air, but especially in the realm of data analytics, profound change is coming up as open source tools are making a huge impact. Well you may already be familiar with most of the stars in the open source space like Hadoop and Spark. But with the growing demand for new analytical tools which will help to round up the data holistically within the analytical ecosystem. A noteworthy point about these tools is the fact that they can be customized to process streaming data.

With the emergence of the IoT (Internet of things) that is giving rise to numerous devices and sensors which will add to this stream of data production, this forms one of the key trends why we need more advanced data analytics tools. The use of streaming data analysis is used for enhanced drug discovery, and institutes like SETI and NASA are also collaborating with each other to analyze terabytes of data, that are highly complex and stream deep in space radio signals.

2

The Apache Hadoop Spark software has made several headlines in the realm of data analytics that allowed billions of development funds to be showered at it by IBM along with other companies. But along with the big players several small open source projects are also on the rise. Here are the latest few that grabbed our attention:

Apache Drill:

This open source analytics tool has had quite good impact on the analytics realm, so much so that companies like MapR have even included it into their Hadoop distribution systems. This project is a top-level one at Apache and is being leveraged along with the star Apache Spark in many streaming data analytics scenarios.

Like at the New York Apache Drill meeting in January this year, the engineers at MapR system showed how Apache Spark and Drill could be used in tandem in a use cases that involve packet capture and almost real-time search and query.

But Drill is not ideal for streaming data application because it is a distributed schema free SQL engine. People like IT personnel and developers can use Drill to interactively explore data in Hadoop and NoSQL databases for things such as HBase and MongoDB. There is no need to explicitly describe the schemas or maintain them because the Drill has the ability to automatically leverage the structure which is embedded in the data. It is capable of streaming the data in memory between operators and minimizes the use of disks unless you need to complete a query.

Grappa:

Both big and small organizations are constantly working on new ways to cull actionable insights from their data streaming in constantly. Most of them are working with data that are generated in clusters and are relying on commodity hardware. This puts a premium label on affordable data centric work processes. This will do wonders to enhance the functionality and performance of tools such as MapReduce and even Spark. With the open source project Grappa that helps to scale the data intensive applications on commodity clusters and will provide a new type of abstraction which will trump the existing distributed shared memory (DSM) systems.

Grappa is available for free on the GitHub under a BSD license. And to use Grappa one can refer to its quick start guide that is available readily on the README file to build and execute it on a cluster.

These were the latest open source data analytics tools of 2017. For more such interesting news on Big Data analytics and information about analytics training institute follow our daily uploads from DexLab Analytics.


Interested in a career in Data Analyst?

To learn more about Data Analyst with Advanced excel course – Enrol Now.
To learn more about Data Analyst with R Course – Enrol Now.
To learn more about Big Data Course – Enrol Now.

To learn more about Machine Learning Using Python and Spark – Enrol Now.
To learn more about Data Analyst with SAS Course – Enrol Now.
To learn more about Data Analyst with Apache Spark Course – Enrol Now.
To learn more about Data Analyst with Market Risk Analytics and Modelling Course – Enrol Now.
Here Are Your Reasons For Attending India Internet Day of Tie, Delhi-NCR

Around this time every year TiE of New Delhi hosts an important event which should be of interest to IT personnel around the country. The event is known as the India Internet Day, and they have been at it for the past couple of years. But as a data scientist hoping to make it big in the Big Data world with IT giants why should you expend your limited “Paid Leaves” (if you are employed) and attend this event?

 
Here Are Your Reasons For Attending India Internet Day of Tie, Delhi-NCR
 

Let DexLab Analytics explain to you why is it necessary for aspiring Data Scientists/Analysts to attend this event:


Get the necessary nudge towards your start-up success!

In India the TiE event of India Internet Day is one of the most happening events for Start-ups, held in Delhi-NCR and North Region. Continue reading “Here Are Your Reasons For Attending India Internet Day of Tie, Delhi-NCR”

Secrets To Clinch Victory in Global Data Science Competitions

Data scientists are often perceived as crazy IT nerds who would use formulas and algorithms to even determine how many teaspoons of sugar to put in their tea! Well, we would not argue about this, as much as stereotypical this may sound, but a data scientist feels a rush when he solves a problem with calculations, analysis and logic; a rush that incomparable to anything else.

 
Secrets To Clinch Victory in Global Data Science Competitions


Just as an avid gamer who plays COD (Call of Duty) or CS (Counter Strike) waits for WCG (World Cyber Games). A data analyst waits for – Datahack. People who are just crazy about machine learning wait for the whole year to participate in Datahack. For them this is Olympics of Data Analysis. Continue reading “Secrets To Clinch Victory in Global Data Science Competitions”

Prepare For Your Data Science Job Interview With Answers to These Puzzles

Prepare For Your Data Science Job Interview With Answers to These Puzzles

You may have passed your data science certification course with flying colours, but getting your first break in an analytical job role can be quite difficult. Did you know that more than 30 percent of top tier analytical firms evaluate and select their candidates on their ability to solving puzzles? After all this is the best way to determine that they are logical, with ample creative thinking abilities and are definitely pros at dealing with numbers (a skill must have for data personnel).

The companies are keen on hiring people who have the ability to bring a unique perspective in solving business problems. Such individuals are capable of to offer their hiring firms with a huge advantage over other candidates. But to garner such capabilities an individual must practice regularly with consistent efforts.

As fellow data analysts, we recommend that you develop a daily habit of solving puzzles. They are mental exercises which on disciplined training will help you to get better with time. When employed in a job role that involves having to deal with complex problems everyday such a skill will prove to be an asset.

Are you ready to work out your grey matter cells? Here are the most common puzzles asked at interviews for data science positions:

These questions have been asked to candidates at companies like Amazon, Google, Goldman Sachs, and JP Morgan etc.

Note: Try solving these problems on your own before checking the solution, and feel free to share your logic behind the solutions in the comments below. We are all ears eyes to see how unique someone’s mind can be!

Puzzle #1:

Blind game challenge:

You have been placed in a dark room, there is a table kept in the room. The table has 50 coins atop its surface, out of these 50 coins 10 coins have their tails side up and 40 coins have their heads side up. Your task is to divide this set of 50 coins into 2 groups (not necessarily of equal size) so that both the groups have equal numbers of coins with the tails side up.

Solution #1:

The coins should be divided into two groups one with 40 coins and one with 10 coins, then flip all the coins in the group with 10 coins.

Puzzle #2:

Bag of coins problem:

You have been given 10 bags full of coins; each bag comes with an infinite number of coins. But there is a twist, one of the bags is full of forged coins but sadly you do not remember which one it is. But you do know that the weight of the real coins are 1 gram and those which are forged are 1.1 gram. Your task is to identify the bags in minimum readings with a digital weighing machine that has been provided with you.

2

Solutions #2:

You need to take 1 coin from the first bag, 2 coins from the second bag, and 3 coins from the third bag and so on and so forth. Eventually you will end up with 55 coins in total (1+2+3+4+…10). The next step is to weigh all the 55 coins together. You can identify which bag has the forged coins based on the final reading of the weighing machine. For instance, if the reading ends with 0.4 then it is the fourth bag with forged coins. And if it comes 0.7 then it is the 7th bag with the forgeries.

Puzzle #3:

The Sand timer trouble:

You have two hourglasses or sand timers one of which can show 4 minutes and the next one can show 7 minutes respectively. Your job is to use both the sand times (either one at a time or simultaneously or in any other combination) and measure a time of 9 minutes.

Solution #3:

Step 1: start the 7 minute sand timer along with the 4 minute sand timer

Step 2: when the 4 minute sand timer ends turn it upside down instantaneously

Step 3: when the 7 minute sand time ends also turn it down at that instant

Step 4: when the 4 minute sand timer ends turn the 7 minute sand timer upside down and it will have 1 minute worth of sand in it

Thus, effectively 8 + 1 = 9

In closing thoughts:

Hope these questions were enough to get your brain rolling, while a lot of these questions may seem challenging to most of the people, but with a little out-of-the-box analytical thinking you will soon discover that they are not too difficult to solve.

If these questions were simple enough for you, we have plenty more with increasing difficulty. And if all these brain picking has left you overwhelmed to the peak and all you want is to solve real-world data problems, then follow our regular social media uploads advertising latest job openings in the field of data science.

DexLab Analytics is a premier data science training institute in Gurgaon that offers program centric courses. Their online certification course on data science is stellar, come check out the course itinerary now.

DexLab Analytics Presents #BigDataIngestion

DexLab Analytics has started a new admission drive for prospective students interested in big data and data science certification. Enroll in #BigDataIngestion and enjoy 10% off on in-demand courses, including data science, machine learning, hadoop and business analytics.


Interested in a career in Data Analyst?

To learn more about Data Analyst with Advanced excel course – Enrol Now.
To learn more about Data Analyst with R Course – Enrol Now.
To learn more about Big Data Course – Enrol Now.

To learn more about Machine Learning Using Python and Spark – Enrol Now.
To learn more about Data Analyst with SAS Course – Enrol Now.
To learn more about Data Analyst with Apache Spark Course – Enrol Now.
To learn more about Data Analyst with Market Risk Analytics and Modelling Course – Enrol Now.

Understanding Time Series Method of Forecasting

The dictionary meaning of the word forecasting is to estimate what could possibly be the future outcomes within a business or operation. But when it comes to the sector of data analysis this method is used for translating the past data or experiences into future possible outcomes. This is a highly useful analytics tool that helps any company management to cope with uncertainty of the future. For both short term and long term decisions forecasts are highly important.

 
Understanding Time Series Method of Forecasting
 

Forecasting can be used by businesses in several areas, which may include: economic forecasts, technological forecasts, and also demand forecasts. Forecasting techniques can be classified into 2 broad techniques: quantitative analysis (objective approach) and qualitative analysis (subjective approach). For the quantitative method of forecasting technique an analysis of historical data is conducted and the past patterns in data are assumed to predict future data points. While on the other hand in the qualitative forecasting technique, the judgment of experts is employed in the specific field to generate probable forecasts.  These are mostly educated guesses or opinions of experts in that specific area of expertise. Continue reading “Understanding Time Series Method of Forecasting”

The Best Analytics Tools for Business And How to Make The Most of Them

The Best Analytics Tools for Business And How to Make The Most of Them

All companies are awash with useable data about their customers, prospects and internal business operations as well as suppliers and partners. But most of them are also ill-equipped with the requisite understanding to leverage this streaming flood of data and cannot convert it to actionable insights to increase their revenue by growing their revenue thus, increasing their efficiency. Business intelligence tools are technology that allows businesses to transform their data into actions for generating better business.

The Business Intelligence and analytics industry has been around for decades now and is considered by most analytics personnel as a mature industry. But this BI market is never static with constant evolution and innovation to prepare for meeting the ever expanding needs of businesses of all sizes and from a diverse range of industries. So, it is imperative that people gather an understanding of the different Business Analytics tools for better operation of their companies.

2

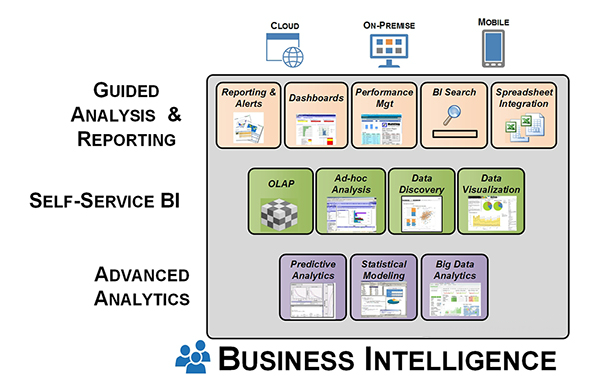
Business Intelligence tools can be categorised in three different groups:

  • Guided analysis and reporting
  • Self-service Business Intelligence and Analysis
  • Advanced Analytics

The first category of guided analysis and reporting includes Business Intelligence tools of traditional styles that have long been used for years to perform recurrent data analyses of specified data groups. This system of data analysis was only used for predefined static reporting several years ago, but today it is possible for data analysts to select, compare, visualize and analyse data using various tools and features.

Tool styles in this category include the following:

  • Reports
  • Scorecards and dashboards
  • Spreadsheet integration
  • BI Search
  • Corporate Performance Management

The second category of BI tools which falls under the category of self-service BI and analysis includes the tools BI users utilize to make ad hoc analysis of data. Such analytical practices may be a one-time analysis or building of a recurring analytical system that may with shared by others.

Usually the users of such Bi tools have a dual role to play – consumer of information and producer of analytical systems. They usually share or publish their BI application which they build with the self-service BI tool. The users of such tools will always have the term analyst in their job title. Staff members of the management department may also make use of such tools when they need to perform similar tasks as that of a business analyst, for their peers even if their job title does not imply that.

The Business Intelligence tools include in this category includes the following:

  • Ad hoc analyses and reporting
  • OLAP cubes i.e. online analytical processing
  • Data visualization
  • Data discovery

The third category of advanced analytics includes the tools that a data scientist uses to build predictive and prescriptive models of analysis. These are tools for predictive modelling, statistical modelling and data mining along with rigorous use of big data analytics software. In these cases data analyst spend a huge chunk of their time performing tasks like data ingestion, cleansing and integration.

To understand the full spectrum of different Business Intelligence tool classes here is a visual explanation:

dexlab

Who should invest in BI tools?

For a long time now investment and use of BI tools has been growing gradually regardless of the economic conditions. And it has especially accelerated in the recent times as companies crave for data for better growth and more organized operations. While data analytics tools were mainly associated with large enterprises due to their cost, complexity and demand of high skilled personnel, but those factors have now been grossly transformed as more and more SMBs (small and medium sized businesses) now being significant customers of BI tools and software.

Now that you have a good understanding of the different tool categories and how they should be deployed, the next step for you is to understand your  company specific needs and make the best use of these tools that are optimized for so.


Interested in a career in Data Analyst?

To learn more about Data Analyst with Advanced excel course – Enrol Now.
To learn more about Data Analyst with R Course – Enrol Now.
To learn more about Big Data Course – Enrol Now.

To learn more about Machine Learning Using Python and Spark – Enrol Now.
To learn more about Data Analyst with SAS Course – Enrol Now.
To learn more about Data Analyst with Apache Spark Course – Enrol Now.
To learn more about Data Analyst with Market Risk Analytics and Modelling Course – Enrol Now.
India Will Lead in Analytics Services:

Today is a time when each day is witnessing the field of analytics gets more and more pervasive. It is helping other fields and sectors to achieve more. At a time like this our nation is expected to maintain its ground over other major offshore destinations such as Philippines, China, Eastern Europe and Latin America as per a recent survey.


A host of factors will drive the demand for this service from India. They are – availability of talent pool, industry maturity and a wide spectrum of services which was reported by the survey that was conducted by Avendus Capital which is a financial services company. Continue reading “India Will Lead in Analytics Services:”

Olympics Spoiler Alert: We Predicted The Outcomes Of Rio Olympics

Being a part of the data awakened generation we acknowledge that data analytics and predictions form an integral part of everything we do. From sole trade predictions to outcomes of famous movie releases to results of sporting events, big data analytics is now the wizardry of obtaining the answers to questions that are still unasked.


Rio Olympics 2016


Recently following the ongoing trends, the company Gracenote which is the world’s leading provider of entertainment data and is a subsidiary of the Tribune Media Company claimed that they have made accurate predictions of the Rio Olympics outcomes. So, following Gracenote we have also used our sports data analytics expertise to predict which countries and athletes will step up and do well at the 2016 Summer Olympics Games. Continue reading “Olympics Spoiler Alert: We Predicted The Outcomes Of Rio Olympics”

Understanding the Difference Between Factor and Cluster Analysis

Understanding the Difference Between Factor and Cluster Analysis

Cluster analysis and factor analysis are two different statistical methods in data analytics which are used heavily in analytical methods of subjects like natural sciences and behavioural sciences. The names of these analytical methods are so because both these methods allow the users to divide the data into either clusters or into factors.

Most newly established data analysts have this common confusion that both these methods are almost similar. But while these two methods may look similar on the surface but they differ in several ways including their applications and objectives.

Difference in objectives between cluster analysis and factor analysis:

One key difference between cluster analysis and factor analysis is the fact that they have distinguished objectives. For factor analysis the usual objective is to explain the correlation with a data set and understand how the variables relate to each other. But on the other hand the objective of cluster analysis is to address the heterogeneity in the individual data sets.

Put in simpler words the spirit of cluster analysis is to help in categorization but that of factor analysis are a form of simplification.

Data Science Machine Learning Certification

Difference is solutions:

This is not an easy section for drawing a line of separation in between cluster and factor analysis. That is because the results or solutions obtainable from both these analysis is subjective to their application. But still one could say that with factor analysis provides in a way the ‘best’ solutions to the researcher. This best solution is in the sense that the researcher can optimize a certain aspect of the solution this is known as orthogonality which offers ease of interpretation for the analysts.

But in case of cluster analysis this is not the case. The reasons behind that being all algorithms which can yield the best solutions for cluster analysis are usually computationally incompetent. Thus, researchers cannot trust this method of cluster analysis as it does not guarantee an optimal solution.

Difference in applications:

Cluster analysis and factor analysis differ in how they are applied to data, especially when it comes to applying them to real data. This is because factor analysis can reduce the unwieldy variables sets and boil them down to a smaller set of factors. This makes it suitable for simplifying otherwise complex models of analysis. Moreover, factor analysis also comes with a sort of confirmatory use researchers can use this method to develop a set of hypotheses based on how the variables in the data set are related.  After that the researcher can run a factor analysis to further confirm these hypotheses.

But cluster analysis on the other hand is suitable only for categorizing objects as per certain predetermined criteria. In cluster analysis a researcher can measure selected aspects of say a group of newly discovered plants and then place these plants into categories of species grouped by employing cluster analysis.

Here is an infographic to better explain the difference between cluster analysis and factor analysis: 


Interested in a career in Data Analyst?

To learn more about Data Analyst with Advanced excel course – Enrol Now.
To learn more about Data Analyst with R Course – Enrol Now.
To learn more about Big Data Course – Enrol Now.

To learn more about Machine Learning Using Python and Spark – Enrol Now.
To learn more about Data Analyst with SAS Course – Enrol Now.
To learn more about Data Analyst with Apache Spark Course – Enrol Now.
To learn more about Data Analyst with Market Risk Analytics and Modelling Course – Enrol Now.

Call us to know more