Dexlab, Author at DexLab Analytics | Big Data Hadoop SAS R Analytics Predictive Modeling & Excel VBA - Page 69 of 80

Are you keeping up with R? Here are a few free PDFs and online resources

Chances are if you found your way into this blog, then you are very well familiar with R programming, it is an open-source statistical and data mining programming language. Though a relatively new id around the block it is slowly catching up to its other commercial counterparts like those of SAS and SPSS. Many data analyst even believe that R programming will eventually replace other paid languages that are currently of choice for data analysts for modelling purposes.


Are you keeping up with R?  Here are a few free PDFs and online resources


Why so?


The main reason we believe is solely for commercial purposes. Many organizations are already questioning the massive amount of annual cost of other commercially available data analytics tools for their statement in the P&L statements. Furthermore this ongoing trend has escalated with the presence of R as a free and feasible replacement. Continue reading “Are you keeping up with R? Here are a few free PDFs and online resources”

The Journey of Iphone Battery Life With Data

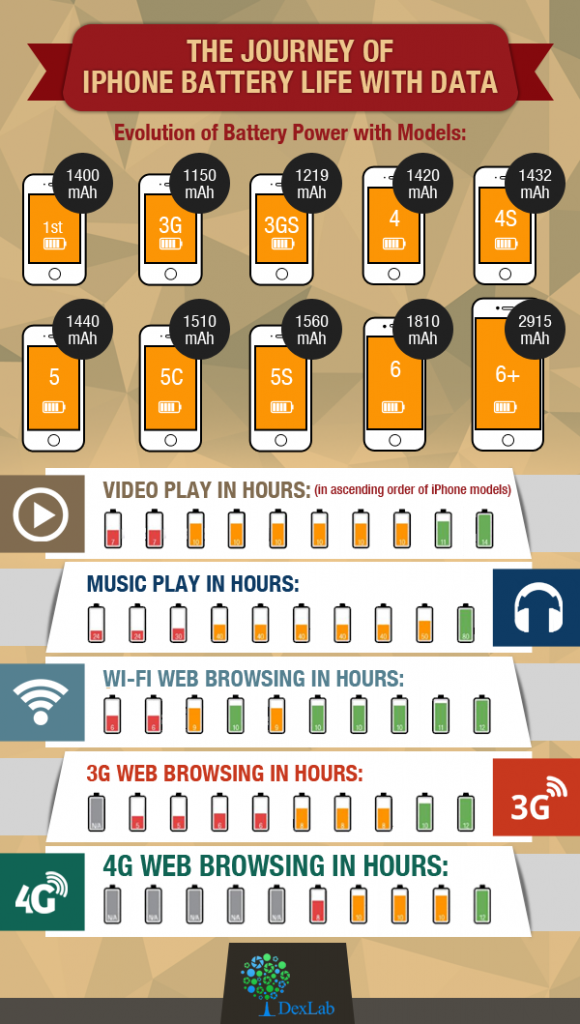
The Journey of Iphone Battery Life With Data


iPhones have become synonymous with innovation, technology and luxury soon after their iconic release by the former CEO of Apple Inc. Steve Jobs. People all over the worlds have been caught in the hype of making the big switch from android phones known for their economic price points and customization to the feel the premium quality usability of an iPhone. Continue reading “The Journey of Iphone Battery Life With Data”

5 Analytics Tools To Improve Your Business Decisions

5 Analytics Tools To Improve Your Business Decisions

Big Data has proved to be inevitable for business organisations in the quest for stepping ahead of their competitors. Nevertheless, only having Big Data at hand does not solve problems. You also need the availability of efficient analytics software that can put your data to the best use.

A business analytics tool is responsible for analysing massive amounts of data in order to extract valuable information. Such information in turn, can be used for improving operational efficiency and for taking better decisions.

2

So, let us here go through the top 10 data analytics tools available in the market.

  • Yellowfin BI

Yellowfin Business Intelligence (BI) is a reporting, dashboard and data analysis software. The software is able to conduct analysis of huge amounts of database, in order to figure out appropriate information. With Yellowfin, your dashboard can be easily accessible from everywhere including company intranet, mobile device or web page.

  • Business Intelligence & Reporting Tools (BIRT)

BIRT is open source software programmed for JAVA and JAVA EE platforms. It consists of a runtime component and a visual report designer, which can be used for creating reports, visual data, and charts and so on. Information gathered from this software can be used for tracking historical data and analysing it and as well as for monitoring ongoing developments in various fields. BIRT can also be used for real-time decision-making purposes.

  • Clear Analytics

Clear Analytics is quite easy to manage as the software is based on Excel spreadsheets. While the software allows you to continue managing data using Excel, it also adds some extra features like reports scheduling, administrative capabilities, version control, governance etc. for better decision making. In short, Clear Analytics can be your choice in case you want high-end performance in exchange of minimal effort.

  • Tableau

Tableau is BI software that provides insight into the data that a business organisation requires for connecting the dots, in order to make clear and effective decisions. Data visualisation in Tableau is much dynamic and elaborative as compared to the other programmes available. Besides, it also provides easier access to data given its extended mobile device support. Additionally, the costs of implementing this program as well as its upgrade are relatively low.

  • GoodData

GoodData is a service BI platform. It takes into account both internal and external datasets (cloud) of an organisation to analyse and provide better governance. The platform is programmed for managing data security and governance thereby, consequently providing the user with the desired results. The most important feature of this platform is that it can analyse datasets of any size, thus making it effective for its users. Recently, the company rebranded their software as an Open Analytics platform.

These are some of the major analytics tools used by organisations irrespective of their scale in order to enhance their business intelligence. Whether you are looking to enhance your career or take better business decisions, a Data analyst certification course can help you to achieve such objectives. Data Analysis helps you to track the competitive landscape and figure out the essentials that needs to be done, in order to get ahead of your competitors. If you are a manager, you can take precise decisions based on quantitative data. Since big data is potential of driving your success, it is your job to master the science and use it for your advantage.


Interested in a career in Data Analyst?

To learn more about Data Analyst with Advanced excel course – Enrol Now.
To learn more about Data Analyst with R Course – Enrol Now.
To learn more about Big Data Course – Enrol Now.

To learn more about Machine Learning Using Python and Spark – Enrol Now.
To learn more about Data Analyst with SAS Course – Enrol Now.
To learn more about Data Analyst with Apache Spark Course – Enrol Now.
To learn more about Data Analyst with Market Risk Analytics and Modelling Course – Enrol Now.
Know The Answer To These Interview Questions To Get A Job As Data Analyst

List of Interview Questions for Data Analysts

With this Data analyst interview guide you will know what to expect in an interview round for a position of data analyst.

A good data analyst or scientist must be capable of drawing actionable insights from the data that a company generates. They must possess a good sense of what data they must collect and should have a solid process for carrying it out effectively using processes of data analysis and building predictive models.

A data analyst must possess a strong foundation in the following topics: operations research, statistics, machine learning along with some database skills, such as SQL or SAS in order to clean, retrieve and process the data from different sources. One can lead to this role from different pathways thus candidates can expect to be bombarded with questions relevant to statistics ort mathematics and even computer programming or engineering.

Data scientists are also often required to script programs using R or Python or Matlab and the role will typically not place emphasis on the programming skills or practices and the general software engineering skills which is necessary for working with production quality software.

Here is a list of common data analyst interview questions:

Operational questions:

  1.  Describe the steps that you follow when creating a design a data-driven model to manage a business problem. For example you may try and automatically classify customer support mails, by either sentiment or topic. Another task may be to predict a company’s employee churn.
  2. What models would you classify as simple models and which are the ones that are complex according to you? What are the comparative strengths and weaknesses of choosing a more complex model over a simplistic one?
  3. What are the possible ways in which you can combine models to create an ensemble model and what are the main advantages of doing this?
  4. Tell us about certain pre-processing steps that you may carry out on data before using them to train a model and describe the conditions under which they may be applied.

Role specific questions:

About basic ideas in probability, statistics and machine learning:

  1. Define what is confidence interval and why do you think it is useful?
  2. What is the main difference between correlation and independence?
  3. What is Bayes Theorem? What is conditional probability? What is its use in practice?
  4. When and how do you understand that you have collected ample data for building a model?
  5. Tell us the difference between classification and regression.

Hope this list of common data science interview questions will prepare you for a job at a reputable data analysis company. For more such data science news, tutorials and articles with emphasis on programming and analytics view our regular updates from DexLab Analytics.


Interested in a career in Data Analyst?

To learn more about Data Analyst with Advanced excel course – Enrol Now.
To learn more about Data Analyst with R Course – Enrol Now.
To learn more about Big Data Course – Enrol Now.

To learn more about Machine Learning Using Python and Spark – Enrol Now.
To learn more about Data Analyst with SAS Course – Enrol Now.
To learn more about Data Analyst with Apache Spark Course – Enrol Now.
To learn more about Data Analyst with Market Risk Analytics and Modelling Course – Enrol Now.

Big Data Analytics Is Helping To Curb Cancer For More Than 40 Years Now

The times now are such that we can name at least one of our friends, relatives or peers who have fought the dreadful battle with cancer. But luckily for us there are several people who along with their loved ones have not only fought this battle with courage but have triumphed to achieve sweet survival. But such glorious accomplishments would not have occurred if it were 40 years ago.

 
Big Data Analytics Is Helping To Curb Cancer For More Than 40 Years Now


As per the reports, adults who were diagnosed with cancer back in 1975 only had a lowly 50/50 chance of survival after five years of being diagnosed. But today the relative five year after rate of survival across all types of cancer is as close as 70 percent. And for better, the cancer survival rate during the same time frame for child cancer patients within five years of diagnosis has improved from the previously existing 62 percent to 81 percent, which is a steep rise. Continue reading “Big Data Analytics Is Helping To Curb Cancer For More Than 40 Years Now”

Here is The Data Why We Think Iphone 7 is Going to Be a Huge Hit

While the media and the tech analysts think that they have got the iPhone 7 all figured out and presume that the iPhone 7 sales will not be much as it is not offering much of an improvement from the previously launched iPhone 6S. But we have taken a look at the data and have a theory that tells a different story. Why?


We think that iPhone 7 is going to be a massive hit because Apple Inc. Is installing its largest ever iPhone user base which is more than two years old.


Here is chart that depicts how many people upgrade their phones to the latest model soon after its launch. We discovered that the switch is highly dependent on the fact of how old their previous phones were. Surprisingly only 17 percent of the people change their phones immediately after the launch of a new one. The people who change their phones immediately after the launch of a new release is the lot with “the next gen phone + 1” or people with phones that are two years or older!  


Refer to the infographic below to understand the iPhone switching factor:

Continue reading “Here is The Data Why We Think Iphone 7 is Going to Be a Huge Hit”

Now Easily Uncover Patterns in Your Data With Tableau 10’s Clustering Feature

Let us assume you have got sales data in your hands, wouldn’t it be absolutely grand to be able to recognize certain customer groups to be able to develop targeted marketing programs? It could also be that you are in healthcare and you’d love to identify patients who have had similar symptoms to determine the effectiveness of treatments.

Now Easily Uncover Patterns in Your Data With Tableau 10’s Clustering Feature

With complex data these questions can be very difficult to answer, even when people have distinct and well-separated groups. Additionally, sometimes data is distributed in such a way that it contains no obvious gaps which can help us distinguish between groups with simple inspection. Continue reading “Now Easily Uncover Patterns in Your Data With Tableau 10’s Clustering Feature”

Tell Your Kids To Be a Data Scientist Instead of a Doctor/Lawyer/Banker!

Back in the days of yore, parents would tell their kids that if you do not eat your veggies or study hard then your friends will be doctors, lawyers and bankers and you would have to cut grass!


Tell Your Kids To Be a Data Scientist Instead of a Doctor/Lawyer/Banker!


My parents also told me to work hard and get good grades so that one day I become a successful doctor/engineer! But now times have changed and while the definition of true success may differ from one person to another. The title of a truly successful professional surely has seen a paradigm shift. Continue reading “Tell Your Kids To Be a Data Scientist Instead of a Doctor/Lawyer/Banker!”

Are You Trying to Ace Your Tableau Interview?

Are You Trying to Ace Your Tableau Interview?

If you are looking to be hired as Tableau expert then you must be acquainted with these common interview questions and answers. These questions have been collected by the experts at DexLab Analytics who offer Tableau BI Certification training at the institute. These questions are to give you an idea of the types of questions you may be asked at an interview. Happy job hunting!

What do you understand by Data Visualization?

Data visualization is a much advanced, precise and ordered way of viewing large volumes of data. It is the way one visually represents data into graphs, charts and other illustrative aids, especially when you cannot define them textually. Through the various software applications like Tableau one can show various trends, patterns, correlations etc.

What are the main differences between a Tableau desktop and a Tableau server?

In Tableau desktop one can create workbooks for data visualizations but Tableau Servers are used to distribute the interactive workbooks or/and reports to the target audience. Users of Tableau servers can also edit and update workbooks and dashboards online on the Server but they cannot create new workbooks.

But there are limited options for editing in server as compared to desktop.

2

Differentiate between filters and parameters in Tableau.

The differences in these two features actually lie in their applications. With parameters one can allow users to insert their values, which can be integers, dates, floats, string these can be used for calculation purposes. But in filters one can only receive values which the user chooses to ‘filter by’ in the list, this cannot be used to perform calculations.

In them users can change the measures and dimensions in case of parameters but for filters this feature is not approved.

Are you interested in a Tableau training course we can help you get a head start in this much coveted career. Simply view our course details at Dexlab Analytics.

Why should you choose to learn Tableau? This infograph may help you decide better:

Are You Trying to Ace Your Tableau Interview? from Infographics


Interested in a career in Data Analyst?

To learn more about Data Analyst with Advanced excel course – Enrol Now.
To learn more about Data Analyst with R Course – Enrol Now.
To learn more about Big Data Course – Enrol Now.

To learn more about Machine Learning Using Python and Spark – Enrol Now.
To learn more about Data Analyst with SAS Course – Enrol Now.
To learn more about Data Analyst with Apache Spark Course – Enrol Now.
To learn more about Data Analyst with Market Risk Analytics and Modelling Course – Enrol Now.

Call us to know more