In this Excel tutorial, we at DexLab Analytics will dig a little deeper with our Excel knowledge and explain how to use the Excel AND function with proper examples, and syntax use.
What is the AND function?
The MS Excel AND function works to return TRUE if all the conditions are true. And it returns FALSE if any of the conditions are false. The AND function is an internal function in Excel that is categorized as a Logical Function. It can be utilised as a Work Sheet (WS) function in Excel. Moreover, as a worksheet function, the AND function may as well be included as a part of a formula in a normal excel cell of a worksheet.
Within the past few decades, the banking institutions have collected plenty of data in order to describe the default behaviour of their clientele. Good examples of them are historical data about a person’s date of birth, their income, gender, status of employment etc. the whole of this data has all been nicely stored into several huge databases or data warehouses (for e.g. relational).
And on top of all this, the banks have accumulated several business experiences about their crediting products. For instance, a lot of credit experts have done a pretty swell job at discriminating between low risk and high risk mortgages with the use of their business mortgages, thereby making use of their business expertise only. It is now the goal of all credit scoring to conduct a detailed analysis of both the sources of data into a more detailed perspective with then come up with a statistically based decision model, which allows to score future credit applications and then ultimately make a decision about which ones to accept and which to reject.
With the surfacing of Big Data it has created both chances as well as challenges to conduct credit scoring. Big Data is often categorised in terms of its four Vs viz: Variety, Velocity, Volume, and Veracity. To further illustrate this, let us in short focus into some key sources or processes, which will generate Big Data.
The traditional sources of Big Data are usually large scale transactional enterprise systems like OLTP (online Transactional Processing), ERP (Enterprise Resource Processing) and CRM (Customer Relationship Management) applications. The classical credit is generally constructed using the data extracted from these traditional transactional systems.
However, the online graphing is more recent example. Simply think about the all the major social media networks like, Weibo, Wechat, Facebook, Twitter etc. All of these networks together capture the information about close to two billion people relating to their friends preferences and their other behaviours, thereby leaving behind a huge trail of digital footprint in the form of data.
Also think about the IoT (the internet of things) or the emergence of the sensor enable ecosystems which is going to link the various objects (for e.g. cars, homes etc) with each other as well as with other humans. And finally, we get to see a more and more transparent or public data such as the data about weather, maps, traffic and the macro-economy. It is a clear indication that all of these new sources of generating data will offer a tremendous potential for building better credit scoring models.
The main challenges:
The above mentioned data generating processes can all be categorised in terms of their sheer volume of the data which is being created. Thus, it is evident that this poses to be a serious challenge in order to set up a scalable storage architecture which when combined with a distributed approach to manipulate data and query will be difficult.
Big Data also comes with a lot of variety or in several other formats. The traditional data or the structured data, such as customer name, their birth date etc are usually more and more complementary with unstructured data such as images, tweets, emails, sensor data, Facebook pages, GPS data etc. While the former may be easily stored in traditional databases, the latter needs to be accommodated with the use of appropriate database technology thus, facilitating the storage, querying and manipulation of each of these types of unstructured data. Also it requires a lot of effort since it is thought to be that at least 80 percent of all data in unstructured.
The speed at which data is generated is the velocity factor and it is at that perfect speed that it must be analysed and stored. You can imagine the streaming applications like on-line trading platforms, SMS messages, YouTube, about the credit card swipes and other phone calls, these are all examples of high velocity data and form an important concern.
Veracity which is the quality or trustworthiness of the data, is yet another factor that needs to be considered. However, sadly more data does not automatically indicate better data, so the quality of data being generated must be monitored closely and guaranteed.
So, in closing thoughts as the velocity, veracity, volume, and variety keeps growing, so will the new opportunities to build better credit scoring models.
To learn more about Data Analyst with Advanced excel course – Enrol Now. To learn more about Data Analyst with R Course – Enrol Now. To learn more about Big Data Course – Enrol Now.
To learn more about Machine Learning Using Python and Spark – Enrol Now. To learn more about Data Analyst with SAS Course – Enrol Now. To learn more about Data Analyst with Apache Spark Course – Enrol Now. To learn more about Data Analyst with Market Risk Analytics and Modelling Course – Enrol Now.
Microsoft launched its Power BI tool quite some time ago now, and the way things seem to advance is pretty amazing to say the least. This is a great Business Intelligence and analytics tool and it seems it is only a matter of time before the Power BI becomes the tool of choice for Business Intelligence and analytical works in almost all of the foresighted corporations.
This is a powerful BI tool now available in the hands of enterprises, who are looking to extract data from multiple disparate sources in order to derive meaningful insights from it. The tool offers unprecedented interactive visualization opportunities along with true self-servicing analytical capacities.
With all of these it helps the whole look of the same data to appear from varying angles and also allows the reports and dashboards to be made by anybody within the organization without assistance from IT administrators and developers.
The international analytics and BI market is to reach the mark of USD 16.9 Billion in 2016 says Gartner!
Power BI is leading the way in cloud business analytics and intelligence. It offers the services, which can directly be harnessed from the cloud, and it is a huge advantage when it comes to how BI can be utilized. The desktop version of power BI is also available and is known as the Power BI desktop.
The entire range of ordinary tasks can be performed with this Power BI like – data discovery, data preparation, designing of the interactive dashboards. Microsoft also went a step ahead by putting up the embedded version of Power BI in its highly revered Azure cloud platform.
The company already has a pretty good presence in the analytics environment with its popular products like SSAS – SQL Server Analysis Service. However, it did not have any strong presence in the BI delivery system and OLAP segment i.e. Online Analytical Processing.
Excel for a long time has been Microsoft’s attempt at being a presentation layer for its data analysis tools. However, Excel has a lot of disadvantages like limited memory, integrity issues with data which are the main reasons why it is often not very appealing to the corporate clients who want something more malleable for business analytics.
However, a really powerful BI tool is what takes Excel to a great new level; it helps to offer a whole new experience to working with tools like Power Query for data extraction and its transformation. The Power Pivot tool which, is deployed for data analysis and modelling and lastly, the Power View which, is used to map the data and visualize it distinctly in unprecedented ways. With Power Bi one can put all of these tools into a consolidated manner and will make it easier to work without having to depend on to MS Office solely.
In closing thoughts, thus, it is safe to say that Power Bi is putting the right use of power in the right hands of the customers. so, a power BI training can be a good decision for one’s career at this point, for those who consider themselves as a forward-thinking IT professional.
We have some intriguing news, The Ultimate CMO Challenge from the Delhi School of Economics, University of Delhi is being held and we are sponsoring the event. Participate at the Ultimate CMO Challenge if you a PG student or are pursuing a course in MBA.
The first round will be an online round where participants would have to submit their solutions online. Problem case will be sent to the teams that have registered for the challenge, the solution to be submitted should be of 6 slides except the cover slides. One can mail their solutions to cmo.atharva@mibdu.org
Recently, a discussion was held, which invited data scientists and analysts all over the world, to take part in the Science of Super Bowl discussion panel, this discussion was held by Newswise.
We found one notable discussion topic, which answered three very important questions related to data science that the sports industry could use:
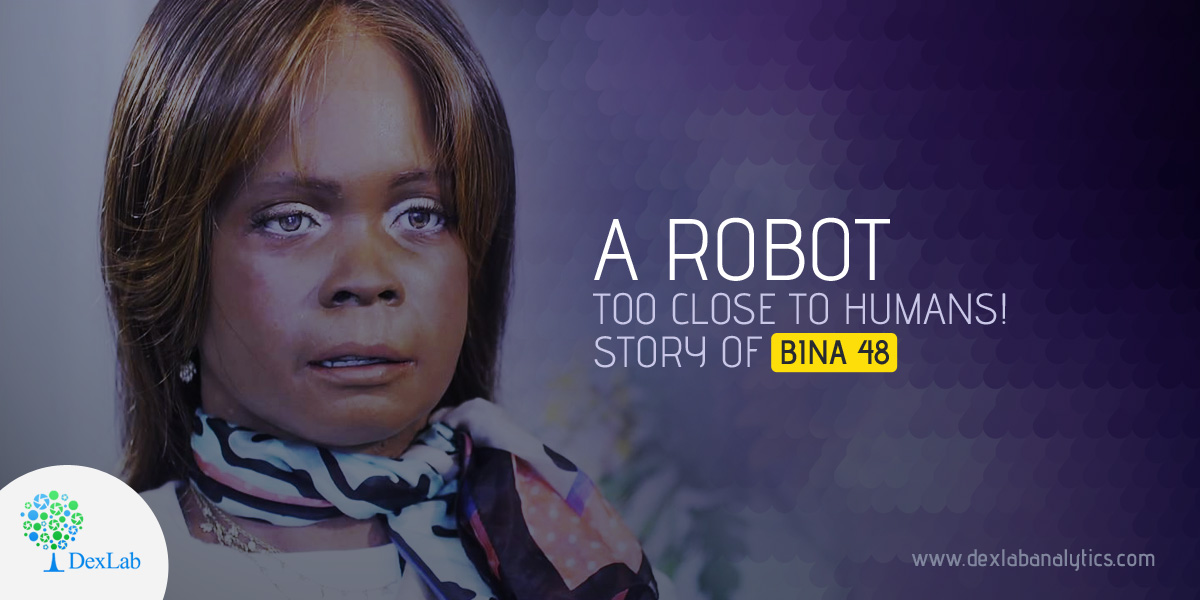
BINA 48 is the world’s most renowned and highly sought after humanoid robot in America. You can visit her there, by driving down a long winding dirt road just west of the Lincoln Gap in Bristol, Vt. Where sits two large yellow houses on a sprawling property that features ten solar panels and a dock over-looking the sunlit pond filled with trout, a homely porch decorated with rocking chairs.
In the smaller of the two houses resides BINA 48, who is one of the most sought after humanoid who is based on a real personality – Bina Rothblatt.
Viacom the owner of household brands such as Comedy Central, Nickelodeon and MTV, is one of the largest media companies in the world, delivering more than 170 cable, broadcast and online networks in around 160 countries.
Monitoring of the digital networks, which are used to pump their content into millions of homes, gives them access to a huge amount of data, on how both their systems and their audiences behave.
To plug tax loopholes, the income tax (IT) department will use Big Data analytics to track tax evaders by collecting financial information about them, such as – common address, mobile number and e-mail to establish relationships between their multiple PANs. The department with support from various private firms will analyse the voluminous big data available post-demonetisation for checking transactional relationships between PAN holders.
The Managed Service Provider (MSP), which the IT department plans to hire, will design and operate analytical solutions that will in turn help in collating data, matching it and identifying relationships as well as clustering of the PAN and non-PAN data, an official said.
The analytical solutions would help the department gather data from banks, post offices and other sources for linking of information and identification of duplicate details. It will also identify records with errors or other defects for resubmission.
Astounding amounts of 2.5 quintillion bytes of data are created everyday today. Attached with this post is an informative infographic made by our team of trainers at DexLab Analytics.
The process of Big Data accumulation is best described as the collection of complex and large datasets of such an amount that it becomes difficult to process, capture, store, analyze and search them with the use of conventional data base systems.
It requires the use of more advanced mechanisms to do the same. Currently the use of Big Data is shaping the world around us, offering a deeper qualitative insight within our daily lives.