We are back again with some exciting news for you! We, a team of consultants of DexLab Analytics are sponsoring Atharva – the Ultimate CMO Challenge 2017, which is to be held at the Delhi School of Economics, today.
The first round was held on 13th February, 2017, where an Initial Case Study was needed to be submitted online and a brief for solutions, in the form of 3-4 slides or 2-3 pages write-up was to be submitted by 19th February, 2017. The candidates who got selected were declared as shortlisted by 21st February, 2017. And within 27th February 2017, final solutions in the form of PPT (with maximum 15 slides) were submitted.
This is the story of Brontobyte, and how it emerged from a single byte to the massive bronto! It all started on the year 1956, when bronto was a wee small Byte, born to parents unknown at a place undisclosed in pages of computerized history. We know however, that Bronto had a Godfather, from IBM Mr. Werner Buchholz who gave him his name ‘Byte’ in the month of July, 1956.
It is a funny story how Mr. Buchholz almost changed his life since the beginning by changing his name from ‘Bite’ to ‘Byte’ almost at the last minute, so, that he would not get lost in all those bits and pieces! Brontobyte must really thankful to him for doing so, this was a special bit apart from the rest of the bites, a really special – byte! So, it is safe to say that Brontobyte was born somewhere around that time in 1956. And that makes him 61 years old.
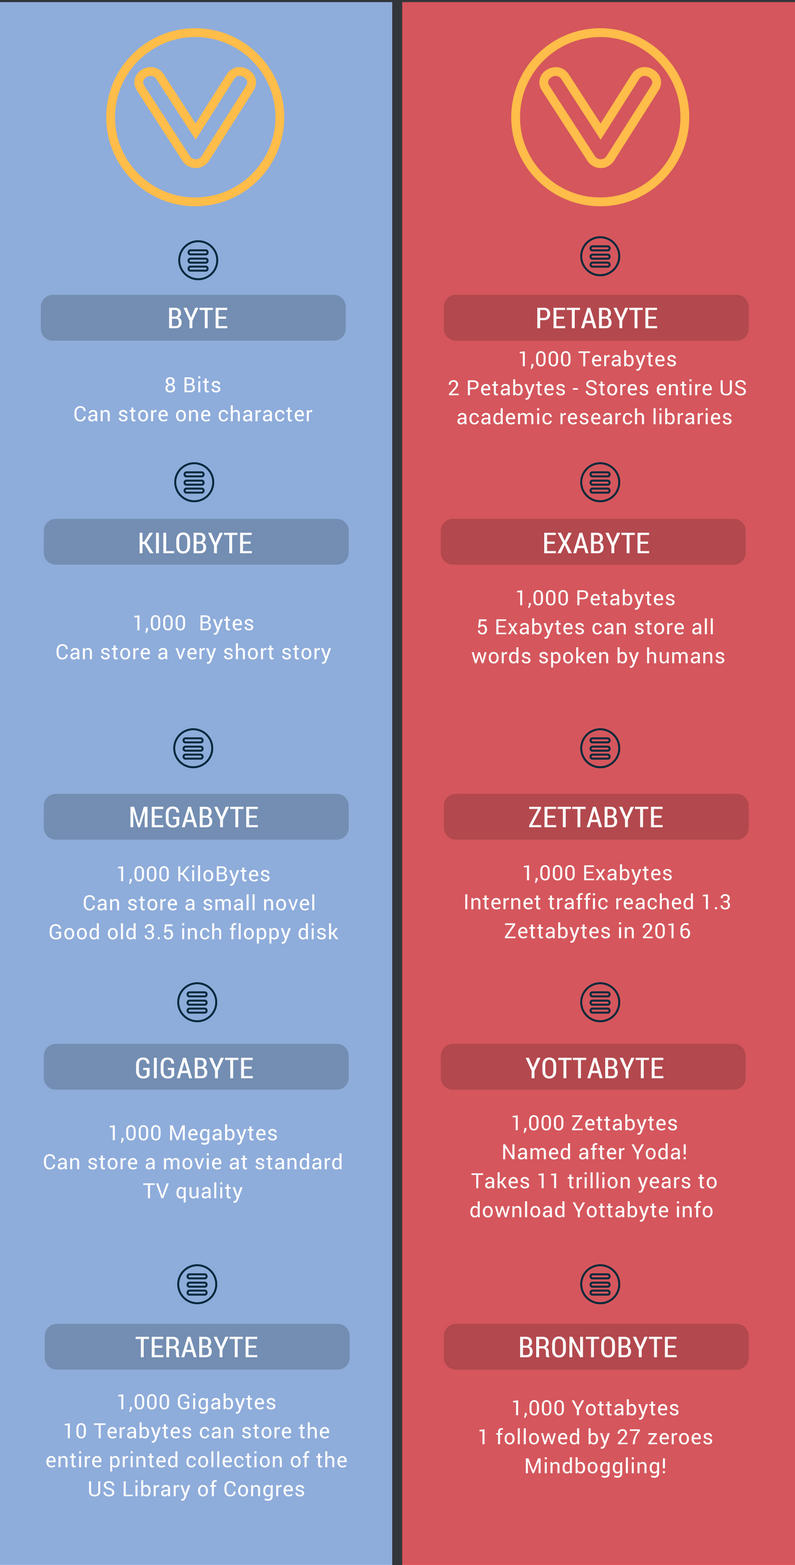
This is not a tale of bragging about something very usual. It is a tale truly special as you will see later in this biography of Brontobyte. Our friend byte here was born gifted in three unique angles. The first being, as it kept growing it also went on to acquire new names. Like at first, he got the name Kilobyte, this grew on to be called as megabyte etc. (You can find all the names he got in his later years at the infographic attached herein)
The second reason why byte is so special is because it has been growing at an exponential rate since, its birth. While most of us humans only keep growing until our 18 years of age or so, and then stop growing physically; but not our friend Bronto here.
And lastly, the third reason why Bronto is so special is because it has helped several other significant technologies that are completely revolutionary like the Personal Computer, the Internet, Big Data, and now IoT to have developed and grown with it. It may not be apt to say that Big Data was just Bronto’s creation, that is because Bronto lies inherently as a part of Big Data even today.
Here are all the names that byte received throughout its age as it grew bigger!
Byte To Brontobyte and beyond:
Image Source: api.ning.com
Some other specialities of byte are discussed here:
The name Yottabyte was kept after Yoda. Currently, it is difficult to say even how big Brontobyte is, it might even have become Gegobyte! You can help us by letting us know in the comments. Byte had its lifelong passion to store information. The more information it store the bigger it kept growing. In its present avatar Brontobyte can store the entire knowledge of the universe known till now.
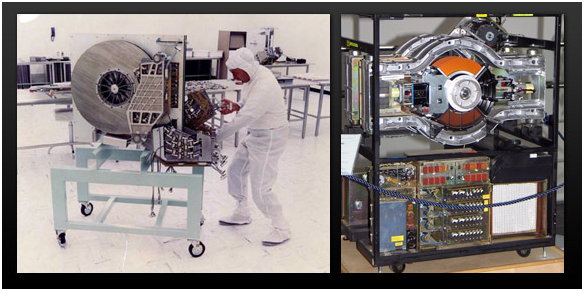
An interesting thing about Brontobyte is that the more it grew the size of its houses, which have changed throughout the years, got smaller!
Here are the pictures of some of the houses byte has lived throughout his life in chronological order:
Photo Coutesy of royal.pingdom.com
UNIVAC computer Drum memory
Photo Coutesy of royal.pingdom.com
Hard disk drive (kept getting smaller with age)
Photo Coutesy of royal.pingdom.com
Left: 250 MB hard disk drive from 1979, Right: first GB-capacity hard disk drive
Later, he mostly lived in much smaller houses that even spun around inside other places like in a Laser Disk, Floppy disk, Magnetic Tape etc. Brontobyte currently lives in a “Solid State Drive” (SSD). While it is small, but it is still very nice and quiet, exactly how it likes.
To learn more about Machine Learning Using Python and Spark – click here. To learn more about Data Analyst with Advanced excel course – click here. To learn more about Data Analyst with SAS Course – click here. To learn more about Data Analyst with R Course – click here. To learn more about Big Data Course – click here.
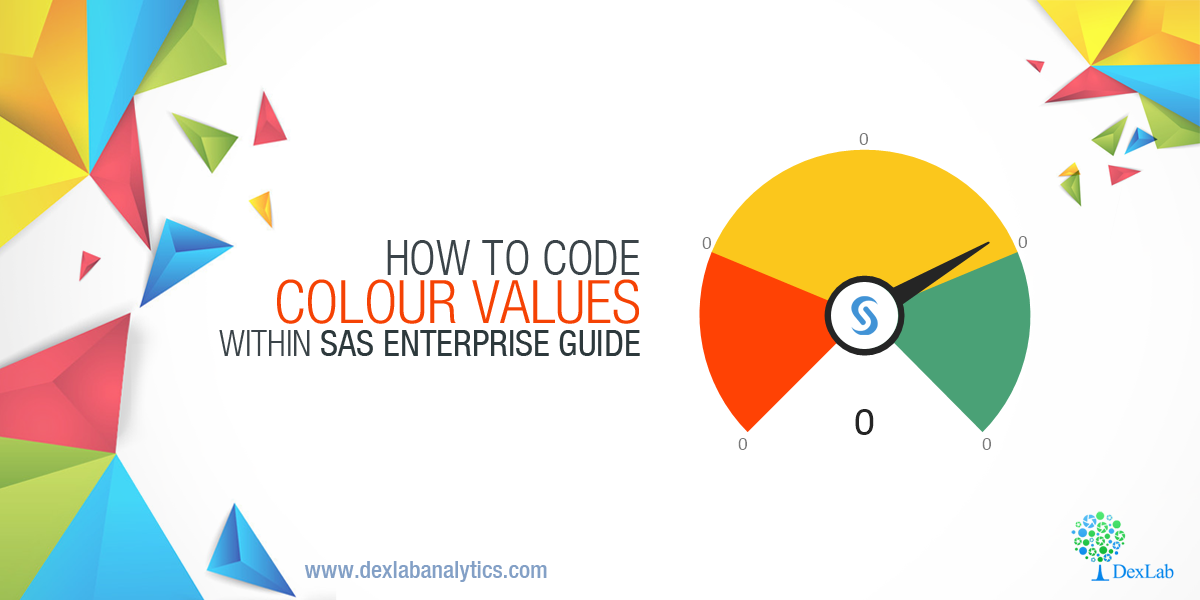
Colours are amazing, they are the subject of many romantic poems and songs, they are what can alter our moods drastically, they are these magical wavelengths that transform into incredible visions for our eyes.
Some feel warm, while others feel cool, some make us happy while others make us sad… but as colours are so important, how to add these values within the SAS Enterprise Guide?
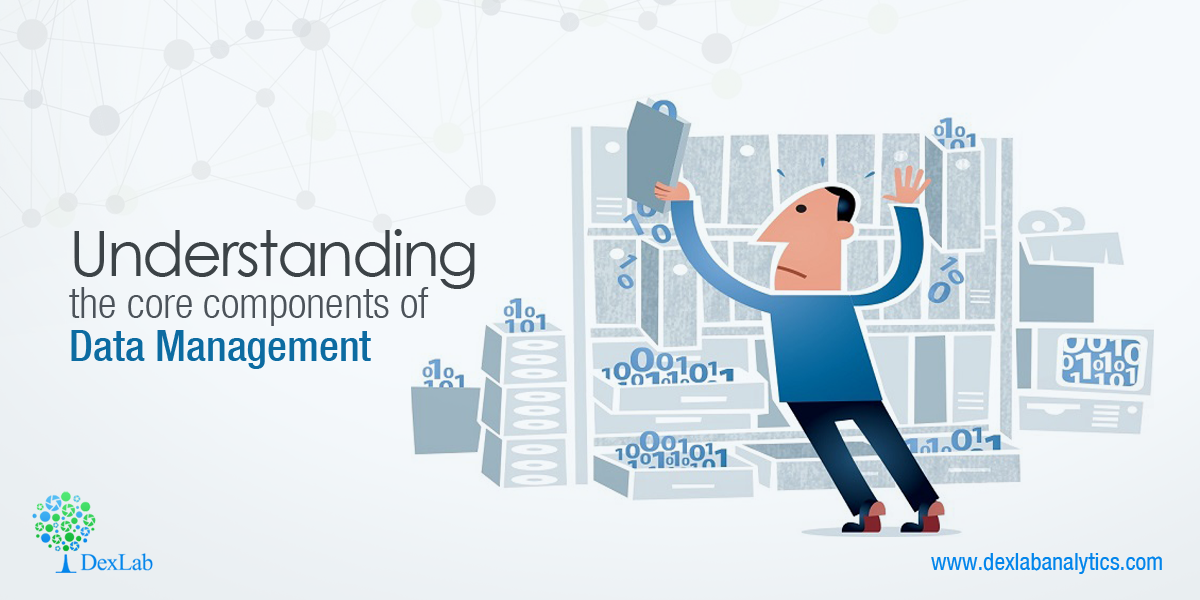
Ever wondered why many organizations often find it hard to implement Big Data? The reason often is poor or non-existent data management strategies which works counterproductive.
Data cannot be delivered or analysed without proper technology systems and procedural flows data can never be analysed or delivered. And without an expert team to manage and maintain the setup, errors, and backlogs will be frequent.
Before we make a plan of the data management strategies we must consider what systems and technologies one may need to add and what improvements can be made to an existing processes; and what do these roles bring about in terms of effects with changes.
However, a much as is possible any type of changes should be done by making sure a strategy is going to be integrated with the existing business process.
And it is also important to take a holistic point of view, for data management. After all, a strategy that does not work for its users will never function effectively for any organization.
With all these things in mind, in this article we will examine each of the three most important non-data components for a successful data management strategy – this should include the process, the technology and the people.
Recognizing the right data systems:
There is a lot of technology implemented into the Big Data industry, and a lot of it is in the form of a highly specific tool system. Almost all of the enterprises do need the following types of tech:
Data mining:
This will isolate specific information from a large data sets and transform it into usable metrics. Some o the familiar data mining tools are SAS, R and KXEN.
Automated ETL:
The process of ETL is used to extract, transform, and also will load data so that it can be used. ETL tools also automate this process so that human users will not have to request data manually. Moreover, the automated process is way more consistent.
Enterprise data warehouse:
A centralised data warehouse will be able to store all of an organization’s data and also integrate a related data from other sources, this is an indispensible part of any data management plan. It also keeps data accessible, and associates a lot of kinds of customer data for a complete view.
Enterprise monitoring:
These are tools, which provide a layer of security and quality assurance by monitoring some critical environments, with problem diagnosing, whenever they arise, and also to quickly notify the team behind analytics.
Business intelligence and reporting, Analytics:
These are tools that turn processed data into insights, that are tailored to extract roles along with users. Data must go to the right people and in the right format for it to be useful.
Analytics:
And in analytics highly specific metrics are combined like customer acquisition data, product life cycle, and tracking details, with intuitive user friendly interfaces. They often integrate with some non-analytics tools to ensure the best possible user experience.
So, it is important to not think of the above technologies as simply isolated elements but instead consider them as a part of a team. Which must work together as an organized unit.
To learn more about Data Analyst with Advanced excel course – Enrol Now. To learn more about Data Analyst with R Course – Enrol Now. To learn more about Big Data Course – Enrol Now.
To learn more about Machine Learning Using Python and Spark – Enrol Now. To learn more about Data Analyst with SAS Course – Enrol Now. To learn more about Data Analyst with Apache Spark Course – Enrol Now. To learn more about Data Analyst with Market Risk Analytics and Modelling Course – Enrol Now.
Before we begin with our Python tutorial on how to parse data with Python, we would like you to download this machine learning data file, and then get set to learn how to parse data.
The data set we have provided in the above link, mimics exactly the way the data was when we visited the web pages at that point of time, but the interesting thing about this is we need not visit the page even. We actually have the full HTML source code, so it is just like parsing the website without the annoying bandwidth use.
Now, the first thing to do when we start is to correspond the date to our data, and then we will pull the actual data.
Here is how we start:
import pandas as pd
import os
import time
from datetime import datetime
path ="X:/Backups/intraQuarter"
As given above, we are importing the Pandas for the Pandas module, OS, that is so we can interact with the directories, date and time for managing the date and time information.
Furthermore, we will finally define the path, which is the path to the intraQuarter folder than one will need to unzip the original zip file, which you just downloaded from the website.
defKey_Stats(gather="Total Debt/Equity (mrq)"):
statspath = path+'/_KeyStats'
stock_list =[x[0]for x in os.walk(statspath)]#print(stock_list)
We began our functions, with the specification that we are going to try to collect all the Debt/equity values.
The path to the stats directory is Statspath.
To list all the contents in the directory, you can use stock_list which is a fast one-liner for the loop that uses os.walk.
for each_dir in stock_list[1:]:
each_file = os.listdir(each_dir)if len(each_file)>0:
Mentioned above is a cycling through of directory (which is every stock ticker). Then the next step is to list “each_file”, which is each file within that very stock’s directory. If in case the length of each_file which is in fact is a list of all of the files in the stock’s directory, is greater than 0 only then will we want to proceed. However, there are some stocks with no files or data:
for file in each_file:
date_stamp = datetime.strptime(file,'%Y%m%d%H%M%S.html')
unix_time = time.mktime(date_stamp.timetuple())print(date_stamp, unix_time)#time.sleep(15)Key_Stats()
Finally, at the end, we must run a loop that pulls the date_stamp, from each file. All our files are actually stored under their ticket, with a file name for the exact date and time from which the information is being taken out.
It is from there that we will explain to date-time what the format for our date stamp is, and then we will convert it to a Unix time stamp.
To know more about data parsing or anything else in python, learn Machine Learning Using Pythonwith the experts at DexLab Analytics.
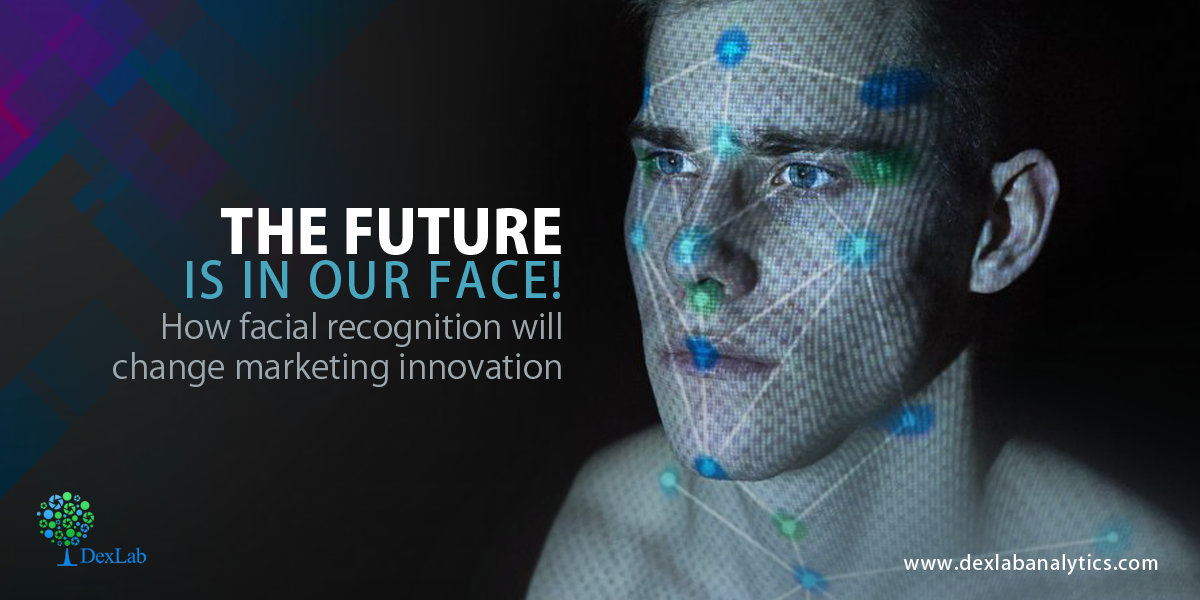
Most us are taking a lot of technological marvels around us for granted these days. We have casually taken note of the things like how our smartphones now help us assign photos of people or organize them, or how Facebook usually knows the right people’s faces to tag. However, it has only happened recently, which most people have not realized, that this technology is not so much of a “cool trick” and will actually shape the way people are conducting their business endeavours.
These latest technological developments are already being tested out in several different industries and for a lot of different purposes. Like for instance, security scanners at the airports are now making use of this technology to allow the e-passport holders clear their customs faster. And with the further development in facial recognition technology, the border and customs officers will be able to recognize and weed out travellers with fake passports better.
Moreover, the facial recognition technology is now being implemented in several government facilities and businesses that require a higher level of security clearance. With the use of this technology, security professionals may easily run the real-time criminal searches with the use of CCTV footage.
Now if you are like us, and constantly purchase things online then you must be aware of the fact that your choice and even your face must be with them in their database as a part of your customer profile. But these days, major retailers in physical stores are using intelligent data and trying to up their game to compete with the shopping sites. This will help them target customers faster and help them provide offers specifically tailored to these people based on their buying preferences just like at online stores.
We have provided Big Data training for Snapdeal, so why not target your customers better with a Big Data certification?
Furthermore, such a technology can also be used to catch shoplifters red handed in the act, a system that Walmart has actually implemented in place in many of its stores
When your face as a customer shows up for the first time on their screens they will start to build a profile of yours, which will be based on your in-store actions. Like for instance, the amount of time one spends in a certain area, the path around the store and items that you choose to buy.
Even the entertainment industry, like theme parks, casinos, etc have already caught up in the use of this technology to not only target marketing activities, but also to keep an eye on suspicious activities. And when it comes to greater applications for facial recognition, like in the industries of banking and fintech we are only just scratching the surface.
Several industry insiders have agreed that facial recognition will allow marketers to effectively know their customers much better, the visitor photos stored may work as the cookies for referencing for identification and for storage of users as well. So, this technology can soon eliminate loyalty cards as an obsolete art.
The moment one walks into a store the staff will already have an idea of what they bought there when visited the store the last time, and thanks to the camera footage with the facial recognition technology, will provide the retailers with an advantage to keep up their pace with ecommerce giants like Amazon, Flipkart, Alibaba etc.
One may also use facial recognition to retarget their customers with several personal offers. Like you decide to buy a certain product at a certain store, but then leave as it is slightly over budget for you. Soon you may find an internet ad or a personal message about a good discount on that product from that retailer offering you a good deal. But for all this to take proper shape, there must be a strong backup strategy, which certainly plays a strong role when it comes to way people collect, use and store data of any kind.
Thus, this will begin a whole new chapter to targeted campaigns be it online or offline or both, through the leveraging of Big Data for even a single customer.
Big Data courses from the industry leaders now just a click away, with DexLab Analytics.
To learn more about Data Analyst with Advanced excel course – Enrol Now. To learn more about Data Analyst with R Course – Enrol Now. To learn more about Big Data Course – Enrol Now.
To learn more about Machine Learning Using Python and Spark – Enrol Now. To learn more about Data Analyst with SAS Course – Enrol Now. To learn more about Data Analyst with Apache Spark Course – Enrol Now. To learn more about Data Analyst with Market Risk Analytics and Modelling Course – Enrol Now.
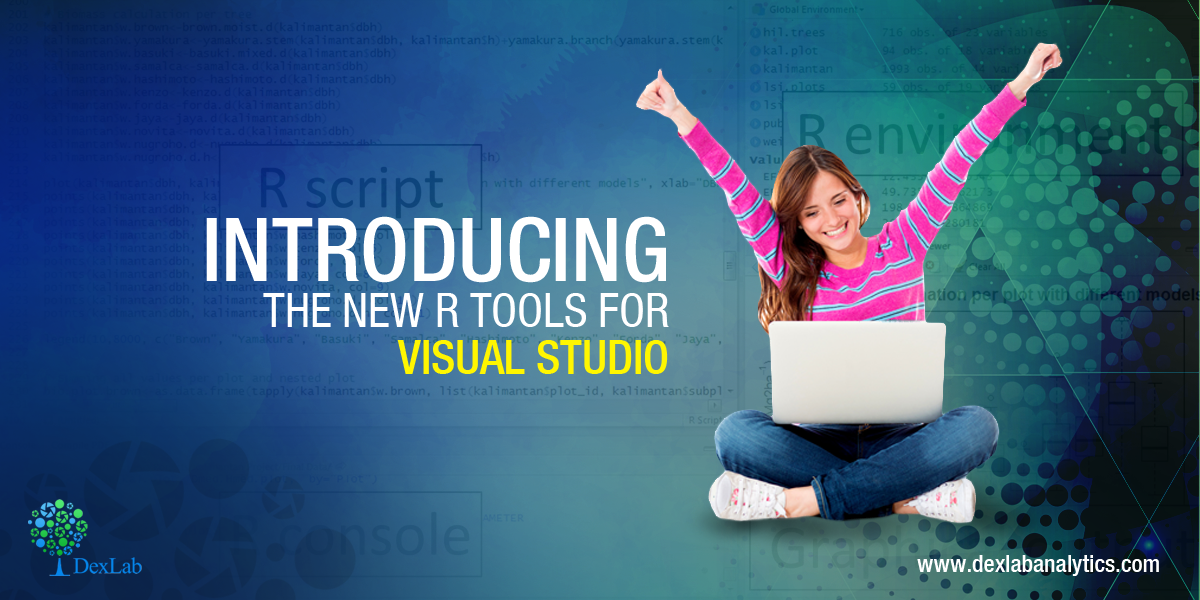
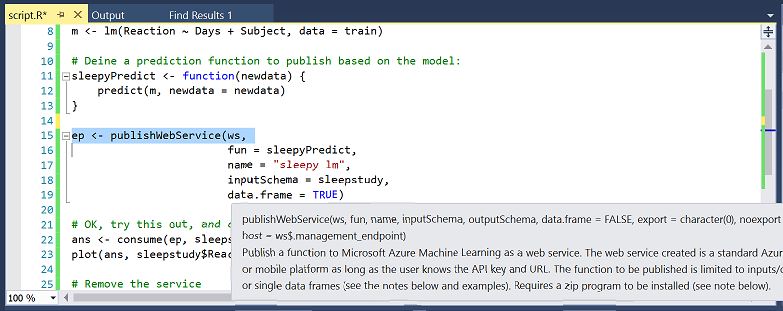
It is a great new development that the new Visual Studio now speaks the R Language!
Here is how:
Decidedly now R is the most popular statistical data analysis language which is in use these days. The R tools for Visual Studio brings together the power of R and Visual Studio in the same pod, for a convenient, and easy to use plug-in that is not only free and open source, but is very user friendly. When it is combined with the powers of Visual Studio Community Edition, then you will receive a multilingual IDE, which is perpetually free for all small teams.
In order to showcase and inspire testing and evaluation from the developer community, the R tools package for Visual Studios has been launched as a public preview version.
Here are the new exciting features being introduced in this preview release version:
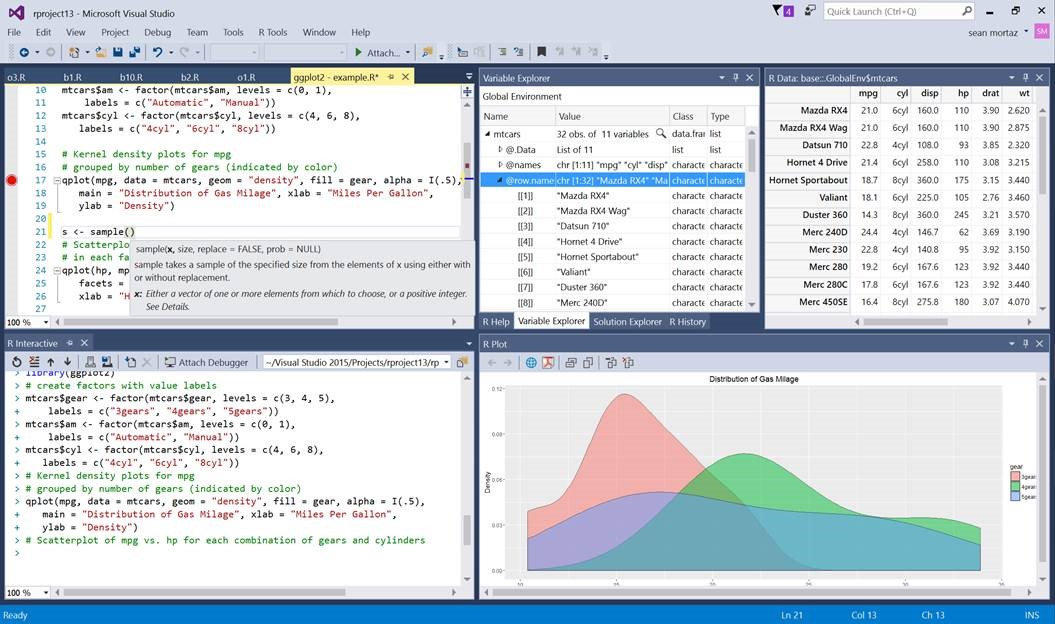
Editor – this is a complete package for fine editing experience finished with R scripts and functions, which also include detachable/ tabbed windows, syntax highlighting and a lot more.
IntelliSense – this is also known as auto-completion and is available in both the editor as well as the Interactive R window
R Interactive Window – with this you can work directly with R console from within the Visual Studio
History window – one can search, view, and select previous commands and then send it to the Interactive Window.
A variable explorer – now get the advantage to drill deep into your R data structures and examine their values
Plotting – now check all your R plots within a Visual Studio tool window
Debugging – stepping, breakpoints, watch windows, call stacks and much more
R markdown – get to use R Markdown/knitr support with export to Word and HTML
Git – get control over source code through Git and GitHub
Extensions – more than 6000 extensions covering a wide spectrum from Data to Productivity to Language
Help – view R documentation with the use of ? and ?? in Visual Studio itself
A polyglot IDE– VS supports, R, Python, C and C++, C#, Node.js, SQL, etc projects can be managed simultaneously.
Some other features that were requested by the R developer community are the Package Manager GUI, Visual Studio Code (cross-plat), and more, which will be a part of one of our future updates.
Now use Azure ML SDK:
Now you can use the R SDK with the RTVS to access all your datasets and also workspaces on the Azure ML. You can use the environment to build and test the models locally and easily operationalize them at scale on Azure.
This SDK is not tied to RTVS, but it can be used from any environment to publish models to Azure ML.
Conclusion:
This new element to the analytics offerings viz. a powerful R authoring environment post their previous announcements of Microsoft R Open and Microsoft R server announcements that took place last year is an exciting development.
For more exciting news on RTVS stay tuned to our regular blogs, because the time has never been better to be a data analyst.
To learn more about Machine Learning Using Python and Spark – click here. To learn more about Data Analyst with Advanced excel course – click here. To learn more about Data Analyst with SAS Course – click here. To learn more about Data Analyst with R Course – click here. To learn more about Big Data Course – click here.
It is evident that in the last few months, we have had several people showcase their enthusiasm about venturing into the world of data science using Machine Learning techniques. They are keen on probing the statistical regularities and building impeccable data-driven products. but we have made an observation that some may actually lack the necessary mathematical knowledge and intuition to get the framework for achieving results with data. And this is why we have decided to discuss this lacking through our blog.
In the recent times, there has been a noticeable upsurge in the availability of several easy-to-use machine and deep learning packages such as Weka, Tensorflow, scikit learn etc. But you must understand that machine learning as a field is one that has both statistical concepts, probabilistic concepts, computer science and algorithmic concepts to arise from learning intuitively from available data and also is about determining the patterns and hidden insights, which can be used to build intelligent applications. While still having the immense possibilities of Machine Learning and Deep Learning which is a thorough mathematical understanding of many of these techniques which is necessary for a good grasp of the internal workings of algorithms to achieve a good result.
To explain why it is necessary to behind the scenes into the mathematical details of Machine Learning, we have put own a few important points:
To choose the right algorithm which will include giving considerations, to accuracy, to the right training time, complexity of model, number of parameters and the number of features.
To choose parameter settings and to validate the strategies
To indentify the under-fitting and over-fitting by understanding the bias-variance trade off.
For acquiring ample confidence about the interval and uncertainty
The level of math one will need:
The primary question when one tries to understand an interdisciplinary field such as Machine Learning, is the amount of math needed and the level of math needed to understand these techniques.
The answer to this question is not as simple as it may seem and is multidimensional which, depends upon the level and interest of the individual. Research conducted in these mathematical formulations and theoretical advancements for Machine Learning is an ongoing process and a few researchers are already working on few more advanced techniques. However, we will state the least amount of math that is a must have skill for being a successful Machine learning Engineer/ Scientist is the importance of each and every mathematical concept.
Linear algebra:
This is the math skill to have for the 21st century. One must be well-versed with the topics of Principal Component Analysis (PCA), Singular Value Decomposition (SVD), Eigendecomposition of a matrix, LU Decomposition, QR Decomposition/Factorization, Symmetric Matrices, Orthogonalization & Orthonormalization, Matrix Operations, Projections, Eigenvalues & Eigenvectors, Vector Spaces as these norms are absolutely necessary for the understanding and the optimization methods for machine learning. The best thing about linear algebra is that there are a lot of online resources.
Probability theory and statistics:
Machine learning and statistics are not too different a field. And in reality some people have actually defined Machine Learning as “doing statistics on a Mac”. A few fundamentals that are a must have for machine learning are – Combinatorics, Probability Rules & Axioms, Bayes’ Theorem, Random Variables, Variance and Expectation, Conditional and Joint Distributions, Standard Distributions (Bernoulli, Binomial, Multinomial, Uniform and Gaussian), Moment Generating Functions, Maximum Likelihood Estimation (MLE), Prior and Posterior, Maximum a Posteriori Estimation (MAP) and Sampling Methods.
Multivariate calculus:
Differential and Integral Calculus, Partial Derivatives, Vector-Values Functions, Directional Gradient, Hessian, Jacobian, Laplacian and Lagragian Distribution are some of the necessary topics necessary for understanding ML.
Algorithms and Complex Optimizations:
In order to realize the computational efficiency and scalability of our Machine Learning Algorithm and for exploiting the sparsity in the dataset, this concept is necessary. One must have knowledge of data structures such as Binary Trees, Hashing, Heap, Stack etc, and Dynamic Programming, Randomized & Sublinear Algorithm, Graphs, Gradient/Stochastic Descents and Primal-Dual methods.
A few other mathematical skills that are often necessary for understanding ML are the following Real and Complex Analysis (Sets and Sequences, Topology, Metric Spaces, Single-Valued and Continuous Functions, Limits), Information Theory (Entropy, Information Gain), Function Spaces and Manifolds.
We are happy to announce our month-long corporate training session for the representatives of WHO, who will be joining us to discuss data analytics all the way from Bhutan. The team of delegates who have come to seek training from our expert in-house trainers are for the Central of Disease Control, Ministry of Health Royal Government of Bhutan.
The training is on the concepts of R Programming, Data Science using R and Statistical Modelling using R, and will go on from the 8th of February 2017 to the 8th of March 2017. We are hosting this training session at our headquarters in Gurgaon, Delhi NCR. It is a matter of great pride and honour for the team of seasoned industry expert trainers at DexLab Analytics to be hosting the representatives from WHO.