Dexlab, Author at DexLab Analytics | Big Data Hadoop SAS R Analytics Predictive Modeling & Excel VBA - Page 56 of 80

How to Determine the Size of a SAS Data Set

How to Determine the Size of a SAS Data Set

When program codes, applications and SAS data sets are developed, enough attention is often not given to EFFECIENCY, especially during the initial phases of development. Since, data size and system conduct can influence a program or an application’s functioning, SAS users need to access information about a data set’s size and content. To ascertain how much disk space a data set is using, users can easily do a few calculations to learn to access metadata content and attain the important information. Determine, estimate and understand information with this following tip, which helps improve SAS performance and fine-tuning of techniques.

Also read: How to Code Colour Values Within SAS Enterprise Guide


Implementing PROC SQL and DICTIONARY.TABLES

The SAS system accumulates valuable information (also known as metadata) about all-familiar SAS libraries, indexes, data sets (tables), system options, views, catalogs, macros and an assemblage of other “read-only” tables called Dictionary tables and SASHELP views. TABLES, a particular Dictionary table and its SASHELP view equivalent, VTABLE, consists details about a SAS session’s data set. Check the following PROC SQL code as its specification will help us get access to the contents of four columns observed in the TABLES Dictionary table, namely BNAME, MEMNAME, MEMTYPE and FILESIZE to exhibit the size of the CARS data set.

Also read: How to Use PUT and %PUT Statements in SAS: 6 Tips


PROC SQL and Dictionary.TABLES:

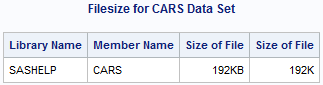
PROC SQL ;
  TITLE ‘Filesize for CARS Data Set’ ;
  SELECT LIBNAME,
         MEMNAME,
         FILESIZE FORMAT=SIZEKMG.,
         FILESIZE FORMAT=SIZEK.
    FROM DICTIONARY.TABLES
      WHERE LIBNAME = ‘SASHELP’
        AND MEMNAME = ‘CARS’
        AND MEMTYPE = ‘DATA’ ;
QUIT ;

Results

Size-of-SAS-data-set1

Analysis

The above results show that the CARS data set filesize is 192KB.

Nota bene: If the SIZEKMG.format is mentioned in a format=option, SAS ascertains whether it should apply KB for kilobytes, MB for megabytes or GB for gigabytes, and divide the filesize value with the help of one of the following values:

KB           1024

MB          1048576

GB           1073741824


Using PROC PRINT and SASHELP.VTABLE

In the following example, the provisions of a PROC PRINT are explained to access the constituents of three columns found in the VTABLE SASHELP view, particularly LIBNAME, MEMNAME and FILESIZE to exhibit the size of the CARS data set.

Also read: SAS Still Dominates the Market After Decades of its Inception


PROC PRINT and SASHELP.VTABLE

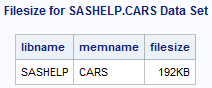
PROC PRINT DATA=SASHELP.VTABLE NOOBS ;
  VAR LIBNAME MEMNAME FILESIZE ;
  WHERE LIBNAME = ‘SASHELP’
    AND MEMNAME = ‘CARS’ ;
  FORMAT FILESIZE SIZEKMG. ;
  TITLE ‘Filesize for SASHELP.CARS Data Set’ ;
RUN ;

Results

Size-of-SAS-data-set2


Using DATA _NULL_, SASHELP.VEXTFL and CALL SYMPUTX

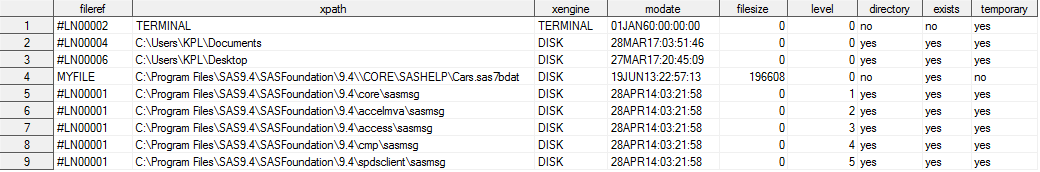
Lastly, a DATA_NULL_ is depicted to approach the contents of the VEXTFL SASHELP view with a FILENAME statement. An assignment statement is specified to determine the FILESIZE value for the size of the CARS data set. The CALL SYMPUTX left supports and chops off the trailing blanks from the digital FILSESIZE value of 196608.

Also read: Things to judge in SAS training centres


DATA_NULL_and SASHELP.VEXTFL

filename myfile 'C:\Program Files\SAS9.4\SASFoundation\9.4\\CORE\SASHELP\Cars.sas7bdat' ;
DATA _NULL_ ;
  SET SASHELP.VEXTFL (WHERE=(FILEREF=’MYFILE’)) ; 
  /* Calculate the Filesize in MB */
  FILESIZE = FILESIZE / (1024 ** 2) ;
  CALL SYMPUTX (‘FILESIZE’,FILESIZE) ;
RUN ;

Results

Size-of-SAS-data-set3


Learn more about SAS Predictive Modelling by taking up SAS certification courses in Delhi and Gurgaon. DexLab Analytics offers excellent SAS analytics course for data enthusiasts.

 
This post originally appeared onblogs.sas.com/content/sastraining/2017/04/25/determining-the-size-of-a-sas-data-set
 

Interested in a career in Data Analyst?

To learn more about Machine Learning Using Python and Spark – click here.
To learn more about Data Analyst with Advanced excel course – click here.
To learn more about Data Analyst with SAS Course – click here.
To learn more about Data Analyst with R Course – click here.
To learn more about Big Data Course – click here.

Artificial Intelligence: What the Future Holds for India, Next to US

Is artificial intelligence outgrowing human intelligence? Is AI becoming smarter than we are?

Artificial Intelligence: What the Future Holds for India, Next to US

In the United States – the world’s unchallenged superpower, a new strange issue has popped up, which is being discussed on all the major interactive platforms, like books, talk-shows, YouTube, etc. but to no avail. The issue-in-question is addressed in the beginning of the blog.

Also read: Learn to Surf on the Three Waves of Artificial Intelligence

Will computer intelligence exceed human intelligence?

In India, this doesn’t seem to bother us much. For us, computers are electronic devices that we control, that we command. Our smartphones and tablets are treated as our servants and not our masters. But I wonder for how long will this persist? How long will we be able to refrain ourselves from being influenced by the West? Well, that’s another question to answer and let’s keep it for another day!

Also read: What Makes Artificial Intelligence So Incredibly Powerful?

In the US, some of the tech pundits are working tirelessly on the newer realms of AI each day and speculating what will happen when computer programmes finally overhauls human brain in thinking abilities. Intelligence is a set of information, and the potential to know how to use it.

Also read: How Machine Learning Training Course and AI Made Lives Easier

Since 1990, computer technology has evolved substantially and has become nifty in intelligence. Let’s take the example of self driving cars ploughing the American roads. A fully independent, self-driving car is no more a VFX-induced scene from a sci-fi fantasy movie; in two years or more, they will be found dominating the streets of the US and trust me they will be a reality! Sit in your car, read a book or sleep while your car reaches its destination on its own. This car will perform all those functions that you used to do, giving you a hiatus from driving!

Also read: DexLab Analytics’ Take on the scope of Artificial Intelligence: Its Humanity vs. Algorithms

The boons of AI don’t end here, it’s thriving and improving faster. Why? Because, humans need to address a whole lot of problems with the help of technology. From conducting complicated surgeries to developing hi-tech BI tools, the scope of computer intelligence is vast and still increasing.


Another crucial factor is that the human brain is limited and can only contain a fixed amount of cerebral cortex and related substances that helps us think and remember. Beyond that, there is no scope for expansion, but in computer technology, the sky is the limit. It is possible to create a computer as large as a 3-storeyed building and store humongous amount of data in it.

6

The research says within the next 25 years, computer intelligence will become so efficacious that it will leave behind man’s intelligence in every way. So, what are you waiting for you? Give your career a robust boost with R programming courses. Reach us at DexLab Analytics, a leading R language certification institute for more queries.


Interested in a career in Data Analyst?

To learn more about Machine Learning Using Python and Spark – click here.
To learn more about Data Analyst with Advanced excel course – click here.
To learn more about Data Analyst with SAS Course – click here.
To learn more about Data Analyst with R Course – click here.
To learn more about Big Data Course – click here.

Demystifying Tableau Jargons: Interact With Data like Never Before

Demystifying Tableau Jargons: Interact With Data like Never Before

Businesses are flourishing. Managerial data are in abundance. The need for efficient BI softwares is at the pinnacle. Structured BI softwares are nimble and up to the minute. Tableau is one such BI tool, which is not only simple and comprehensible, but also extremely purposeful, enough to fulfil high-end professional commitments. It works just the way you want it to, instruct it in a particular way and wait for the results, without compromising the security of various confidential data.</span

Here in this FAQ blog, we have pulled out some of the top of the line frequently asked queries, regarding Tableau and R Programming. Both are highly functional, user friendly and efficient. Scroll down to grasp the basics and decode the fundamentals of Tableau.

Also read: Most Commonly Asked Tableau Interview Questions

What is Tableau?

Tableau is one of the finest data visualization tools that empower the enterprises to represent the data in the most flawless and explicit manner. It has proved its worth by being at par with its dominant predecessors, who analysed data visually and ruled the market for long.

How Tableau is classified?

Tableau can be classified as follows:

  • Tableau Desktop
  • Tableau Server
  • Tableau Online

What makes Tableau so popular?

With superb visualizations at an affordable price, Tableau is unrivalled. It can easily connect to any database – you don’t have to plug-in and is equipped with a robust memory processing.

Also read: Power BI or Tableau? Which is Better and Why?

Can we use precompiled models, packages, etc. with Tableau and R?

The answer is YES. If you can do it with R, you can easily incorporate it with Tableau. It includes any parallel computing modules, packages, libraries and statistical packages. It also involves commercialized versions of R, including Revolution Analytics.

Also read: How to Connect Oracle BI Server with Tableau

While you integrate Tableau and R, what is the best measure to debug R scripts or discover errors?

This is a vital question. There are mainly two ways. The first way to do this is by using ‘write.csv’ command within the studied field that calls an R script. The second one considers the use of debug version of the unparalleled executable of Rserve (Rserve_d.exe), which is ideal to print out any code that R is performing, and will be called R scripts.

Also read: Are You Trying to Ace Your Tableau Interview?

Can R be used to reshape data?

Yes, R possesses the ability of reshaping data.

Can data be transferred from a relational database to R, using Tableau?

Well, yes. Tableau can transfer data from any given source and run R scripts on that particular data set, irrespective of data type – be it relational database, flat-file, cube or unstructured.

2

What is Tableau Reader?

Tableau Reader is an effective tool to open the .twbx(Tableau packaged Workbook) files. However, keep in mind, it can only open files and cannot develop new connections and workbooks.

What do you mean by Tableau Public?

Tableau Public is a fantastic tool for anyone who wants to share his interesting stories on the web with others. You will gain access to data, develop interactive data visualizations and publish them on your website for others to see. And all of this, without writing a single line of code.

As parting thoughts, if you want to make something promising out of your mundane organisational data or want to make your frantic schedule of data handling and management a bit easier and enjoyable, then surely Tableau certification Gurgaon will work wonders for you! Contact us at DexLab Analytics, the pioneering data science online learning institute. We will be happy to help you.


Interested in a career in Data Analyst?

To learn more about Machine Learning Using Python and Spark – click here.
To learn more about Data Analyst with Advanced excel course – click here.
To learn more about Data Analyst with SAS Course – click here.
To learn more about Data Analyst with R Course – click here.
To learn more about Big Data Course – click here.

Hadoop 2017: The Survivor and Not the Casualty

Hadoop 2017: The Survivor and Not the Casualty


Most people decipher – Hadoop and Big Data are the two sides of the same coin. Adding the fascinating word to your resume leads to better opportunities and higher pay structure. But what the future holds for Hadoop? Is it dismal or encouraging?

Continue reading “Hadoop 2017: The Survivor and Not the Casualty”

6 FAQs to Get Acquainted With the Fundamentals of Big Data

6-FAQs-to-Get-Acquainted-With-the-Fundamentals-of-Big-Data

By mobilizing the volume and wealth of information in an organization, Big Data leads to improved customer perceptiveness, competitive advantage and operational efficiency. In the current data-centric era, big data is the buzzword. Nevertheless, how many of you actually know what it entails?

In this blog, we have compiled few FAQs, which will instantly shed some light about the basics of Big Data and its implementation.

Also read: Tigers will be safe in the hands of Big Data Analytics

What is Big Data?

Substantially complex, big data involve hundreds and thousands of terabytes or exabytes of data (starts with 1 and has 18 zeros after it, or 1 million terabytes) per single data set. If explained in simple words, big data is a collection of data sets, which comes from a variety of sources, like customer data, Internet of Things and social media. If compiled and analyzed in the right manner, it helps in understanding the nature of the lifestyle and purchasing habits of people and customers better.

5

To be called Big Data, how much data is needed?

The answer to this question is a bit challenging. Depending on the infrastructure of the market, the threshold limit of big data is determined. In most of the cases, the lower boundary of big data is limited to 1 to 3 terabytes.

However, using big data technologies for small databases can prove to be effective. Netezza brings about 200 built-in computer programs, like Python and Revolution R, which gained immense appreciation for being applicable to small databases.

Also read: Why Getting a Big Data Certification Will Benefit Your Small Business

Is there any use of intuition in the current epoch of big data? Have machines completely superseded the human mind?

Intuition is consequential, as ever. Staring at the humongous amount of data compels us to start from somewhere. As there is so much data, intuition is important, like never before. If you ask me, big data hasn’t yet replaced intuition, in fact the latter somehow complements the former. Both of them share a continuum relationship, instead of binary.

What are the main sources of big data?

Transactional data, social data and machine data- are the chief sources of big data. Top-notch retailers like Amazon and Dominos boasting of more 1 million customer transactions per day results in to the generation of petabytes of transactional big data. Social media data comprise of 230 million tweets on Twitter per day, more than 60 hours of video uploaded every minute on YouTube and 2.7 billion Likes and Comments on Facebook appearing every day. Lastly, machine data can be boiled down to various modes, including the information generated by industrial equipment, web logs tracking behavioural data and real-time data emanating from sensors.

Also read: Big Data is the New Obsession of Small Business Owners

Is data visualization gaining popularity?

Adopt interactive data visualization tools and take your business to new heights. These tools are rewarding, say thanks to Big Data! Big conglomerates, like Google, Netflix, Amazon, Apple, Facebook and Twitter embraced the tools to visualize data. And this goes beyond the basic usage of graphs, excel charts and pivot tables.

Is big data going to last?

Well, yes, very much so. Big Data is leading the future and is going to stay HERE AND NOW. It is right on its way to fundamentally transform the ways in which companies function and regard their competitors, customers and overall business.

6

Are you thinking to kick-start your career with Big Data Hadoop courses, or have any other queries? Speak to our consultants at DexLab Analytics. Our Big Data Hadoop institute in Delhi will cater to your every data science needs.


Interested in a career in Data Analyst?

To learn more about Data Analyst with Advanced excel course – Enrol Now.
To learn more about Data Analyst with R Course – Enrol Now.
To learn more about Big Data Course – Enrol Now.

To learn more about Machine Learning Using Python and Spark – Enrol Now.
To learn more about Data Analyst with SAS Course – Enrol Now.
To learn more about Data Analyst with Apache Spark Course – Enrol Now.
To learn more about Data Analyst with Market Risk Analytics and Modelling Course – Enrol Now.

Drawing a Bigger Picture: FAQs about Data Analytics

Drawing a Bigger Picture: FAQs about Data Analytics

When the whole world is going crazy about business analytics, you might be sitting in a corner and wondering what does it all mean? With so many explanations, notions run a gamut of options.

It’s TIME to be acquainted with all the imperceptible jargons of data science; let’s get things moving with these elementary FAQs.

What is data analytics?

Data analytics is all about understanding the data and implementing the derived knowledge to direct actions. It is a technical way to transform raw data into meaningful information, which makes integral decision-making easier and effective. To perform data analytics, a handful number of statistical tools and software is used and et voila, you are right on your way to success!

How will analytics help businesses grow?

The rippling effects of data analytics are evident, from the moment you introduce it in your business network. And stop rattling! The effects are largely on the positive side, letting your business unravel opportunities, which it ignored before owing to lack of accurate analytical lens. By parsing latest trends, conventions and relationships within data, analytics help predict the future tendencies of the market.

Moreover, it throws light on these following questions:

  • What is going on and what will happen next?
  • Why is it happening?
  • What strategy would be the best to implement?

Also read: Tigers will be safe in the hands of Big Data Analytics

How do analytics projects look like?

A conventional analytics strategy is segregated into the following 4 steps:

Research – Analysts need to identify and get through the heart of the matter to help business address issues that it is facing now or will encounter in the future.

Plan – What type of data is used? What are the sources from where the data is to be secured? How the data is prepared for implementation? What are the methods used to analyse data? Professional analysts will assess the above-mentioned questions and find relevant solutions.

Execute – This is an important step, where analysts explores and analyses data from different perspectives.

Evaluate – In this stage, analysts evaluate the strategies and execute them.

How predictive modelling is implemented through business domains?

In business analytics, there are chiefly two models, descriptive and predictive. Descriptive models explain what has already happened and what is happening now, while Predictive models decipher what would happen along with stating the underlying reason.

Also read: Data Analytics for the Big Screen

One can now solve issues related to marketing, finance, human resource, operations and any other business operations without a hitch with predictive analytics modelling. By integrating past with present data, this strategy aims to anticipate the future before it arrives.

When should I deploy analytics in business?

An Intrinsic Revelation – Analytics is not a one-time event; it is a continuous process once undertaken. No one can say when will be the right time to introduce data analytics in your business. However, most of the businesses resort to analytics in their not-up-par days, when they face problems and lags behind in devising any possible solution.

5

So, now that you understand the data analytics sphere and the significance attached, take up business analytics training in Delhi. From a career perspective, the field of data science is burgeoning. DexLab Analytics is a premier data science training institute, headquartered in Gurgaon. Check out our services and get one for yourself!


Interested in a career in Data Analyst?

To learn more about Data Analyst with Advanced excel course – Enrol Now.
To learn more about Data Analyst with R Course – Enrol Now.
To learn more about Big Data Course – Enrol Now.

To learn more about Machine Learning Using Python and Spark – Enrol Now.
To learn more about Data Analyst with SAS Course – Enrol Now.
To learn more about Data Analyst with Apache Spark Course – Enrol Now.
To learn more about Data Analyst with Market Risk Analytics and Modelling Course – Enrol Now.

Using R Programming to Simulate the Incredible Pong Arcade Game

Unleashed in the market in 1972, Pong is one of the first computer games ever developed. Loosely inspired by tennis, Pong captured the worldwide gaming market soon after its launch. Instantaneously, it became a trending fad. Gaming enthusiasts became intrigued, they desired to delve deeper into the computer coding and system mechanisms mostly to understand the essence of arcade game development.

 
Using R Programming to Simulate the Incredible Pong Arcade Game
 

Today, R-Programming is extensively used to develop numerous board games. But the question to ponder on is – can we create traditional arcade games with R programming?

Continue reading “Using R Programming to Simulate the Incredible Pong Arcade Game”

Power BI or Tableau? Which is Better and Why?

Power-BI-or-Tableau--Which-is-Better--and-Why

In the present data frenzy setting, data visualization is the new Talk of the Town. Various companies are developing and launching their own data visualization tools in the market. For quite some time now, Tableau has been the pioneering data visualization platform and till date the best to consider. Tableau’s data visualization tool is unbeatable to any other emerging product in the digital community. 

Apparently, Tableau has a remarkable competitor, recently. It is the Power BI, a decisive and dynamic BI tool, brought into by Microsoft. It is catching the trend with Tableau fast and appears to be on its way to become the number one BI tool in the digital market.

tableau_dashboard

Talking about features, there is little room to establish a set of comparisons between Power BI and Tableau, as Power BI is better equipped with scintillating features. Putting it aside, Tableau comes with its own respective advantages, like high-end visualizations and superb scalability.

Is data visualization your business’ prime focus? If yes, Tableau will be the perfect solution for your venture. However, if you are on a look out for a platform, excelling on versatile analytic capabilities, including predictive modelling, optimizing and reporting, Power BI suite will be the real deal-breaker.  

In terms of tools and abilities, Power BI and Tableau boasts of two major differences:

Dummies guide to being a Data Architect / Administrator

Visualizations

Data visualization is crucial. Tableau strongly emphasizes on visuals, while Power BI mostly stresses on dynamic data manipulation features along with providing access to basic visualizations. Under Power BI, users select the visualization first and then drag the data into it. It is easy to upload data sets. On the other hand, Tableau offers sophisticated visualizations for larger data sets as compared to Power BI. Here, users can select the data and switch between visualizations on the go. Hoping between visualizations is easier in Tableau.


5

In-depth analysis

Analysis of data by each solution is distinctive in its own ways. Where Tableau lays stress on the front end, Power BI works more on the back-end depth. Better analyses of data is possible with Power BI than it was with Excel. The meat and potatoes of Power BI is to provide faster analyses of standard data sets. In case of Tableau, the features highlighted here ensure users ways to answer questions while they delve deeper into investigating data visualizations. The strategy displays basic trends as forecasts, implement ‘what if’ questions to calibrate data hypothetically and visualize ingredients of data dynamically for better comparison and contrast.

When it comes to investigating familiar sets of data and Excel is no more efficacious, Power BI is highly recommended. Contrarily, for interactive superior visualizations, Tableau remains unparalleled. However, it fails to casts its charm in manipulating data, where its tailing counterpart Power BI proves its superiority.

2016-09-23-1474621255-9641969-bibusinessintelligencets100646689primary.idge_

Drawing an inference – Tableau is my personal favourite and is still the most productive BI Tool available in the market. However, from a business perspective, Power BI is continuously on its endeavour to elevate its quality and is at present one of the most appealing products in the data viz world.  

For a bright career in data analytics, enrol for intensive tableau training courses. DexLab Analytics is a top-notch data science online learning platform. Run your eyes through their tableau BI training courses today.


Interested in a career in Data Analyst?

To learn more about Data Analyst with Advanced excel course – Enrol Now.
To learn more about Data Analyst with R Course – Enrol Now.
To learn more about Big Data Course – Enrol Now.

To learn more about Machine Learning Using Python and Spark – Enrol Now.
To learn more about Data Analyst with SAS Course – Enrol Now.
To learn more about Data Analyst with Apache Spark Course – Enrol Now.
To learn more about Data Analyst with Market Risk Analytics and Modelling Course – Enrol Now.

Transformation of Smartphones with AI

Transformation of Smartphones with AI

Once a science fiction fantasy, Artificial Intelligence is today’s resonating reality. People are already relishing myriad advantages through advanced mobile apps and smart-forever smartphones.

shutterstock_110381039

Supposedly, smartphones made our lives easier. Not only does it allows us stay in touch with our beloved ones 24/7 but also allow us easy accessibility to a humungous amount of information over the internet, help us reach our designated destinations, play games, watch movies, check mails, and lot more.. And in the thick of all the telltales of new cameras and additional storage, AI is bringing in a poignant change in the realm of smartphone technology, which will impact our lives immensely.

Integrating AI with apps

iphone-6s-apple-sept-9-event

How would you feel when your phone opens INSTAGRAM, before you tapped on it? You will be elated! Isn’t it? We are already witnessing some basic versions of above-mentioned technology on some phones where the most-used apps pop up on the top of the screen. It’s no more a thing from a science fiction novel; Google Now would know everything about you – the way you use your phone, when you call your home, when you need to tap open a map app, or even the exact moment you feel like taking a photo. No more you have to arrange your home screen icons or click on the apps you need, because whenever you will unlock your phone, the app you want to open will launch automatically.

Mark your steps with AI

Google-Maps-gas-prices

 On the other hand, if we talk about mapping systems, you must have already come by Apple maps and Google maps that can predict your next whereabouts, based on past searches and destinations put into. In the near future, this technology will get cleverer intellectually. Making decisions based on your preferred routes, the type of public transport you board, how you react when you are stuck in traffic won’t be a tad difficult, provided Google has all the information it needs about you.

Say Hi to a digital assistant

02siri

Do you wonder at times, what if your phone becomes your best friend? Though it may sound creepy at first, but this is exactly the way towards which Artificial Intelligence is heading to. Digital assistants will be more like your best buddy who will be beside you on your happiest and worst days. If you feel stressed at work, your digital assistant will know how to uplift your mood or what kind of music to play to make you better..  

button(1)

FELICITATIONS to the Personal assistant app

Siri-634x0-c-default

How about having an inbuilt personal assistant app to do the flight bookings or order some selected items from your shopping cart? Sounds cool! From restaurant bookings and comparing gas-energy prices to sending smart replies, this personal assistant using the bounties of AI excels on a bouquet of jobs.

5

Fulfilling software programs like Cortana, Siri and Google Now have already started bridging the gap between them and real-life personal assistants. In the future, this gap will further be lessened and these apps will finally be able to do many smart functions.

Get the best credit risk modeling training with our specialists at DexLab Analytics. Credit risk modelling certification course is in great demand now, so come to us and enrol.


Interested in a career in Data Analyst?

To learn more about Machine Learning Using Python and Spark – click here.
To learn more about Data Analyst with Advanced excel course – click here.
To learn more about Data Analyst with SAS Course – click here.
To learn more about Data Analyst with R Course – click here.
To learn more about Big Data Course – click here.

Call us to know more