Dexlab, Author at DexLab Analytics | Big Data Hadoop SAS R Analytics Predictive Modeling & Excel VBA - Page 54 of 80

More Than Fifty Percent Companies Lack Required Tools and Investment for Efficient Business Analytics

More Than Fifty Percent Companies Lack Required Tools and Investment for Efficient Business Analytics

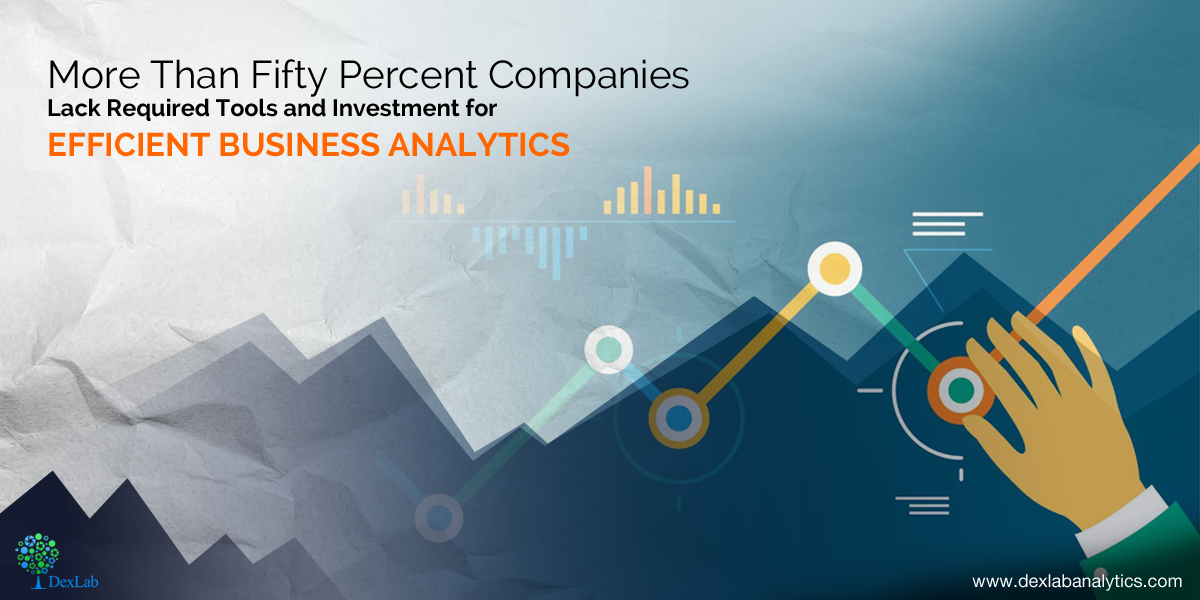
Fifty-nine percent of the companies around the world are not using Predictive Models or Advanced Analytics – says Forbes Insights/Dun & Bradstreet Study.

A recent study by Forbes Insights and Dun & Bradstreet, “Analytics Accelerates Into the Mainstream: 2017 Enterprise Analytics Study,” elucidates the ever-increasing indispensable role that analytics play in today’s business world, all the way from devising strategies to operations. The gloomy Forbes study highlights the crucial need for immediate investment, implementation and prioritization of analytics within companies.

5

The survey was carried on more than 300 senior executives in Britain, Ireland and North America and the report illuminates that the leading corporate giants need to invest more on the people, the processes they use and technologies that authorize decision support and decision automation.

Bruce Rogers, chief insights officer at Forbes Media was found quoting, “This study underlines the need for continued focus and investment,” he further added, “Without sophisticated analysis of quality data, companies risk falling behind.”

“All analytics are not created equal,” said Nipa Basu, chief analytics officer, Dun & Bradstreet.  She explained, “This report shows a critical opportunity for companies to both create a solid foundation of comprehensive business data – master data – and to utilize the right kind of advanced analytics. Those that haven’t yet begun to prioritize implementation of advanced analytics within their organizations will be playing catch-up for a long while, and may never fully recover.”


Key findings revealed:

Need for tools and best practices

Though data usage and consumption growth brags about success, little sophistication is observed in how data are analysed. Only 23% of the surveyed candidates are found to be using spreadsheets for all sorts of data work, while another 17% uses dashboards that are a little more efficient than spreadsheets.

The survey says mere 41% rely on predictive models and/or advanced analytical and forecasting techniques, and 19% of the respondents implement no analytical tools that are more complicated than fundamental data models and regressions.

Skill deficiency stalling analytics success

Twenty seven percent of respondents diagnosed with skill gaps as a major blocker between current data and analytics efforts. Fifty two percent were found to be working with third-party data vendors to tackle such lacks of skills. Moreover, 55% of the surveyed contestants said that third-party analytics partners performs better than those who works in-house, exhibiting both a shortage of analytics capabilities among in-house analysts and a dearth in skilled workers.

Investment crunch

Survey respondents ticked lack of investment and problems with technology as the top hindrances to fulfilling their data strategy goals. Despite the increasing use of data, investment in deft personnel and technology is lagging behind.

CFO’s introspect into data for careful insights

According to the survey, 63% of those who are in the financial domains shared they are using data and analytics to discover opportunities to fund business growth. Further, 60% of the survey respondents revealed they rely on data to boost long-term strategic planning.

For more interesting blogs and data-related stuffs, follow us on DexLab Analytics. We are a leading Data Science training institute in Delhi offering high-in demand Business analyst training courses in Gurgaon. Reach us today!


Interested in a career in Data Analyst?

To learn more about Data Analyst with Advanced excel course – Enrol Now.
To learn more about Data Analyst with R Course – Enrol Now.
To learn more about Big Data Course – Enrol Now.

To learn more about Machine Learning Using Python and Spark – Enrol Now.
To learn more about Data Analyst with SAS Course – Enrol Now.
To learn more about Data Analyst with Apache Spark Course – Enrol Now.
To learn more about Data Analyst with Market Risk Analytics and Modelling Course – Enrol Now.

Skills required during Interviews for a Data Scientist @ Facebook, Intel, Ebay. Square etc.

Skills required during Interviews for a Data Scientist @ Facebook, Intel, Ebay. Square etc.

Basic Programming Languages: You should know a statistical programming language, like R or Python (along with Numpy and Pandas Libraries), and a database querying language like SQL

Statistics: You should be able to explain phrases like null hypothesis, P-value, maximum likelihood estimators and confidence intervals. Statistics is important to crunch data and to pick out the most important figures out of a huge dataset. This is critical in the decision-making process and to design experiments.

Machine Learning: You should be able to explain K-nearest neighbors, random forests, and ensemble methods. These techniques typically are implemented in R or Python.  These algorithms show to employers that you have exposure to how data science can be used in more practical manners.

Data Wrangling: You should be able to clean up data. This basically means understanding that “California” and “CA” are the same thing – a negative number cannot exist in a dataset that describes population. It is all about identifying corrupt (or impure) data and and correcting/deleting them.

Data Visualization: Data scientist is useless on his or her own. They need to communicate their findings to Product Managers in order to make sure those data are manifesting into real applications. Thus, familiarity with data visualization tools like ggplot is very important (so you can SHOW data, not just talk about them)

Software Engineering: You should know algorithms and data structures, as they are often necessary in creating efficient algorithms for machine learning. Know the use cases and run time of these data structures: Queues, Arrays, Lists, Stacks, Trees, etc.

2

What they look for? @ Mu-Sigma, Fractal Analytics

    • Most of the analytics and data science companies, including third party analytics companies such as Mu-sigma and Fractal hire fresher’s in big numbers (some time in hundreds every year).
    • You see one of the main reasons why they are able to survive in this industry is the “Cost Arbitrage” benefit between the US and other developed countries vs India.
    • Generally speaking, they normally pay significantly lower for India talent in India compared to the same talent in the USA. Furthermore, hiring fresh talent from the campuses is one of the key strategies for them to maintain the low cost structure.
    • If they are visiting your campuses for interview process, you should apply. In case if they are not visiting your campus, drop your resume to them using their corporate email id that you can find on their websites.
    • Better will be to find someone in your network (such as seniors) who are working for these companies and ask them to refer you. This is normally the most effective approach after the campus placements.

Key Skills that look for are-

  • Love for numbers and quantitative stuff
  • Grit to keep on learning
  • Some programming experience (preferred)
  • Structured thinking approach
  • Passion for solving problems
  • Willingness to learn statistical concepts

Technical Skills

  • Math (e.g. linear algebra, calculus and probability)
  • Statistics (e.g. hypothesis testing and summary statistics)
  • Machine learning tools and techniques (e.g. k-nearest neighbors, random forests, ensemble methods, etc.)
  • Software engineering skills (e.g. distributed computing, algorithms and data structures)
  • Data mining
  • Data cleaning and munging
  • Data visualization (e.g. ggplot and d3.js) and reporting techniques
  • Unstructured data techniques
  • Python / R and/or SAS languages
  • SQL databases and database querying languages
  • Python (most common), C/C++ Java, Perl
  • Big data platforms like Hadoop, Hive & Pig

Business Skills

  • Analytic Problem-Solving: Approaching high-level challenges with a clear eye on what is important; employing the right approach/methods to make the maximum use of time and human resources.
  • Effective Communication: Detailing your techniques and discoveries to technical and non-technical audiences in a language they can understand.
  • Intellectual Curiosity: Exploring new territories and finding creative and unusual ways to solve problems.
  • Industry Knowledge: Understanding the way your chosen industryfunctions and how data are collected, analyzed and utilized.


Interested in a career in Data Analyst?

To learn more about Data Analyst with Advanced excel course – Enrol Now.
To learn more about Data Analyst with R Course – Enrol Now.
To learn more about Big Data Course – Enrol Now.

To learn more about Machine Learning Using Python and Spark – Enrol Now.
To learn more about Data Analyst with SAS Course – Enrol Now.
To learn more about Data Analyst with Apache Spark Course – Enrol Now.
To learn more about Data Analyst with Market Risk Analytics and Modelling Course – Enrol Now.

Making Data Visualizations Smarter, Tableau Explains How

Making Data Visualizations Smarter, Tableau explains How

Appalling, bewildering and utterly nonsensical – data at times can look incomprehensible, especially in its raw forms. This accelerated the foundation of the data visualization company and our very own ‘business dashboard’ tool. Generally found locked within the so-called BI sphere, we can now consider these top notch graphical tools as a powerful medium of assimilating, categorizing, analyzing and then presenting data in a highly interactive and interesting form, using images and charts.

2

What images are used in a BI dashboard?

Typically, we would found scatter plots, bubble charts, heat maps, pie charts, geographical maps and of course standard tables strewn across a BI dashboard– in short, it is a real smorgasbord of visualization tools.

But a question that clogs our minds is – why do we have to use these tools? What purpose they serve? The most prominent underlying reason typically revolves around the fact that we rely more on the computing power to sail through the numbers and then feature those numbers or ‘trends’ that the human mind would have taken ages to comprehend.

From our standpoint, we humans are more comfortable with pictures than tables or numbers. Spotting a trend through visual representation makes things easier and faster as compared to their traditional counterparts.

Infusing some more intelligence

Tableau Software, a Data Visualization specialist is in its endeavour to add intelligence in its existing format by injecting new brain power in the Tableau 10.3 product release. 

Expect the following updates:

  1. Automated table and join recommendations, powered by machine learning algorithms
  2. Data driven alerts for proactive monitoring of key metrics
  3. Six new data sources are added for rapid-fire analysis

To make things easier, Tableau excels to help create data dashboard table construction USING machine learning tools – and, trust me it would be quite important as all the machine logs comes mostly from the Internet of Things (IoT).

The mechanism behind data alerts

Powered by latest data-driven alerts, users can now receive instant notifications just the moment their data crosses a pre-determined threshold, ensuring they never miss out the changes occurring within the organisation.

Francois Ajenstat, chief product officer at Tableau stated, “Tableau 10.3 makes it easy for teams to access data, wherever it resides. In all, customers can now connect to more than 75 data sources via 66 connectors, without any programming. That includes a new PDF connector, which allows people to directly import PDF tables into Tableau with just one click. With an Adobe estimated 2.5 trillion PDFs worldwide, this unlocks a new realm of data that can be leveraged for rich analysis.”

New improved Tableau is now equipped with new connectors to data sources, like ServiceNow, MongoDB, Amazon Athena, Dropbox and Microsoft OneDrive.

Is data visualization really a cure-all?

If you ask me, I would say NO, not necessarily. Just by adopting data visualization and BI tools, such as Penataho, SAP, Microsoft, TIBCO and others, it doesn’t mean everything will be good to go. Keep in mind, though the algorithms are gaining momentum and becoming super powerful, we humans are still better in identifying the nuances, quirks, outliers and absolutely unique one-offs.

As parting thoughts, Tableau is marvellous, but don’t forget your fundamental commands in mathematics, learnt at school. They’ll help you, for sure! Till then, wish you luck!

1648519ca6ff87be75a3618dce6b4497d

For Tableau training courses, rest your trust on DexLab Analytics. We are a reputable Tableau Training Institute, headquartered in Gurgaon, with a branch in Delhi.


Interested in a career in Data Analyst?

To learn more about Data Analyst with Advanced excel course – Enrol Now.
To learn more about Data Analyst with R Course – Enrol Now.
To learn more about Big Data Course – Enrol Now.

To learn more about Machine Learning Using Python and Spark – Enrol Now.
To learn more about Data Analyst with SAS Course – Enrol Now.
To learn more about Data Analyst with Apache Spark Course – Enrol Now.
To learn more about Data Analyst with Market Risk Analytics and Modelling Course – Enrol Now.

Pentagon Fights Off ISIS with Machine Learning and Big Data

Machine learning and big data are the new BIG things going around in the world. They are being used for myriad purposes – better AI, apt malware detection, smart messenger apps, and lot, lot more. Topping that, they are being utilized by the Pentagon to eradicate the foundations of Islamic State militants and make the world a safer (and better) place to live in.

 
Pentagon Fights Off ISIS with Machine Learning and Big Data
 

This May, the Pentagon announced that it is undertaking its newly minted Algorithmic Warfare Cross Functional Team (AWCFT), codenamed Project Maven, with introducing Big Data and Machine Learning to boost the process of discovering actionable intelligence with the help of aerial imagery. “We’re not going to solve it by throwing more people at the problem…That’s the last thing that we actually want to do. We want to be smarter about what we’re doing,” Air Force Lt. Gen. John N.T. “Jack” Shanahan, director for defence intelligence for war fighter support told a leading defence news magazine.

Continue reading “Pentagon Fights Off ISIS with Machine Learning and Big Data”

When Machines Do Everything – How to Survive?

In the coming years, jobs and businesses are going to be impacted; reason AI. Today’s generation is very much concerned about how the bots will consume everything; from jobs to skills, the smart machines will spare nothing! It is true that machines are going to replace man-powered jobs – by using robots, mundane jobs can be performed in a flick of an eye freeing people working in bigger organisations to innovate and succeed.


Machine Learning training course Pune

Continue reading “When Machines Do Everything – How to Survive?”

Interesting Things to Do With Microsoft Excel

MS Excel Online training in Delhi

Microsoft Excel, whenever you hear this term, you visualise calculations, graphs, tables, formulas and what not – stuffs normally used to arrange and analyse data making pie charts, and countless related gimmicks.

Gaining proficiency in this specific software appears to be a common matter of concern for aspiring professionals from whatever field, they belongs to – and not just the ones who hail from a finance, accounts or IT background.

But do you know that MS Excel can be used for other interesting stuffs, apart from regular work-related things, like gaming and art? I guess not.

Leaf through a set of amazing projects completed with Microsoft Excel, which will surely knock you off your feet. So, are you ready?

Digital Art

Digital Art with MS Excel? Are you kidding me? No, I’m not. A 73-year old Japanese Tatsuo Horiuchi will change your entire perception. He practised digital art using MS Excel spreadsheet, why, because he found other graphics software to be quite expensive. He used the ‘autoshape’ feature of Excel to create stunning works of art. Fascinating, right?

excel-art

Sudoku

Did you finish solving the Sudoku puzzle in the newspaper? You want more? Fortunately, Microsoft is here to help you out! Download an Excel file and use it to create a never-ending stream of Sudoku puzzles and go on teasing your brain cells by solving the puzzle, till you get worn out.

MS-Excel-online-training

Re-inventing legendary games

Work hard, party harder! Excel totally buys the thought. By using Microsoft Excel, you can recreate the stellar games, like Monopoly, Pacman, Tetris and lot more. Of late, latest games like Candy Crush and 2048 have their own versions in Excel format, and that definitely calls for celebration!

pacell

Stop-motion animation

Animations and music video are two sides of the same coin. For years, it has been a popular medium. While A-ha’s “Take on Me” revolutionised the digital world 30 years back, Joe Penna, also known as Mystery Guitar Man on YouTube has taken the world by storm today, thanks to its stop-motion animation music video created using Excel spreadsheets.

He filmed himself performing the song “Cuban Pete”, broke down the video into 730 separate frames and then used each frame to develop a spreadsheet mosaic. The rest simply fell into place!

Advanced excel training

A working flight simulator

Scroll your thoughts to 1997, flight simulators came in from there. With the simulators, you can manoeuvre your environment as your mouse converts into the airplane control – move it back and forth or sideways and keep rolling.

No doubt, it became a favourite pastime for thousands of employees across the globe, including yours truly.

Excel dashboards training

Transport columns into rows

Mistakenly did you put data in columns, instead of rows or vice versa? Relax Microsoft has got you covered. There is a shortcut to fix the mistake. Just copy the row or column you need to interchange, right click on the cell you want to put it on and select Paste Special. A popup window named Transpose will appear. Check the box and click OK. That’s all you have to do. Easy, isn’t it?

Seeking Microsoft excel certification training online, DexLab Analytics is here! Check out our comprehensive MS Excel Online training in Delhi courses and hone your excel skills.


Interested in a career in Data Analyst?

To learn more about Machine Learning Using Python and Spark – click here.
To learn more about Data Analyst with Advanced excel course – click here.
To learn more about Data Analyst with SAS Course – click here.
To learn more about Data Analyst with R Course – click here.
To learn more about Big Data Course – click here.

Curiosity is Vital: How Machine Inquisitiveness Improves the Ability to Perform Smartly

Online Data Science Certification

What happens when a computer algorithm merges with a form of artificial curiosity – to solve precarious problems?

Meticulous researchers at the University of California, Berkeley framed an “intrinsic curiosity model” to make their learning algorithm function even when there is a lack of strong feedback signal. The pioneering model developed by this team visions the AI software controlling a virtual agent in video games in pursuit of maximising its understanding of its environment and related aspects affecting that environment. Previously, there have been numerous attempts to render AI agents’ curiosity, but this time the trick is simpler and rewarding.

The shortcomings of robust machine learning techniques can be solved with this mighty trick, and it could help us in making machines better at solving obscure real world problems.

Pulkit Agrawal, a PhD student at UC Berkeley, who pulled off the research with colleagues said, “Rewards in the real world are very sparse. Babies do all these random experiments, and you can think of that as a kind of curiosity. They are learning some sort of skills.”

Also read: Data Science – then and now!

Like several potent machine learning techniques rolled out in the past decade, Reinforcement Learning has brought in a phenomenal change in the way machine accomplish their things. It has been an intrinsic part of AlphaGo, a poster child of DeepMind; it helped playing and winning the complex board game GO with incredible skill and wit. As a result, the technique is now implemented to imbue machines with striking skills that might be impossible to code manually.

However, Reinforcement Learning comes with its own limitations. Agrawal pointed that sometimes it demands a huge amount of training in order to grasp a task, and the procedure can become troublesome, especially when the feedback is not immediately available. To simplify, the process doesn’t work for computer games where the advantages of specified behaviours is not just obvious. Hence, we call for curiosity!

Also read: After Chess, Draughts and Backgammon, How Google’s AlphaGo Win at Go

For quite some time now, a lot of research activity is going around on artificial curiosity. Pierre-Yves Oudeyer, a research director at the French Institute for Research in Computer Science and Automation, said, “What is very exciting right now is that these ideas, which were very much viewed as ‘exotic’ by both mainstream AI and neuroscience researchers, are now becoming a major topic in both AI and neuroscience,”. The best thing to watch now is how the UC Berkeley team is going to run it on robots that implement Reinforcement Learning to learn abstract stuffs. In context to above, Agrawal noted robots waste a nifty amount of time in fulfilling erratic gestures, but when properly equipped with innate curiosity, the same robot would quickly explore its environment and establish relationships with nearby objects.

Also read: CRACKING A WHIP ON BLACK MONEY HOARDERS WITH DATA ANALYTICS

In support of the UC Berkeley team, Brenden Lake, a research scientist at New York University who lives by framing computational models of human cognitive capabilities said the work seemed promising. Developing machines to think like humans is an impressive and important step in the machine-building world. He added, “It’s very impressive that by using only curiosity-driven learning, the agents in a game can now learn to navigate through levels.”

To learn more about the boons of artificial intelligence, and what new realms, it’s traversing across, follow us on DexLab Analytics. We are a leading Online Data Science Certification provider, excelling on online certificate course in credit analysis. Visit our site to enroll for high-end data analytics courses!


Interested in a career in Data Analyst?

To learn more about Data Analyst with Advanced excel course – Enrol Now.
To learn more about Data Analyst with R Course – Enrol Now.
To learn more about Big Data Course – Enrol Now.

To learn more about Machine Learning Using Python and Spark – Enrol Now.
To learn more about Data Analyst with SAS Course – Enrol Now.
To learn more about Data Analyst with Apache Spark Course – Enrol Now.
To learn more about Data Analyst with Market Risk Analytics and Modelling Course – Enrol Now.

6 Questions Organizations Should Ask About Big Data Architecture

6 Questions Organizations Should Ask About Big Data Architecture

Big data come with big promises, but businesses often face tough challenges to determine how to take big advantage of big data and deploy the effective architecture seamlessly into their system.

From descriptive statistics to AI to SAS predictive analytics – every single thing is spurred by big data innovation. At the 2017 Dell EMC World conference, which took place on Monday, the chief systems engineer for data analytics at Dell EMC, Cory Minton – gave a presentation simplifying the biggest decisions an organisation need to make when employing big data.

Also read: Big Data Analytics and its Impact on Manufacturing Sector

Let’s get started with 6 questions that every organization should ponder over before stepping into the tech space:

Buy or build?

Do you want to buy a successful data system or build one right from the scratch? Minton said, though buying offers simplicity and a shorter time to value, it comes at a hefty price. The building idea is good and provides huge scale and variety, but it is very complicated, and interoperability is one of the biggest issues faced by admins, who take this route.

Teradata, SAS, SAP, and Splunk can be bought, while Hortonworks, Cloudera, Databricks and Apache Flink are used to build big data systems.

Also read: What Sets Apart Data Science from Big Data and Data Analytics

Batch or streaming data?

Products like Oracle, Hadoop MapReduce and Apache Spark offers batch data – they are descriptive and can manage large chunks of data. On the other hand, Products like Apache Kafka, Splunk, and Flink creates potential predictive models, coupled with immense scale and variety.

Kappa or lambda architecture?

Twitter is the best example of lambda architecture. This kind of architecture works best as it gives the organisation access to batch and streaming insights along with balances lossy streams, as said by Minton. While, kappa architecture is hardware efficient and Minton recommends it for any newbie organisation starting fresh with data analytics.

Also read: How To Stop Big Data Projects From Failing?

Private or public cloud?

Ask your employees, about what kind of security platform they are comfortable working, and then decide.

Physical or virtual?

Minton said – a decade ago, the debate surrounding virtual or physical infrastructure used to gain more momentum. Now, things have changed. Virtualization has become so competitive that sometimes it outdoes physical hardware. Today, it stresses more on what works for our infrastructure rather than individual preferences.

Also read: Why Getting a Big Data Certification Will Benefit Your Small Business

DAS or NAS?

Minton said Direct-attached storage (DAS) is the only way to initiate a Hadoop cluster. Today, the tides are changing; with increasing bandwidth in IP networks, the Network-attached storage (NAS) option is becoming more feasible for big data implementation.

DAS is easily initiated and the model works well within software-defined concepts. NAS is efficient in handling multi-protocol needs, offers functionality at scale and addresses security and compliance issues.

For more big data related news, check out our blog section in DexLab Analytics. We are a pioneering data analyst training institute, offering excellent Big data hadoop certification training in Delhi.


Interested in a career in Data Analyst?

To learn more about Data Analyst with Advanced excel course – Enrol Now.
To learn more about Data Analyst with R Course – Enrol Now.
To learn more about Big Data Course – Enrol Now.

To learn more about Machine Learning Using Python and Spark – Enrol Now.
To learn more about Data Analyst with SAS Course – Enrol Now.
To learn more about Data Analyst with Apache Spark Course – Enrol Now.
To learn more about Data Analyst with Market Risk Analytics and Modelling Course – Enrol Now.

What to Expect: Top 4 Hadoop Big Data Trends 2018 Reigning the Healthcare Industry

What to Expect: Top 4 Hadoop Big Data Trends 2018 Reigning the Healthcare Industry

Of late, we have been scrounging through plenty of news about healthcare challenges and gruelling choices confronted by hospital authorities, administrators, researchers, pharmaceutical in-charges and clinicians. Coupled with that, consumers are battling increased costs without corresponding enhancement in health security or in the authenticity of clinical consequences.

However, just as every dark cloud has a silver lining – the healthcare industry is now at the threshold of a major transformation using the stroke of luck Big Data and Hadoop.

en-iot-feature-healthcare_system-380x260

In this blog, we are going to brash about 4 above the rest big data trends in 2018, and trust me they are mind blowing:

The patient is the king (well not literally!)

A supreme objective of modern healthcare facilities is to offer value-based and patient-centric service with the use of veritable health information technology in order to:

  • Improve healthcare coordination and quality
  • Lessen healthcare costs
  • Offer support for reclaimed payment structures

By leveraging information technology and concentrating on healthcare systems on patient results, a spectrum of doctors, health insurance, care and hospitals need to correspond with each other to customize care that is price effective, efficient in quality, transparent in delivery and billing and based on patient satisfaction level.


320x50

IOT is omnipresent, so why leave healthcare

If reports are right, over $120 billion has been spent on healthcare IOT over 4 years, ONLY. Most of the data derived by the healthcare IOT is unstructured, thus helming ways for the use of Hadoop and advanced big data analytics relying on Hadoop framework.  

healthcare-Internet-of-things

Advanced monitoring devices interacting with other patient devices could possibly reduce the chances of direct doctor’s intervention, and might substitute it with a phone call from the nurse. Moreover, other smart devices installed can detect if medicines have been consumed regularly at home from smart dispensers. In the event of failure, the device will instantly initiate a call to help patients take medications, properly. From this, you can understand the costs will fall drastically, while improving the patient care.

2

Call for cleansing – Curb waste, abuse and fraud

After suffering from spiralling healthcare costs for years, big data is a solace to our finances. By initiating predictive modelling structured on the Hadoop big data platform, identification of erroneous claims in a systematic and repeatable is possible, resulting in a generation of 2200% return on advanced big data technology.


picture1


Now, the healthcare organisations can inspect and evaluate patient records and billing anomalies and identify frauds. It has been made possible by going back in time to analyse unstructured datasets and implement machine learning algorithms to detect the inconsistencies.

Predict better outcomes with predictive analytics

Predictive Modelling is being used worldwide, by deriving data from EHRs (Electronic Health Records) to reduce mortality rates from diseases like congestive heart failure and sepsis. As you all know, Congestive Heart Failure (CHF) is one of the costliest health problems and needs huge healthcare spending. So, the earlier it is diagnosed the better it is, without getting into the expensive complications.

Predictive analytics combined with machine learning on large sample sizes, containing more patients’ data can expose all the nuances and sequences that couldn’t be uncovered previously.


Enjoy 10% Discount, As DexLab Analytics Launches #BigDataIngestion
DexLab Analytics Presents #BigDataIngestion


Concisely, the more healthcare organizations adopt Hadoop and advanced big data technology, the more profound will be the data dissemination across teams and partners, which will further boost patients’ easy cure and reduction in costs.

Promote your analytic skills with Big Data Hadoop certification in Gurgaon, offered by DexLab Analytics. Embrace and enrol for Hadoop certification in Delhi today, as the future is going to be ruled by Big Data.


Interested in a career in Data Analyst?

To learn more about Machine Learning Using Python and Spark – click here.
To learn more about Data Analyst with Advanced excel course – click here.
To learn more about Data Analyst with SAS Course – click here.
To learn more about Data Analyst with R Course – click here.
To learn more about Big Data Course – click here.

Call us to know more