Dexlab, Author at DexLab Analytics | Big Data Hadoop SAS R Analytics Predictive Modeling & Excel VBA - Page 44 of 80

Data Science and Machine Learning: In What State They Are To Be Found?

Keen to have a sweeping view of data science and machine learning as a whole? 

Want to crack who is playing tricks with data and what’s happening in and around the budding field of machine learning across industries?

Looking for ways to know how aspiring, young data scientists are breaking into the IT field to invent something new each day?

Hold your breath, tight. The below report showcases few of our intrinsic findings – which we derived from Kaggle’s industry-wide survey. Also, interactive visualizations are on the offer.

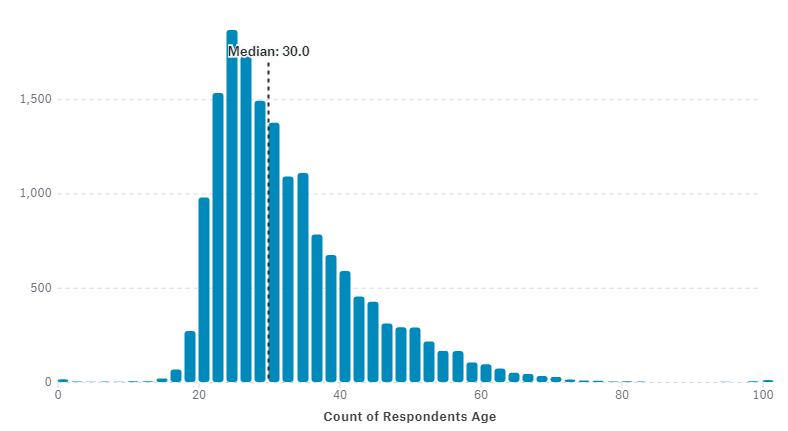
  1. On an average, data scientists fall under the age bar of 30 years old, but as a matter of fact, this age limit is subject to change. For example, the average age of data scientists from India tends to be 9 years younger than the average scientists from Australia.
  2. Python is the most commonly used language programs in India, but data scientists at large are relying on R now.
  3. Most of the data scientists are likely to possess a Master’s degree, however those who bags a salary of more than $150K mostly have a doctoral degree under their hood.

Who’s Using Data?

A lot of ways are there to nab who’s working with data, but in here we will fix our gaze on the demographic statistics and the background of people who are working in data science.

What is your age?

To kick start our discussion, according to the Kaggle survey, the average age of respondents was 30 years old subject to some variation. The respondents from India were on an average 9 years younger than those from Australia.

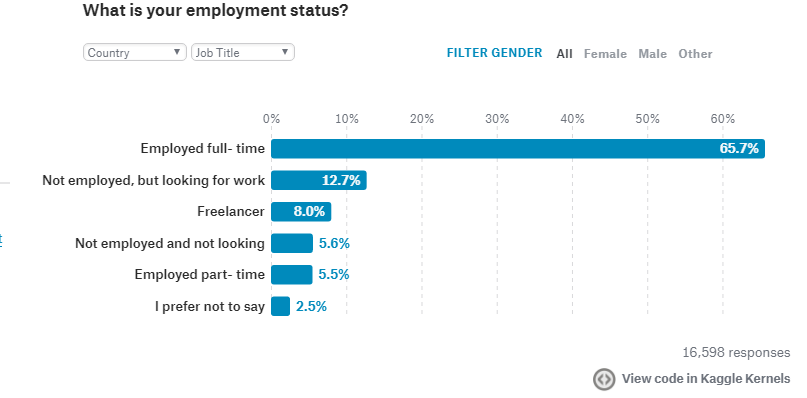
What is your employment situation?

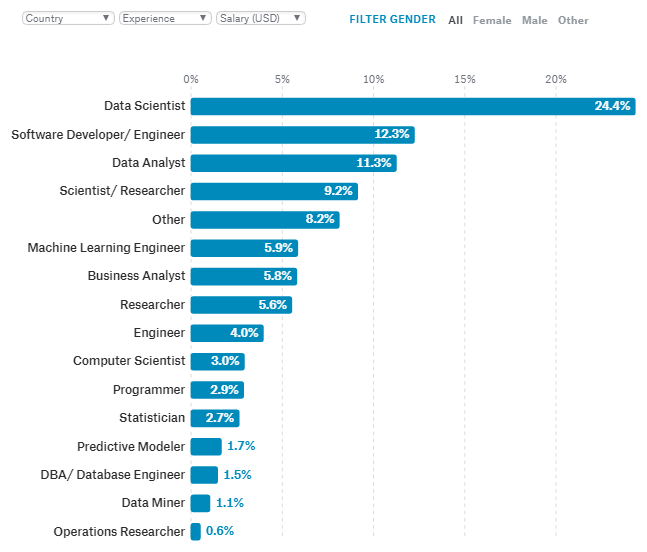
What kind of job title you bag?

Anyone who uses code for data analysis is termed as a data scientist. But how true is this? In the vast realm of data science, there are a series of job titles that can be pegged. For instance, in Iran and Malaysia, the job title of data scientist is not so popular, they like to call data scientists by the name Scientist or Researcher. So, keep a note of it.

How much is your full-time annual salary?

While “compensation and benefits” ranked a little lower than “opportunities for professional developments”, the best part remains it can still be considered a reasonable compensation.

Check out how much a standard machine learning engineer brings home to in the US

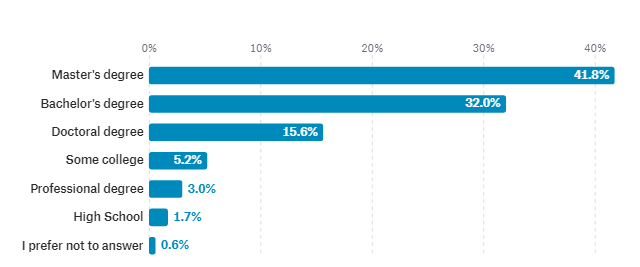
What should be the highest formal education?

So, what’s going on in your mind? Should you get your hands on the next formal degree? Normally, most of the data scientists have obtained a full-time master’s degree, even if they haven’t they are at least data analytics’ certified. But professionals who come under a higher salary slab are more likely to possess a doctoral degree.

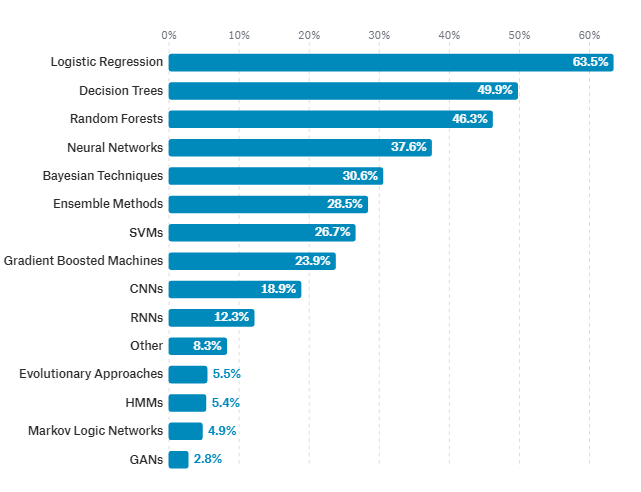
What are the most commonly used data science methods at work?

Largely, logistic regression is used in all the work areas except the domain of Military and Security, because in here Neural Networks are being implemented extensively.

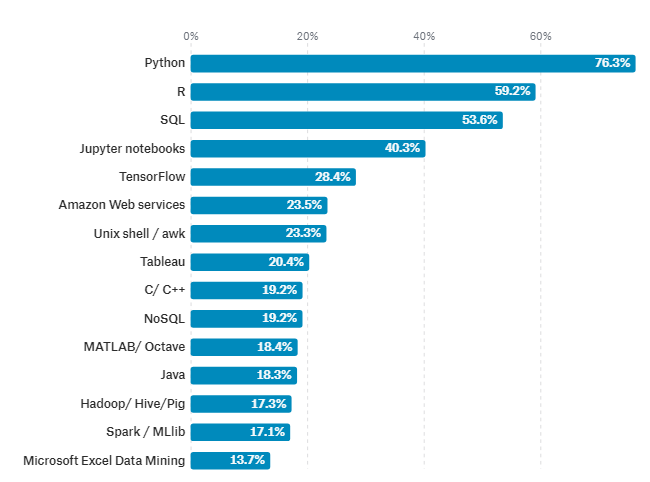
Which tool is used at work?

Python was once the most used data analytics tool, but now it is replaced by R.

The original article can be viewed in Kaggle.

Kaggle: A Brief Note

Kaggle is an iconic platform for data scientists, allowing ample scope to connect, understand, discover and explore data. For years, Kaggle has been a diverse platform to drag in hundreds of data scientists and machine learning enthusiasts, and is still in the game.

For excellent data science certification in Gurgaon, look no further than DexLab Analytics. Opt for their intensive data science and machine learning certification and unlock a string of impressive career milestones.


Interested in a career in Data Analyst?

To learn more about Data Analyst with Advanced excel course – Enrol Now.
To learn more about Data Analyst with R Course – Enrol Now.
To learn more about Big Data Course – Enrol Now.

To learn more about Machine Learning Using Python and Spark – Enrol Now.
To learn more about Data Analyst with SAS Course – Enrol Now.
To learn more about Data Analyst with Apache Spark Course – Enrol Now.
To learn more about Data Analyst with Market Risk Analytics and Modelling Course – Enrol Now.

R is Gaining Huge Prominence in Data Analytics: Explained Why

Why should you learn R?

Just because it is largely popular..

Is this reason enough for you?

Budding data analytics professionals look forward to learn R because they think by grasping R skills, they would be able to nab the core principles of data science: data visualization, machine learning and data manipulation.

Be careful, while selecting a language to learn. The language should be capacious enough to trigger all the above-mentioned areas and more. Being a data scientist, you would need tools to carry out all these tasks, along with having the resources to learn them in the desired language.

In short, fix your attention on process and technique and just not on the syntax – after all, you need to find out ways to discover insight in data, and for that you need to excel over these 3 core skills in data science and FYI – in R, it is easier to master these skills as compared to any other language.

Data Manipulation

As rightly put, more than 80% of work in data science is related to data manipulation. Data wrangling is very common; a regular data scientist spends a significant portion of his time working on data – he arranges data and puts them into a proper shape to boost future operational activities. 

In R, you will find some of the best data management tools – dplyr package in R makes data manipulation easier. Just ‘chain’ the standard dplyr together and see how drastically data manipulation turns out to be simple.

For R programming certification in Delhi, drop by DexLab Analytics.

2

Data Visualization

One of the best data visualization tools, ggplot2 helps you get a better grip on syntax, while easing out the way you think about data visualization. Statistical visualizations are rooted in deep structure – they consist of a highly structured framework on which several data visualizations are created. Ggplot2 is also based on this system – learn ggplot2 and discover data visualization in a new way.

However, the moment you combine dplyr and ggplot2 together, through the chaining technology, deciphering new insights about your data becomes a piece of cake.

Machine Learning

For many, machine learning is the most important skill to develop but if you ask me, it takes time to ace it. Professionals, who are in this line of work takes years to fully understand the real workings of machine learning and implement it in the best way possible.

Stronger tools are needed time and often, especially when normal data exploration stops producing good results. R boasts of some of the most innovative tools and resources.

R is gaining popularity. It is becoming the lingua franca for data science, though there are several other high-end language programs, R is the one that is used most widely and extremely reliable. A large number of companies are putting their best bets on R – Digital natives like Google and Facebook both houses a large number of data scientists proficient in R. Revolution Analytics once stated, “R is also the tool of choice for data scientists at Microsoft, who apply machine learning to data from Bing, Azure, Office, and the Sales, Marketing and Finance departments.” Besides the tech giants, a wide array of medium-scale companies like Uber, Ford, HSBC and Trulia have also started recognizing the growing importance of R.

Now, if you want to learn more programming languages, you are good to go. To be clear, there is no single programming language that would solve all your data related problems, hence it’s better to set your hands in other languages to solve respective problems.

Consider Machine Learning Using Python; next to R, Python is the encompassing multi-purpose programming language all the data scientists should learn. Loaded with incredible visualization tools, machine learning techniques, Python is the second most useful language to learn. Grab a Python certification Gurgaon today from DexLab Analytics. It will surely help your career move!


Interested in a career in Data Analyst?

To learn more about Data Analyst with Advanced excel course – Enrol Now.
To learn more about Data Analyst with R Course – Enrol Now.
To learn more about Big Data Course – Enrol Now.

To learn more about Machine Learning Using Python and Spark – Enrol Now.
To learn more about Data Analyst with SAS Course – Enrol Now.
To learn more about Data Analyst with Apache Spark Course – Enrol Now.
To learn more about Data Analyst with Market Risk Analytics and Modelling Course – Enrol Now.

The Future of Risk Management: Triggering a Technology Dividend

The Future of Risk Management: Triggering a Technology Dividend

Many factors are constantly shaping and reshaping the structure of risk management today – including global geopolitical inconsistency, macroeconomic headwinds and increasing number of cyber activities – which is extensively damaging and recurring. All this is leading to elevated risk perceptions.

The nature of risks has changed over the years too, as well as the manner of addressing them. Today, to mitigate risk issues, technology plays a crucial role. Headwinds like global and Asian accelerating debt levels, lower projection of productivity growth, increasing levels of policy uncertainty and constant increase of US interest have created a lot of prominent macroeconomic challenges, especially in export-oriented Asian economies. Topping that, budding risks from technological advancements are on the rise, exposing industries to newer challenges like cybersecurity and data fraud.

Explaining the Everlasting Bond between Data and Risk Analytics – @Dexlabanalytics.

As a result, the regulatory scenario of the world is also changing, especially after the global financial crisis. With a wide array of regulations introduced, the issue of risk management has started getting the desired prominence. These increasing regulations have compelled banks to accelerate their compliance activities, while giving increasing pressure on risk-management policymaking. The risk management teams now need to be constantly on a lookout for newer uncertainties – the key to address this concern remains productivity gains, but for that technology needs to be employed to the vast extent.

Cyber Value-at-Risk Model: Quantifying the Value-at-Risk – @Dexlabanalytics.

Hitting a technology dividend

Advanced data analytics, contemporary data and NLP coupled with process digitization offers new robust opportunities for effective market risk management. The technological opportunities can be realized throughout various key functions and levels, but it is the duty of the risk professionals to chalk out a more affordable and fruitful approach to address risk-related issues.

A New Course Alert! DexLab Analytics Launches Market Risk Analytics and Modelling – @Dexlabanalytics.

Check out these 3 principal levers to nab potential opportunities:

Data – Data is the new powerful combat weapon. Financial institutions consist of huge piles of data, where internal and external sources of data continuously pour in at an accelerating rate.  Data, in every form – including transaction, social media, and other sources helps discover real-time customer insights and generate dividends thereafter.

Analytics – Nowadays, machine learning, NLP, advanced analytics and self-learning algorithms are widely available and at achievable prices. The best example to show how advanced analytics is boosting risk management is improving debt collection.

As per conventional debt repayment collection procedure, a lot many calls were asked to make, out of which very few turned out to be successful. But now, with advanced analytics, a set of high-end predictive models are developed to fire up decision-making process. After this, an improved insight about customers can be curated, which can further be developed with better prediction quality.

Processes – With digitization, one gets the opportunity to automate and design risk-monitoring processes to mitigate emerging risks. Nowadays, several financial institutions are implementing machine learning and transaction data to automate monitoring of conduct risk.

Subject to the extent of digitization, the change in factors for risk organization is proposed – in the beginning of digitization, one expects 15-20 percent efficiency gains, while a 60-70% improvement is to be expected in case of a fully digitized risk function, which is quite a show!

Market Risk Analytics: What It is All About – @Dexlabanalytics.

Do you want to know more about market risk modelling techniques? Drop by DexLab Analytics; being a one-stop-destination for Market Risk Modelling using SAS, it boasts of superior training and well-researched study materials.


Interested in a career in Data Analyst?

To learn more about Data Analyst with Advanced excel course – Enrol Now.
To learn more about Data Analyst with R Course – Enrol Now.
To learn more about Big Data Course – Enrol Now.

To learn more about Machine Learning Using Python and Spark – Enrol Now.
To learn more about Data Analyst with SAS Course – Enrol Now.
To learn more about Data Analyst with Apache Spark Course – Enrol Now.
To learn more about Data Analyst with Market Risk Analytics and Modelling Course – Enrol Now.

Internet of Things: It’s Much More Than What It Appears to Be

Internet of Things: It’s Much More Than What It Appears to Be

What’s all the hype about “the next big thing”? Have you got it yet? Nope? It’s not owing to a lack of imagination, but an observation.

Currently, the Internet of Things is the big buzz. It’s all about enhancing machine-to-machine communication – being structured on cloud computing and systems of data-gathering sensors, the connection is entirely virtual, mobile and instantaneous.

Big Data And The Internet Of Things – @Dexlabanalytics.

What is IoT?

In simple terms, the concept of IoT stresses on connecting any device with the Internet – including cellphones, headphones, washing machines, lamps, coffee makers, wearable devices and almost anything that comes in your mind. The IoT is a colossal network of connected Things (inclusive of people) – the famous analyst firm Gartner says by 2020 there will be more than 26 billion connected devices in this world.

Explaining the Everlasting Bond between Data and Risk Analytics – @Dexlabanalytics.

What makes it so popular?

As we now know, IoT is a network of things and people, where communication takes place through numerous wireless and wired technologies and it comes with a wide set of advantages. Following are some of the advantages of this new breed of technology:

A better, less-complicated life

Imagine a life, where what you seek will be delivered to you right away, before you even ask for it. It may appear to you that you are dropped right into a scene from your favorite sci-fi movie or novel – the moment your morning alarm starts ringing, your bathtub automatically starts getting filled with hot water; when you leave your home, the lights get turned off automatically and doors lock itself on its own; your car takes you to the office through the less-congested roadway and when you return home, your home lights automatically start to switch on and lastly your air conditioner adjusts the temperature of your room once you are ready to hit the bed. Proper use of IoT makes your life easier and effortlessly simple.

Is Change the Only Constant: How Analytics has Changed, while Staying the Same Over the Last Decade – @Dexlabanalytics.

Less accident, better safety

How would it be if for an example you get a heart attack while driving back home and your smartwatch detects it and deploys autopilot mode in your car so that it straightaway takes you directly to the nearest hospital? On the way, your cellphone can dial up the hospital staffs and inform them about the current condition of the patient to help you get the best treatment possible.

Harnessing the power of data

Utilizing the power of data is awesome. Harnessing data to simplify things is the next best thing in today’s world. Living a life straight out of sci-fi movies is awesome, but practically, there’s still some time left for IoT to become a hardcore reality. Once IoT makes its way into our lives, a set of smart devices powered by sensors will take charge and make almost everything possible – whether it’s switching on the AC automatically when a person enters the room or driving a car to a destination without any driver.

IoT helps in taking better decisions in the best interest for businesses

Beyond making your lives easier, IoT possesses a bunch of capabilities – it’s a robust technology that collects the most valuable resource, i.e. data. Data helps businesses take better, well-informed decisions. 

Of all the recent technological developments, Internet of Things is considered to be one of the biggest trends to watch out for. In the next 5 years, it’s going to change lives forever!

To know more about the Internet of Things and more such digital trends, why don’t you settle for a good business analytics course in Delhi! DexLab Analytics is a premier Data Science training institute Gurgaon that offers hands-on experience to students alike.


Interested in a career in Data Analyst?

To learn more about Data Analyst with Advanced excel course – Enrol Now.
To learn more about Data Analyst with R Course – Enrol Now.
To learn more about Big Data Course – Enrol Now.

To learn more about Machine Learning Using Python and Spark – Enrol Now.
To learn more about Data Analyst with SAS Course – Enrol Now.
To learn more about Data Analyst with Apache Spark Course – Enrol Now.
To learn more about Data Analyst with Market Risk Analytics and Modelling Course – Enrol Now.

5 Quick-Fire Tips and Tricks from Dashboard Specialists

No two dashboards are similar. They cater to different audiences, serves distinct purposes, and address individual problems as unique as you.


5 Quick-Fire Tips and Tricks from Dashboard Specialists


In this blog post, we will talk about the 5 best practices to apply right now to create attractive dashboards, and engage users effectively.

Continue reading “5 Quick-Fire Tips and Tricks from Dashboard Specialists”

Explaining the Everlasting Bond between Data and Risk Analytics

Explaining the Everlasting Bond between Data and Risk Analytics


The use of data analytics is robustly expanding in the financial sector – and the risk landscape is changing pretty fast. Every day a new innovation in the field of risk analytics is making its way, and sometimes some new risks and its respective strategies are popping up just around the corner. The rise of big data, artificial intelligence and advanced analytics helps companies gain valuable cognizance from data. Computing power, the Internet of Things, drones and machine learning are some of the latest new-age tools to assist companies in taking better decisions, hence increase future profitability. Alike, risk managers implement market risk analytics and big data to manage their day-to-day work activities, while identifying, ascertaining and mitigating risks.

Continue reading “Explaining the Everlasting Bond between Data and Risk Analytics”

Is Change the Only Constant: How Analytics has Changed, while Staying the Same Over the Last Decade

Data analytics is evolving. Coupled with Big Data, it is changing the topography of almost everything.


Is Change the Only Constant: How Analytics has Changed, while Staying the Same Over the Last Decade


Each year, more and more companies are allocating their time and budget to exploit and understand vast pools of data strewn across them, both inside and outside company files. Of course, Big Data and Analytics is selling like a hot cake today, but what is its story of evolution? How the technology flourished 10 years back?

Continue reading “Is Change the Only Constant: How Analytics has Changed, while Staying the Same Over the Last Decade”

DexLab Analytics Organized Mock Interview and Resume Building Workshop by Industry Expert

data science

A constructive mock interview and resume building session is a game-changer. Imbibing in-demand analytic skills is tough, but gearing up to crack high-flying job interviews is tougher. And DexLab Analytics addressed that point by curating an intensive resume building workshop on 20th October 2017. The session was headed by Mr. Tanmoy Ganguli, Program Director, DexLab Analytics at the Gurgaon centre in three time slots: 2-4 PM, 4-6 PM, 6-8 PM.

What is a mock interview?

Mock interviews prepare you for the real interview challenge. They enable the candidates to gain some notion about what sort of things they are going to experience during real interviews, while helping them deal with hard times. Often, these kinds of preparatory interview workshops are organized by data science training institutes in Gurgaon that seek ways to train their students to explore the wide vistas of job opportunities across various industry domains. DexLab Analytics is one such pioneering institute that takes the initiative to cater for the needs of its aspiring students, and these kinds of resume building sessions work wonders.

Over a period of time, DexLab Analytics has garnered a lot of good reputation based on the level of training they provide. The trainers working here are industry experts possessing all the needful knowledge regarding this particular field of study, hence learning from them would be fun. Their intensive data analyst courses and workshops are prepared in tune with the latest industry trends and development taking place, hence are high-on-value.

The best part of the story here is that the intensive resume building workshop was conducted by none other than our very own honorable program director, Mr. Tanmoy Ganguli. He has been in this industry for years, and possesses incredible expertise in the domains of SAS, Credit Risk Modelling and Regression Models. Being a key influencer, the sessions presided by him are a sure not-to-miss things for students.

What people learned from this session?

Resume building and mock sessions drastically reduce the anxiety levels. They equip the candidate with the needful interview questions that might be asked in the actual one. The interviewer and the trainer who conducts such events feed the candidate with needful responses that precisely tackles a candidate’s potentials and shortcomings. No one is perfect; hence the mock interview sessions help the candidates in becoming a better person, both knowledge-wise and skill-wise.

So, if you are one of them who want to pull up your career dreams of bagging the highest-paying job in the world of analytics, DexLab Analytics would be the right place for you. Right from imparting crucial skill-based knowledge to providing needful advice regarding how to crack a job interview, the event organized by DexLab Analytics is the best way to gather extensive knowledge to nail the best job in town!

Interested in a career in Data Analyst?

To learn more about Machine Learning Using Python and Spark – click here.
To learn more about Data Analyst with Advanced excel course – click here.
To learn more about Data Analyst with SAS Course – click here.
To learn more about Data Analyst with R Course – click here.
To learn more about Big Data Course – click here.

Cyber Value-at-Risk Model: Quantifying the Value-at-Risk

Cyber Value-at-Risk Model: Quantifying the Value-at-Risk

Cybersecurity attacks are the new potent threat to businesses. Diligent professionals and big mouth board members have started reviewing their company’s cybersecurity frameworks, while establishing better security controls and discerning deeper insights about the business impact of cybersecurity attacks: what kind of risks are they exposed to? Are they expending too much and need to curtail down? What amount of risk can be reduced using the proposed info security budget? Cyber-insurance, will it fetch better results?

What objectives to secure with Cyber value-at-risk models?

This is the epic question that has triggered the development of Value-at-risk models, especially in the domain of information security. Also known as Cyber VaR, these models are a game-changer. They offer a sound base for quantification of information risk coupled with infusing discipline into the whole process.

Market Risk Analytics: What It is All About – @Dexlabanalytics.

The objective of VaR is:

  • To help risk professionals formulate the notion of cyber risk in plain financial language without using any technical jargons.
  • To enable business professionals achieve a standard balance between safeguarding an organization and running the business by making cost-effective decisions.

Enterprises powered by VaR models for cybersecurity make complicated decision-making as easy as pie. They trigger risk-related discussions, where risks become more consistent, and business-goal driven.

A New Course Alert! DexLab Analytics Launches Market Risk Analytics and Modelling – @Dexlabanalytics.

What exactly is cyber VaR?

In the world of finance, value-at-risk modeling is the statistical methodology to appraise the level of financial risk that a firm is exposed to over a specific period of time.

The VaR is ascertained using these three variables:

  • The amount of conjectured loss
  • The probability of that amount of loss
  • The time frame

Probabilities are effective to evaluate likely losses from the cyber attacks during a specific time period. Top notch global organizations, like World Economic Forum and several regulatory bodies, like The Open Group are revolutionizing the concept of cyber VaR models.

fi1-2

What is its benefit?

VaR was initially developed in 1990’s to boost the investment banking sector, wherein managers were to identify the risks that popped up daily in multiple market reports. From the name itself, you can understand, it is more likely a measurement tool to analyze the financial impact of risky events within a particular time frame.

The most beneficial effect of VaR is that it not only quantifies risk but also pens it down in economic terms that are easily understood by all. It also assists in mitigating long-term challenges by aggregating cyberrisk with various other operational risks within an enterprise risk management system.

Here’s All You Need to Know about DexLab Analytics’ Market Risk Modelling Live Demo Session – @Dexlabanalytics.

How to determine the value of cyber VaR?

 CISOs, Chief information security officers decipher what exactly VaR offers in terms of cyberrisk management. This hi-tech concept is too good to help with crucial decision-making, like addressing cyberrisk appetite and defining the optimal allocation of cyber risk management resources.

Market risk analytics is a new concept in the make. Many organizations have realized its crucial importance, while many are yet to decipher. For the best enterprise risk management certification, drop by DexLab Analytics. They are a leading economic capital model training institute offering state-of-the-art courses to the candidates.


Interested in a career in Data Analyst?

To learn more about Data Analyst with Advanced excel course – Enrol Now.
To learn more about Data Analyst with R Course – Enrol Now.
To learn more about Big Data Course – Enrol Now.

To learn more about Machine Learning Using Python and Spark – Enrol Now.
To learn more about Data Analyst with SAS Course – Enrol Now.
To learn more about Data Analyst with Apache Spark Course – Enrol Now.
To learn more about Data Analyst with Market Risk Analytics and Modelling Course – Enrol Now.

Call us to know more