Dexlab, Author at DexLab Analytics | Big Data Hadoop SAS R Analytics Predictive Modeling & Excel VBA - Page 43 of 80

Interactive Data Discovery and Predictive Analytics: Extract Useful Knowledge from Data

Impressive predictive analytics coupled with interactive data discovery technology enable rational SAS analysts to distinguish pertinent trends and interactions in datasets, and pan out questions from all dimensions. This smashing concoction of technologies also allows business users to exchange ideas with pundits, to create, modify and pick the best predictive models, constructively.


Interactive-Data-Discovery-and-Predictive-Analytics-Extract-Useful-Knowledge-from-Data


A comprehensive SAS solution might be the key to empower users in taking better business decisions, without wasting much time. This kind of interactive solution must involve ceaseless communication, giving enough room to even non-technical users to explore data visually, develop analytic models, and share fruitful results.  

Continue reading “Interactive Data Discovery and Predictive Analytics: Extract Useful Knowledge from Data”

Why Data Science Matters More Than Data Scientists?

More is always better, isn’t it? But does it always holds true, especially when it comes to customer data? Maybe not, because business is all about extracting meaningful insights from data, and if that cannot be acted upon then it is of no good.

 
Why Data Science Matters More Than Data Scientists?
 

Recently, Accenture concluded that one of the greatest challenges that marketers face nowadays is to discover the right ways to turn data into productive insights and then into action. For that, you would need analytics professionals who do know how to collect, store and integrate information, while mastering the technology aspect.

Continue reading “Why Data Science Matters More Than Data Scientists?”

How to Leverage AI Strategy in Business?

How to Leverage AI Strategy in Business?

Everyday some company or the other are deploying AI into their systems – whether its Spotify’s machine learning program or Bank of America’s chatbot Erica – it seems AI has broken the shackles and left the machine room to enter the mainstream business.

Today’s AI algorithms are framed on remarkably factual machine sight, speech and hearing, and they have easy access to global cache of information. Thanks to Deep Learning, meteoric growth in data and other cutting edge AI techniques, AI performance is staggeringly improving. With these developments, it may seem possible for CIOs, enterprise architects, application managers who are still in nascent stage in gaining expertise in AI to feel like they are lagging behind somewhere. Contrarily, they are doing well for themselves.

2

How?

No second thoughts, a majority of data architects are still learning AI technology so as to develop their adoption strategy. AI is an ever-evolving technology – constant new developments and breakthroughs are emerging out every day, hence crafting a particular strategy might be difficult at times. Luckily, tech oracles like Whit Andrews, VP distinguished analyst, Gartner, are able to pin down distinct trends that determines the direction of AI in the business, while leveraging its capabilities to the fullest.

Browse through our intensive Data Science with Python Courses – they are a real treat to satiate the analytics hunger!

Check out these three trends that Andrews focuses on to develop formidable AI strategy for your business setup:

Data Science and Machine Learning: In What State They Are To Be Found? – @Dexlabanalytics.

AI will mushroom normal, contextual user-machine interfaces

Google Home and Amazon Echo have penetrated the homes of thousands, taking the consumer space by a storm. Human-computer interaction is now shifting its base from tactile touchscreens and keyboards to voice – the voice recognition is not only limited to distinct commands but deciphers normal human speech.

Natural language processing (NLP) is the reason behind such intrinsic advancements – and we can’t thank more! NLP and natural language generation have improved operations. The workers employed in parts of Eastern Europe can now talk to their system in their own language and grasp the things that need to be done to complete their designated work, making the whole system work seamlessly.

Incredible Tech Transformation: How Machine Learning is changing the Scope of Business – @Dexlabanalytics.

IoT is the future of AI and Fluid Application Integration

IoT devices gather data from the real world, exchange the data, and perform tasks sent through the internet. In general, they are simple in make but when combined with AI, they can rock the world. How would it be if you find an AI-powered IoT that receive orders, grab products and pack them in containers to be shipped across! Impressive, right?

Besides, AI works upon boosting existing organization applications. AI is like a magical stone that improves customer engagement and support, and Bank of America’s chatbot Erica is a perfect example of that.

The Math Behind Machine Learning: How it Works – @Dexlabanalytics.

A complex computing ecosystem will surface out with AI at the center

While companies diversify their systems, computing ecosystem strives to be the beacon of hope – it includes an intricate mix of customers, staffs, IoT devices, applications and data, coupled with AI in the nucleus. This will ensure:

  • Better interaction between people and devices
  • Proper communication between applications
  • And everything in between

No wonder, such ecosystems presents organizations more integrated automation, deeper insight, and better customer experience. Moreover, Gartner has predicted that more virtual agents will get involved in a majority of business interactions between organizations and individuals by 2020 – so the rise of machines is here, and we are extremely excited about it!

Help develop a well-devised AI strategy – with DexLab Analytics. Our consultants will feed you meaningful information on everything related to AI and machine learning. Our machine learning training course is impressive, and if you want to excel in machine learning training, drop by DexLab Analytics. We have a lot of things in store for you!


Interested in a career in Data Analyst?

To learn more about Data Analyst with Advanced excel course – Enrol Now.
To learn more about Data Analyst with R Course – Enrol Now.
To learn more about Big Data Course – Enrol Now.

To learn more about Machine Learning Using Python and Spark – Enrol Now.
To learn more about Data Analyst with SAS Course – Enrol Now.
To learn more about Data Analyst with Apache Spark Course – Enrol Now.
To learn more about Data Analyst with Market Risk Analytics and Modelling Course – Enrol Now.
Here’s How to Make Data More Actionable for Better Decision-making

Every customer demand needs to be fulfilled, and CEO’s expect marketing analysts to deliver them. Being a key marketing initiative, optimizing every customer experience is a significant deal to seal for marketers all around the globe.


Here’s How to Make Data More Actionable for Better Decision-making


Data, of course, plays a crucial role in marketing endeavors – but only the data that is interpretable makes sense, rendering other data useless. To turn data into actionable, organizations need to understand the accuracy of data and in the process should be successful in turning insights into action.

Continue reading “Here’s How to Make Data More Actionable for Better Decision-making”

Risk Analytics Market: Serious Growth Rate Projection for 2017-2021

Want to get to the core of understanding risk within various business frameworks? The answer is Risk Analytics. This new breed of data analytics facilitates organizations in precisely defining, recognizing and managing their risk, and its need is going to increase in the coming few years. New developments in risk analytics are gaining limelight and bringing a notable transformation in the market, while enhancing its overall capability.

 
Risk Analytics Market: Serious Growth Rate Projection for 2017-2021
 

Recently, a team of analysts had eureka moment – they introduced a new concept of real-time risk analytics – it is nothing but a modern, more advanced version of traditional risk analytics methods. Here, the prediction is based on real-time data – it processes, examines and determines risk all on a real-time basis – hence top notch financial institutions are putting real-time risk analytics to best use to manage and mitigate associated risks. Several asset management, portfolio management and hedge fund firms, and investment banks are relying on this mode of risk analytics to modify their operating principles to play in accordance with investment and market shifts.

Continue reading “Risk Analytics Market: Serious Growth Rate Projection for 2017-2021”

Market Risk Analytics: How Top Notch Companies Are Assessing Intricate Risks​

Risk analytics tools boost operational efficiency. But do you know what tools to implement to derive the best results?

 
Market Risk Analytics: How Top Notch Companies Are Assessing Intricate Risks
 

With the burgeoning demand for big data all over the world, major corporate houses are taking risk analytics – the process of collecting, analyzing and measuring real-time data to forecast future risk for improved decision-making – to a new high.

Continue reading “Market Risk Analytics: How Top Notch Companies Are Assessing Intricate Risks​”

Credit Risk Modelling: A Basic Overview

Credit Risk Modelling: A Basic Overview

HISTORICAL BACKGROUND

The root cause for the Financial Crisis which stormed the globe in 2008 was the Sub-prime crisis which appeared in USA during late 2006. A sub-prime lending practice started in USA during 2003-2006. During the later parts of 2003, the housing sector started expanding and housing prices also increased. It has been shown that the housing prices were growing exponentially at that time. As a result, the housing prices followed a super-exponential or hyperbolic growth path. Such super-exponential paths for asset prices are termed as ‘bubbles’ So USA was riding a Housing price bubble. Now the bankers, started giving loans to the sub-prime segments. This segment comprised of customers who hardly had the eligibility to pay back the loans. However, since the loans were backed by mortgages bankers believed that with housing price increases the they could not only recover the loans but earn profits by selling off the houses. The expectations made by the bankers that asset prices always would ride the rising curve was erroneous. Hence, when the housing prices crashed the loans were not recoverable. Many banks sold off these loans to the investment banks who converted the loans into asset based securities. These assets based securities were disbursed all over the globe by the investments banks, the largest being done by Lehmann Brothers. When the underlying assets went valueless and the investors lost their investments, many of the investment banks collapsed. This caused the Financial Crisis and a huge loss of investors and tax-payers wealth. The involvement of Systematically Important Financial Institutions (SIFIs) and Globally Systematically Important Financial Institutions (G-SIFIs) into the frivolous lending process had amplified the intensity and the exposure of the crisis.

Understanding Credit Risk Management With Modelling and Validation – @Dexlabanalytics.

SYSTEMATICALLY IMPORTANT FINANCIAL INSTITUTIONS AND THEIR ROLE IN SYSTEMIC STABILITY

A Systematically Important Financial Institution (SIFI) is a bank, insurance company, or other financial institutions whose failure might trigger a financial crisis.

If a SIFI has the capacity to bring in a recession across the globe then it is known as a Globally Systematically Important Financial Institution (G-SIFI). The Basel Committee follows an indicator based approach for assessing the systematic importance of the G-SIFIs. The basic tenets of this approach are:

  1. The BASEL committee is of the view that the global systemic importance should be measured in terms of the impact that a failure of a bank can have on the global financial system and wider economy rather than the risk that the failure can occur. So, the concept is more of a global, system wide, loss given default (LGD) concept rather than a probability of default (PD) problem.
  2. The indicators reflect the following metrics: size of banks, their interconnectedness, the lack of availability of substitutable or financial institution infrastructure for provided services, their global activity, their complexity etc. Each of these are defined as:

(i) Cross-Jurisdiction: The indicator captures the global footprints of the banks. This indicator is divided into two activities: Cross Jurisdictional claims and Cross Jurisdictional liabilities. These two indicators measure the banks activities outside its home relative to overall activity of other banks’ in the sample. The greater the global reach of the bank, the more difficult is it to coordinate its resolution and the more widespread the spill over effects from its failure.

(ii) Size: Size of a bank is measured using the total exposure that it has globally. This is the exposure measure used to calculate Leverage ratio. BASEL III paragraph 157 uses a particular definition of exposure for this purpose. The score of each bank for this criterion is calculated as its amount of total exposure divided by the sum of total exposures of all banks in the sample.

(iii) Interconnectedness: Financial distress at one institution can materially raise the likelihood of distress at other institutions given the contractual obligations in which the firms operate. Interconnectedness is defined in terms of the following parameters: (a) Inter-financial system assets (b) Inter-financial system liabilities (c) The degree to which a bank funds itself from the other financial systems.

(iv) Complexity: The systemic impact of a bank’s distress or failure is expected to be positively related to its overall complexity. Complexity includes: business, structural and operational complexity. The more complex the bank is the greater are the costs and time needed to resolve the banks.

Given these characteristics, it was important to apply different restrictions to keep the lending practices of the banks under control. Frivolous lending done by such SIFIs had resulted in the financial crisis 2008-09. Post the crisis, regulators became more vigilant about maintaining appropriate reserves for banks to survive macroeconomic stress scenarios. Three major sources of risks to which banks are exposed to are: 1. Credit Risk 2. Market Risk 3. Operational Risk. Several regulations

have been imposed on banks to ensure that they are adequately capitalised. The major regulatory requirements to which banks need to be compliant with are:

  1. BASEL 2. Dodd Frank Act Stress Testing 3. Comprehensive Capital Adequacy Review.

Before looking into the Regulatory frameworks and their impact on the Credit Risk modelling, let us form an understanding of the framework of the Bank Capital.

Risk Management in a Commercial Lending Portfolio with Time Series and Small Datasets – @Dexlabanalytics.

CAPITAL STRUCTURE OF BANKS

The bank’s capital structure is comprised of two main components: 1. Equity Capital of Banks 2. Supplementary capital of banks. The Equity capital of banks are the purest form of banking capital. This is true or the actual capital that a bank has and it has been raised from the shareholders. The supplementary capital of banks comprises of estimated capital such as allowances, provisions etc. This portion of the capital can easily be tampered by the management to meet undue shareholders expectations or unnecessarily over reserve capital. Thus, there are strong capital norms and regulations around the supplementary capital. The two tiers of capital are: Tier1 and Tier2 capital. Tier1 capital is also decomposed into two parts: Tier1 Common capital and Tier1 capital.


Tier1 common capital = Common shareholder’s equity-goodwill-Intangibles. Goodwill and intangibles are no physical capital. In scenarios, where the goodwill and intangible assets are stressed, the capital in the banks would deteriorate. Therefore, they cannot be added to the company’s tier1 capital. Only the core or the physical amount of capital present in the bank account is the capital.

Tier1 Capital = Total Shareholders’ equity (Common + Preffered stocks) -goodwill -intangibles + Hybrid securities.

Tier 1 is the core equity capital for the bank. The components of Tier1 capital are common across all geographies for the banking system. Equity capital includes issued and fully paid equities. This is the purest form of capital that the bank has.

Tier2 Capital: tier 2 capital comprises of estimated reserves and provisions. This is the part of capital which is used to cushion against expected losses. Tier 2 capital has the following composition:Tier 2 = Subordinated debts +Allowances for Loans and lease losses + Provisions for bad debts -> This portion of the capital is reserved out of profits. Hence,

managers always try to under report these parameters to meet shareholder’s expectations. However, under reserving often poses the chances of bankruptcies or regulatory penalties. Total Capital of a Bank = Tier 1 capital + Tier 2 Capital

Explaining the Everlasting Bond between Data and Risk Analytics – @Dexlabanalytics.

CALCULATION OF CAPITAL RATIOS

Every bank faces three main types of risks: 1. Credit risk 2. Market Risk 3. Operational risk. Credit Risk is the risk that arises from lending out funds to borrowers, given their chances of defaulting on loans. Market Risk is the risk that the bank faces due to market fluctuations like stock price changes, interest rate risk and price level fluctuation etc. Operational risk occurs as a failure of the operational processes. The exposure of the banks to these risks differ from bank to bank. So the capital that they to set aside would differ based on the exposure to risk. Therefore, regulators have defined a metric called Risk Weighted Assets (RWA) to identify the exposure of the bank’s assets to risk. Every bank must keep aside their capital relative to the exposure of their asset to risk. The biggest advantage of RWAs is that they not only include On-balance sheet items but off-balance sheet items as well. Banks need to maintain their Tier1 common capital, tier1 capital and tier2 capital relative to their RWAs. Thus, arises the Capital ratios.


Total RWA = RWA for Credit Risk + RWA for Market Risk + RWA for Operational Risk

Tier1 Common Capital Ratio = tier1 common capital / RWA (CR + MR + OR)

Tier1 Capital Ratio = Tier1 Capital / RWA (CR+MR+OR)

Total Capital Ratio = Total capital/ RWA(CR+MR+OR)

Leverage Ratio = Tier1 Capital / Firms consolidated assets

Regulators require some critical cut-offs for each of these ratios:

Tier1 Common Capital Ratio > = 2% all times

Tier1 Ratio >= 4% all times

Tier 2 capital cannot exceed Tier1 capital

Leverage ratio > = 3% of all times.


In the next blog we explore how the credit risk models help in ensuring the capital adequacy of the banks and in the business risk management.


Looking for credit risk analysis course online? Drop by DexLab Analytics – it offers excellent credit risk analysis course at affordable rates.


Interested in a career in Data Analyst?

To learn more about Data Analyst with Advanced excel course – Enrol Now.
To learn more about Data Analyst with R Course – Enrol Now.
To learn more about Big Data Course – Enrol Now.

To learn more about Machine Learning Using Python and Spark – Enrol Now.
To learn more about Data Analyst with SAS Course – Enrol Now.
To learn more about Data Analyst with Apache Spark Course – Enrol Now.
To learn more about Data Analyst with Market Risk Analytics and Modelling Course – Enrol Now.

Data to Fill in the Gaps: Using Data Analytics to Seek Retail Advantage

Retailers need to know their customers well – who they are, what stuffs they like to buy, how they would pay and what they think about the product or service. The best part is that there’s an ocean of data now available to fill in the gaps. Every time a customer visits the store, a long trail of customer data churns out for the retailers to explore.

 
Data to Fill in the Gaps: Using Data Analytics to Seek Retail Advantage
 

With the help of this data, the retailers improve sales figures, customer service and interaction and their product offerings. Leveraging data is crucial. According to Gartner, retailers seek advanced analytic capabilities to shine bright in this age of digitized market solutions.

Continue reading “Data to Fill in the Gaps: Using Data Analytics to Seek Retail Advantage”

10 Amazing Excel Templates to Help Maintain an Organized Budget

10 Amazing Excel Templates to Help Maintain an Organized Budget

Managing a proper budget is an essential task. Professionals working in enterprises are somehow involved in performing this task to some degree. Fortunately, a handful number of budgeting Excel templates is available online – check out some of our favorites:

Back to the basics, budget is something more than an educative, future projection of what should happen to a company’s financial position over a specific course of time, based on the latest trends, current data and previous history. The accuracy of the entire forecast depends on the quality of financial data accumulated during the budget period – it is here that a robust set of data collection tools saves the day.

Here’s a roundup of some of the most useful and easy-to-use budget-related MS Excel templates – most of them are available and are for free. Let’s check them out:

Microsoft Office Templates

When it comes to software, Microsoft remains unbeatable. It offers few applaud-worthy customizable office templates that help you become more productive in implementing programs, perform tasks and track financial budgets. Some of them are below:

Business Expense Report

Business travel expense report is one of the most popular budget reporting activities. For reimbursement of travel expenses, the employee needs to present detailed accounts of expenditures. The Excel template in here is easy to fill up, less time-consuming and removes the frustration caused due to tracking expenses in a business trip.

Project Budget

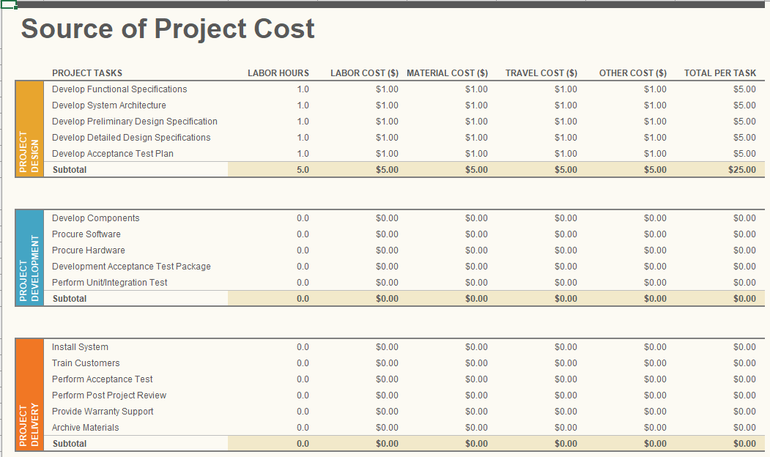
Project Budget template helps you evaluate your project’s design, development and delivery costs so as to monitor actual expenses that occur thereafter.


bfreeexcelbudget

Profit and Loss Statement

An all-inclusive profit and loss statement is fundamental for any enterprise. Whether it’s on a departmental level or encompassing an entire organization, determining profit and loss in the financial statement is important to put into focus the problematic areas of your business. The Excel template helps in calculating both the actual and budget revenues and expenses over a pre-determined period of time.

Balance Sheet

Balance Sheet is an effective financial budgetary document that enlists all the assets and liabilities, while evaluating their budgetary values, depreciation rates and amortization records, and the job gets easier when it’s done on an Excel template.

Activity-based Cost Tracker

The activity-based cost tracker template provides you a visual representation of standard, administrative, direct and indirect costs in relation to production. It also helps in monitoring the cost of each unit, while helping you manipulate your budget plan, if other factors, including costs fluctuate.

Small Business Cash Flow Projection

Managing cash flow is more significant than determining profit and loss and balance sheet and by properly using the Excel template small businesses will do well for themselves anytime.

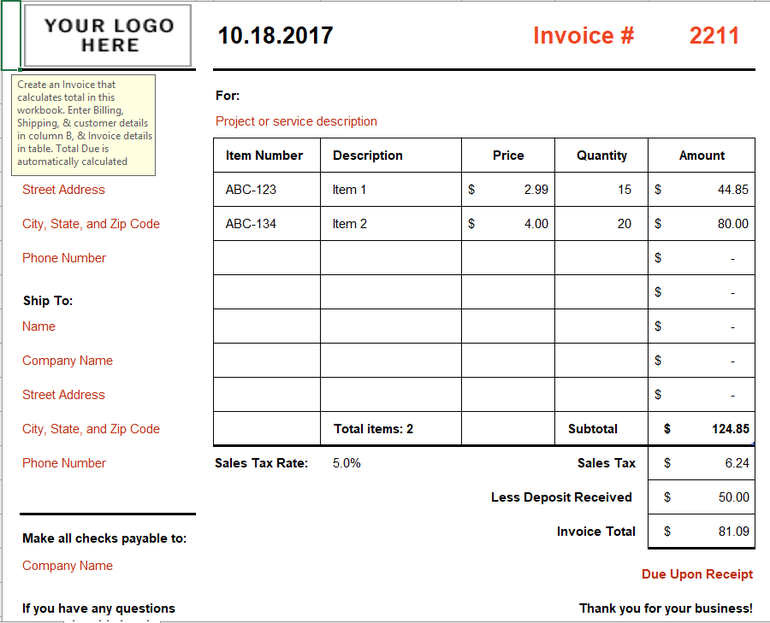
Simple Invoice

In the business circle, an Excel template on invoice gains a lot of accolades. This kind of Excel template automatically calculates the totals and subtotals so that the businesses don’t have to lose any of its valuable time.

cfreeexcelbudget

Beyond the jurisdiction of Microsoft, here are few other budget-related Excel templates:

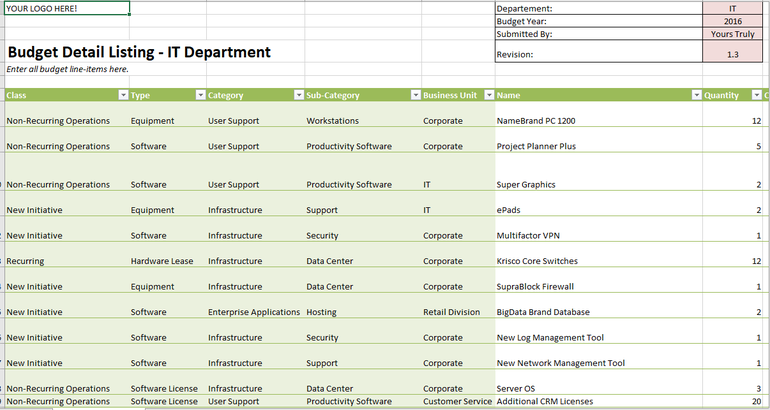
Year-round IT Budget Template

From the curators of Tech Pro Research team, this cutting edge Excel template helps you track all your spending, administer unplanned expenditure, classify expenses, and highlight key data, like cost of hiring new recruits, contract end dates and recurring payments.


afreeexcelbudget

Systems Downtime Expense Calculator

Taking care of an enterprise network is the most demanding job role for any IT administrator. Nothing in this wide world will be more traumatic than network downtime. Hence, this Excel template assist you place a dollar amount on your network downtime.

Computer Hardware Depreciation Calculator

This Excel worksheet helps you determine depreciation for your equipment – finding the rate of depreciation is not a piece of cake – there are many methods of deprecation to take into account.

Do you want to know more about how to use MS Excel for better budgeting for your business? Advanced Excel course by DexLab Analytics would be perfect for you. Excel certification in Delhi helps you grow in your career, so enroll today!


Interested in a career in Data Analyst?

To learn more about Data Analyst with Advanced excel course – Enrol Now.
To learn more about Data Analyst with R Course – Enrol Now.
To learn more about Big Data Course – Enrol Now.

To learn more about Machine Learning Using Python and Spark – Enrol Now.
To learn more about Data Analyst with SAS Course – Enrol Now.
To learn more about Data Analyst with Apache Spark Course – Enrol Now.
To learn more about Data Analyst with Market Risk Analytics and Modelling Course – Enrol Now.

Call us to know more