Dexlab, Author at DexLab Analytics | Big Data Hadoop SAS R Analytics Predictive Modeling & Excel VBA - Page 39 of 80

Here’s the Most Creative Ways to Embed Google Trends Data in Tableau Dashboard

Tableau and Google Trends? Wow, what a smashing combination to tick all the right boxes!!

Here’s the Most Creative Ways to Embed Google Trends Data in Tableau Dashboard

Also, you would be more than happy to know how some sections in your data have gotten along in search over time as compared to the others. Undeniably.

Continue reading “Here’s the Most Creative Ways to Embed Google Trends Data in Tableau Dashboard”

How Much Excel Excels in Deriving Rich ‘Insights’ from Your Data

For millions, Excel is the ultimate tool to understand data and frame insights. It makes analysis easy as pie and intuitive for all. Those who are well acquainted with Excel might know about Insights – it is the newest artificial intelligence-backed capability that rolled out in preview to Office Insiders last month.

How Much Excel Excels in Deriving Rich ‘Insights’ from Your Data

A quick note on Insights

Insights is a brand new service used to highlight patterns it identifies from your data, aiding you discover and inspect new insights, like outliers, trends and several other relevant visualizations and analyses. It will take special care to find out intriguing trends in your data and offer concise summaries with charts and PivotTables. As it’s powered by machine learning, the capability to churn out advanced analysis tends to increase as usage grows.

Continue reading “How Much Excel Excels in Deriving Rich ‘Insights’ from Your Data”

Top 4 Tableau Things That Changed the Way I Visualize Data

Top 4 Tableau Things That Changed the Way I Visualize Data

I love Tableau. I found it to be amazing and the best way to visualize data and develop fabulous reports and analysis. 4 years and still counting, I have come across various advanced features and concepts regarding Tableau, which actually enhanced the way I see Tableau as a fantastic tool for data representation. If I could go back in time and preach 4 Tableau concepts, this is what I would have liked to cover:

The fight between Green & Blue

Tableau differentiates. The differentiation is subject to the types of fields used in a view. Green data fields are continuous, while the blue ones are separate. The green ones give out gradient colors, axes and range filters, whereas the blues result in headers, multi-select filters and categorical colors.

Data Science Machine Learning Certification

The Importance of INDEX function (and its close associates)

Though I have scavenged through every available functions of Tableau in order to become a Tableau maestro in my early days, I knew I hadn’t made proper use of the functions INDEX, FIRST and LAST, until now. The main purpose of INDEX is to create a rank, irrespective of any order in which your items need to be displayed on the screen or by any other measure. It is thoroughly flexible and gives you enough room to sort, screen and put up your data in ways not possible otherwise.

While you drag and drop, Tableau writes a query language

Tableau is an intelligent visualization tool. It incorporates all kinds of latest, breakthrough technologies that assists in creating complicated visuals out of languorous data sets with just a simple drag and drop interface. However, on closer look, you will find that Tableau makes use of the data using a form of SQL and then gives shape to your data on screen with an ‘interpreter’.

Just incorporate a measure on label, a dimension on rows and write a query on the line of

SELECT Region, Sum(Sales) FROM Orders GROUP BY Region

You can also put another dimension straight on the filter shelf and it will come with a WHERE clause. After some classification, you get an ORDER BY.

Order of operations

Tableau always performs in an orderly manner – things are done here in a certain manner, and this order eventually helps you in creating a perfect view that will fetch you the desired results. Whether you add fields to your view or filter shelf or do custom calculations, all the items are calculated simultaneously.


Things are treated in the following order:

Context filters will generate a temp table in the source
Top N and/or conditional filters make a part of the SELECT command in the query
Standard filters are used as a WHERE clause
Aggregations are ciphered
Table calculations are implemented
Table layout and axes are etched
Anything on the Pages shelf is held accountable
Marks are then sketched

eca1faa965cdeeaff14af77b9f1e4635---years-i-wish

So, this is it! I figured out these functions, which helped me to derive the best out of Tableau. If you too had a Eureka moment, then feel free to let us know.

Of course, you might not be familiar with databases and SQL yet you can still become a Tableau expert without nailing the basics, but if you possess a bit of data analysis knowledge then our Tableau training courses Gurgaon can help accelerate your knowledge further. For more, check Tableau BI training courses by DexLab Analytics Delhi.


This article was sourced from – www.theinformationlab.co.uk/2013/01/28/5-things-i-wish-i-knew-about-tableau-when-i-started


Interested in a career in Data Analyst?

To learn more about Data Analyst with Advanced excel course – Enrol Now.
To learn more about Data Analyst with R Course – Enrol Now.
To learn more about Big Data Course – Enrol Now.

To learn more about Machine Learning Using Python and Spark – Enrol Now.
To learn more about Data Analyst with SAS Course – Enrol Now.
To learn more about Data Analyst with Apache Spark Course – Enrol Now.
To learn more about Data Analyst with Market Risk Analytics and Modelling Course – Enrol Now.

Stories of Success: Molecular Modeling Toolkit (MMTK), Open Source Python Library

Stories of Success: Molecular Modeling Toolkit (MMTK), Open Source Python Library

Welcome again!! We are back here to take up another thrilling topic and dissect it inside out to see what compelling contents are hidden within. And this time we will take up our newly launched Python Programming Training Module – Python, invented by Guido Van Rossum is a very simple, well-interpreted and goal-specific intensive programming language.

Programmers love Python. Since there is zero compilation step, debugging Python programs is a mean feat. In this blog, we will chew over The Molecular Modeling Toolkit (MMTK) – it’s an open source Python library for molecular modeling and simulation. Composed of Python and C, MMTK eyes on bio-molecular systems with its conventional standard techniques and schemes, like Molecular Dynamics coupled with new techniques based on a platform of low-level operations.

Get a Python certification today from DexLab Analytics – a premier data science with python training institute in Delhi NCR.

It was 1996, when the officials from Python Org, including Konrad Hinsen (He was then involved in the Numerical Python project, but currently working as a researcher in theoretical physics at the French Centre National de la Recherche Scientifique (CNRS). He is also the author of ScientificPython, a general-purpose library of scientific Python code) started developing MMTK. They initially had a brush off with mainstream simulation packages for biomolecules penned down by Fortran, but those packages were too clumsy to implement and especially modify and extend. In order to develop MMTK, modifiability was a crucial criterion undoubtedly and they gave it utmost attention.

groel_deformation-web

The language chosen

The selection of language took time. The combination of Python and C was an intuitive decision. The pundits of Python were convinced that only a concoction of a high-level interpreted language and a CPU-efficient compiled language could serve their purpose well, and nothing short of that.

For the high-level segment, Tcl was rejected because it won’t be able to tackle such complex data structures of MMTK. Perl was also turned down because it was made of unfriendly syntax and an ugly integrated OO mechanism. Contrary to this, Python ranked high in terms of library support, readability, OO support and integration with other compiled languages. On top of that, numerical Python was just released during that time and it turned out to be a go-to option.

Now, for the low-level segment, Fortran 77 was turned down owing to its ancient character, portability issues and low quality memory management. Next, C++ was considered, but finally it was also rejected because of portability issues between compilers in those days.


The architecture of library

The entire architecture of MMTK is Python-centric. For any user, it will exude the vibes of a pure Python library. Numerical Python, LAPACK, and the netCDF library functions are observed extensively throughout MMTK. Also, MMTK offers multi-threading support for MPI-based parallelization for distributed memory machines and shared memory parallel machines.

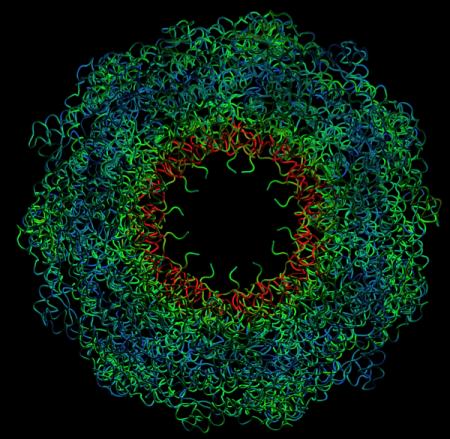
The most important constituent of MMTK is a bundle of classes that identify atoms and molecules and control a database of fragments and molecules. Take a note – biomolecules (mostly RNA, DNA and proteins) are administered by subclasses of the generic Molecule class.

Extendibility and modularity are two pillars on which Python MMTK model is based. Without going under any modification of MMTK code, several energy terms, data type specializations and algorithms can be added anytime. Because, the design element of MMTK is that of a library, and not some close program, making it easier to run applications.

Note Bene: MMTK at present includes 18,000 lines of Python code, 12,000 lines of hand-written C code, and several machine-generated C codes. Most of the codes were formulated by one person during eight years as part of a research activity. The user community provided two modules, few functions and many ideas.

For more information, peruse through Python Training Courses Noida, offered by DexLab Analytics Delhi. They are affordable, as well as program-centric.


This article is sourced from –  www.python.org/about/success/mmtk


Interested in a career in Data Analyst?

To learn more about Data Analyst with Advanced excel course – Enrol Now.
To learn more about Data Analyst with R Course – Enrol Now.
To learn more about Big Data Course – Enrol Now.

To learn more about Machine Learning Using Python and Spark – Enrol Now.
To learn more about Data Analyst with SAS Course – Enrol Now.
To learn more about Data Analyst with Apache Spark Course – Enrol Now.
To learn more about Data Analyst with Market Risk Analytics and Modelling Course – Enrol Now.

Data Science Jobs: Luxury Today, Necessity Tomorrow

Data Science Jobs: Luxury Today, Necessity Tomorrow

A general consensus: the scene of employment is changing. The jobs in data science are spiking up, and at a robust rate. According to World Economic Forum in 2016, a nuanced state of affairs with employment fluctuations is likely to happen across sectors, jobs and geography in the coming years – hold your horses and wait with bated breath!

2

Job Opportunities till 2020

A wide set of factors are expected to bring upon different effects on the varying segments of employment market till 2020. For an instance, recent demographic stats in the emerging job market are likely to ace up employment by 5% approx worldwide. On the other side, the surging geopolitical instability across the globe could reduce employment by 2.7%. Amidst this, artificial intelligence, touted as a replacement key for manpower is likely to have a minute effect on job reduction by a mere 1.5%.

Considerably, the overall figure points that the computing and mathematical jobs are going to increase by 3.2% – because a sturdy compilation of technological and geopolitical instability effect is expected to generate an altogether positive effect across various employment chains, suggesting the instability will in return result in a higher demand for programming, computing and modeling.

However, recruitment procedure is going to get more challenging.

Across every sector and every job family the perception is that recruitment will be more challenging in future #ai #sasacademic

Lower University application rates

Following the latest trends, the applications to universities by students have taken a halt – in UK, the number of people applying to universities has fallen drastically – the reason anticipated is the result of Brexit.

But irrespective of any reason, lower application rate is going to affect graduate recruitment. The emergence of a gig economy is largely considered a positive effort, but a lack of benefits like annual leave may cause some hindrance in the effectuality. Also, AI is resulting in a less number of job generation, the automation of entry-level jobs mean lesser jobs.

Hone your skills further after employment

While undergraduates and postgraduates eyes employment as the end of their education, for employers it’s an entirely different ball game. For them, employment is the just a stepping stone in the process of ongoing training to make sure the fresh workforce develops cutting-edge skills. This stands true especially in complex job areas of data science, where a shortage of graduates exists. As a result, motivate your existing workforce to develop required data analytics skills in the most accomplishing way to garner expertise and thorough know-how.

The most desirable quality in a new #DataScience hire is their dedication to continually learn more. #sasacademic #ai

To get the best kind of data science online training, drop by DexLab Analytics Delhi – it is a prime learning platform in India that helps you remain up-to-date with the latest tools and trends. The field of data analytics is evolving rapidly and continuing professional development is the need of the hour.

 
Source blogs.sas.com
 

Interested in a career in Data Analyst?

To learn more about Data Analyst with Advanced excel course – Enrol Now.
To learn more about Data Analyst with R Course – Enrol Now.
To learn more about Big Data Course – Enrol Now.

To learn more about Machine Learning Using Python and Spark – Enrol Now.
To learn more about Data Analyst with SAS Course – Enrol Now.
To learn more about Data Analyst with Apache Spark Course – Enrol Now.
To learn more about Data Analyst with Market Risk Analytics and Modelling Course – Enrol Now.

Digital Transformation: Data Scientists Are a Must Now for Enterprises

Data explosion, sprawling around Facebook and Internet of Things need to be nipped now to make sense what’s in there. Data is filled with promises, it offers new significant insights culled from the patterns in the data to just not report what happened but predict future scenarios.

Digital Transformation: Data Scientists Are a Must Now for Enterprises

This has led organizations to hire data scientists who are adept with the expertise and experience to shed some light on the mysteries of NoSQL data lakes and data bases, in which data is hoarded. For best SAS analytics training in Gurgaon, look up to DexLab Analytics – their SAS certification in Delhi is nifty and student-friendly.

Continue reading “Digital Transformation: Data Scientists Are a Must Now for Enterprises”

Data Governance: How to Win Over Data and Rule the World

Data is the buzzword. It is conquering the world, but who conquers data: the companies that use them or the servers in which they are stored?


Data Governance: How to Win Over Data and Rule the World


Let’s usher you into the fascinating world of data, and data governance. FYI: the latter is weaving magic around the Business Intelligence community, but to optimize the results to the fullest, it needs to depend heavily on a single factor, i.e. efficient data management. For that, highly-skilled data analysts are called for – to excel on business analytics, opt for Business Analytics Online Certification by DexLab Analytics. It will feed you in the latest trends and meaningful insights surrounding the daunting domain of data analytics.

Continue reading “Data Governance: How to Win Over Data and Rule the World”

Chief Data Officer Is the Next “Commander” To Join the Digital Kingdom and Here’s Why

Chief Data Officer Is the Next “Commander” To Join the Digital Kingdom and Here’s Why

An over-empowering digital transformation is here and it is wreaking havoc in the C-Suite. CDOs have started taking a front line in managing and pushing new tech like AI and machine learning to alter business landscapes forever.

As a matter of fact, this promising job title has existed for years, even decades – mostly in the financial market. But now when data is being generated at record high speeds, the job role of the CDO is emerging out bigger and better. No more a single person or a general crew is enough to tackle such challenging data issues – to fulfill complicated data management tasks, management is now looking up to specialized data experts.

Gartner predicts that 90% of multinational organizations will appoint a CDO by 2019. Though the first generation CDOs were only concerned about data governance and management, of late, they have been shifting focus on how to best implement data as the best strategic asset in organizations to trigger optimum results.  

12345

Take a look down to know how CDOs can add value to your organization, while streamlining data and developing strategies:

Be competitive, be ahead of the curve

The best way to ace is by taking over your competitors. In corporate jargon, it means to understand your competitor’s strategies better and arm yourself in the way. Also, it calls up to know your customers better, including the things they like to purchase and know ways you can fulfill their needs. Glean all of these observations with the flattering tool of IoT and machine learning, including social media and supply chain.

2

Share information through Data silos

Think how would you feel if you are unable to share information within your department? It can be exasperating. But in reality, it happens. Employees working in the same company, even in the same team forget to share information – data is treated as a commodity that is traded for. That’s why, chief data officers break down data silos in an organization to make sure everyone within the framework get access to data to boost decision-making.

CDOs infuse life into data

All analysts are not good with data. No matter how much they pore themselves over into pie charts and bar diagrams, they just can’t nail it. Machine learning using Python and other related technologies has made things easier – now CDOs can infer trends and draw meaningful insights necessary for a better company future. And mind it these analyses eventually saves hours of production time, millions of losses and much more.

repsoitory-choices

There’s nothing better than cleaner, fresh data

Unkempt data is no data at all. In fact, data comes handy only when it is clean. Today, with the influx of so many data, organizations falter to keep pace with so much data extravagance data starts becoming dirty or of little use. This results in – every report run is full of flaws, estimates are wrong and lists compiles are inaccurate. As a savior in troubled situations, CDOs help in churning out crystal clear, consistent data by taking care of all the business processes, and making sure that they are properly maintained by the users.

CDOs are the meat and potatoes of C-Suite team

Not only they understand the intricacies of the subject matter, CDOs undoubtedly makes better use of your data, and looks forward to ways to use them in more meaningful manners. They are not here to hoard the data, but to share it extensively among the people working in the organization to produce fascinating results all around.  

Now that you know how important CDOs are, enroll for a reputable business analytics online certification by DexLab Analytics. Business analytics certification is the key to good times, go get one for yourself today!


Interested in a career in Data Analyst?

To learn more about Data Analyst with Advanced excel course – Enrol Now.
To learn more about Data Analyst with R Course – Enrol Now.
To learn more about Big Data Course – Enrol Now.

To learn more about Machine Learning Using Python and Spark – Enrol Now.
To learn more about Data Analyst with SAS Course – Enrol Now.
To learn more about Data Analyst with Apache Spark Course – Enrol Now.
To learn more about Data Analyst with Market Risk Analytics and Modelling Course – Enrol Now.

How Credit Risk Modeling Is Used to Assess Credit Quality

Given the uproar on cyber crimes today, the issue of credit risk modeling is inevitable. Over the last few years, a wide number of globally recognized banks have initiated sophisticated systems to fabricate credit risk arising out of significant corporate details and disclosures. These adroit models are created with a sole intention to aid banks in determining, gauging, amassing and managing risk across encompassing business and product lines.


How Credit Risk Modeling Is Used to Assess Credit Quality


The more an institute’s portfolio expands better evaluation of individual credits is to be expected. Effective risk identification becomes the key factor to determine company growth. As a result, credit risk modeling backed by statistically-driven models and databases to support large volumes of data needs tends to be the need of the hour. It is defined as the analytical prudence that banks exhibit in order to assess the risk aspect of borrowers. The risk in question is dynamic, due to which the models need to assess the ability of a potential borrower if he can repay the loan along with taking a look at non-financial considerations, like environmental conditions, personality traits, management capabilities and more.

Continue reading “How Credit Risk Modeling Is Used to Assess Credit Quality”

Call us to know more