Dexlab, Author at DexLab Analytics | Big Data Hadoop SAS R Analytics Predictive Modeling & Excel VBA - Page 3 of 80

8 Skills a Python Programmer Should Master

8 Skills a Python Programmer Should Master

Python has become the lingua franca of the computing world. It has come to become the most sought after programming language for deep learning, machine learning and artificial intelligence. It is a favourite with programmers because it is easy to understand and learn and it achieves a lot more in terms of productivity as compared to other languages.

Python is a dynamic, high-level, general-purpose programming language that is useful for developing desktop, web and mobile applications that can also be used for complex scientific and numeric applications, data science, AI etc. Python focuses a lot on code readability.

From web and game development to machine learning, from AI to scientific computing and academic research, Data science and analysis, python is regarded as the real deal. Python is useful in domains like finance, social media, biotech etc. Developing large software applications in Python is also simpler due to its large amount of available libraries.

The Python developer usually deals with backend components, apps connection with third-party web services and giving support to frontend developers in web applications. Of course, one might create applications with use of different languages but pretty often Python is the language chosen for it – and there are several reasons for that.

In this article, we will walk through a structured approach to top 8 skills required to become a Python Developer. These skills are:

  • Core Python
  • Good grasp of Web Frameworks
  • Front-End Technologies
  • Data Science
  • Machine Learning and AI
  • Python Libraries
  • Multi-Process Architecture
  • Communication Skills

Core Python

This is the foundation of any Python developer. If one wants to achieve success in this career, he/she needs to understand the core python concepts. These include the following:

  • Iterators
  • Data Structures
  • Generators
  • OOPs concepts
  • Exception Handling
  • File handling concepts
  • Variables and data types

However, learning the core language (as mentioned above) is only the first step in mastering this language and becoming a successful Python developer.

Good grasp of Web Frameworks

By automating the implementation of redundant tasks, frameworks cut development time and enable developers to focus greatly on application logic rather than routine elements.

Because it is one of the leading programming languages, there is no scarcity of frameworks for Python. Different frameworks have their own set of advantages and issues. Hence, the selection needs to be made on the basis of project requirements and developer preference. There are primarily three types of Python frameworks, namely full-stack, micro-framework, and asynchronous.

A good Python web developer has incredible honing over either of the two web frameworks Django or Flask or both. Django is a high-level Python Web Framework that encourages a good, clean and pragmatic design and Flask is also widely used Python micro web framework.

Front-End Technologies (JavaScript, CSS3, HTML5)

Sometimes, Python developers must work with the frontend team to match together the server-side and the client-side. This means Python developers need a basic understanding of how the frontend works, what’s possible and what’s not, and how the application will appear.

While there is likely a UX team, SCRUM master, and project or product manager to coordinate the workflow, it’s still good to have a basic understanding of front-end tasks.
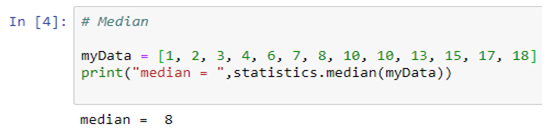
Data Science

Data science offers a world of new opportunities. Being a Python developer, there are several prerequisites you need to know starting with things you learn in high school mathematics, such as statistics, probability, etc. Some of the other parts of data science you need to understand, and use include SQL knowledge; the use of Python packages, data wrangling and data cleanup, analysis of data, and visualization of data.

Artificial Intelligence and Machine Learning

Artificial Intelligence and Machine Learning (as well as Deep Learning) are constantly growing. Python is the perfect programming language which is used in all the frameworks of Machine Learning and Deep Learning. This will be a huge plus for someone if he/she knows about this domain. If someone is into data science, then definitely digging in the Machine Learning topic would be a great idea.

Python Libraries

Python libraries certainly deserve a place in every Python Developer’s toolbox. Python has a massive collection of libraries, both native and third-party libraries. With so many Python libraries out there, though, it’s no surprise that some don’t get all the attention they deserve. Plus, programmers who work exclusively in one domain don’t always know about the goodies available to them for other kinds of work.

Python libraries are extensively used in simplifying everything from file system access, database programming, and working with cloud services to building lightweight web apps, creating GUIs, and working with images, ebooks, and Word files—and much more.

Multiprocessing Architecture

Multiprocessing refers to the ability of a system to support more than one processor at the same time. Applications in a multiprocessing system are broken to smaller routines that run independently. The operating system allocates these threads to the processors improving performance of the system. As a Python-Developer one should definitely know about the MVC (Model View Controller) and MVT (Model View Template) Architecture. Once you understand the Multi-Processing Architecture you can solve issues related to the core framework etc.

Communication Skills

In best software development firms the teams are made out of amazing programmers which work together to achieve the final goal – no matter if it means to finish the project, to create a new app or maybe to help a startup. However, working in a team means that a developer has to communicate well – not only to get the stuff done but also to keep the documentation clear so others can easily read and follow the thinking path to fully understand the idea.

Data Science Machine Learning Certification

Conclusion

In this write-up, we have elaborated on the top skills one needs to have to be a successful Python Developer. One must have a working knowledge of Core Python and a good grasp of Web Frameworks, Front-End Technologies, Data Science, Machine Learning and AI, Python Libraries, Multi-Process Architecture and Communication skills. Though there are a few more skills not listed in this blog, one can achieve success in developing large software applications by mastering all the above skills only.

As delineated in the article, Python is the new rage in the computing world. And it is no surprise then that more and more professionals are opting to take up courses teaching Machine learning using Python and python for data analysis.


Interested in a career in Data Analyst?

To learn more about Data Analyst with Advanced excel course – Enrol Now.
To learn more about Data Analyst with R Course – Enrol Now.
To learn more about Big Data Course – Enrol Now.

To learn more about Machine Learning Using Python and Spark – Enrol Now.
To learn more about Data Analyst with SAS Course – Enrol Now.
To learn more about Data Analyst with Apache Spark Course – Enrol Now.
To learn more about Data Analyst with Market Risk Analytics and Modelling Course – Enrol Now.

AI – A Great Opportunity For Cyber Security Solutions

AI - A Great Opportunity For Cyber Security Solutions

AI and machine learning are the new rage in the computing world. And for reasons justified. With advancement in technology, the threat to technological systems and businesses online has also advanced and become more complex.

Cyber criminals are constantly coming up with newer mechanisms to break into cyber systems for theft or disruption. Thus, the cyber security industry is in a fix over what it can do to enhance security features of existing systems. AI and Machine Learning are the answer to its woes.

Artificial Intelligence and Machine Learning work on large sets of data, analyzing them and finding patterns in them. AI helps interpret data and make sense of it to yield solutions and ML learns up intuitively how to spot patterns in the data. The two go hand in hand and complement each other.

Cybersecurity solutions pivot on the science of finding and spotting patterns and planning the right response to these. They have the ability to tap into data and detect a set of code as malicious, even if no one has noticed it or flagged it before. Thus, it becomes complementary to AI in that it involves the cyber security software to be tutored to detect and alert the user about an anomaly or trigger an alarm if a corruption crosses the threshold without being prompted.  

Artificial Intelligence and Machine Learning are used in Spam Filter Applications, Network Intrusion Detection and Prevention, Fraud detection, Credit scoring, Botnet Detection, Secure User Authentication, Cyber security Ratings and Hacking Incident Forecasting.

They are much faster than human users deploying software to detect of fight cyber attacks and they do not tire unlike their human counterparts while assessing tons of data and malicious aspects of those data. They are thus not prone to desensitization that a human user would be prone to.

Application of AI in cyber security solutions is akin to taking things up a notch higher up. Without AI, cyber security would lose the option of having the software learn by itself by merely observing sets of data and user patterns.

An AI system would develop a digital fingerprint of the user based on his habits and preferences. This would help in the event of someone other than the user trying to break into his or her system. And AI cyber security systems do this work 24X7, unlike a human user who would spend limited time scanning for malicious codes or components.

Data Science Machine Learning Certification

AI and machine learning, since their inception, have transformed the world of cyber security forever. With time, both aspects of the computing world will refine and mature. It is only a matter of time before a user’s cyber security system becomes tailored to her needs.

And it is thus not surprising that more and more professionals are opting for artificial intelligence courses to equip themselves with relevant coursework. The world is moving to reap the benefits of AI intelligence. So, if you are interested in doing the same, opt for an artificial intelligence course in delhi or a Machine Learning course in India by enrolling yourself with DexLab Analytics.


Interested in a career in Data Analyst?

To learn more about Data Analyst with Advanced excel course – Enrol Now.
To learn more about Data Analyst with R Course – Enrol Now.
To learn more about Big Data Course – Enrol Now.

To learn more about Machine Learning Using Python and Spark – Enrol Now.
To learn more about Data Analyst with SAS Course – Enrol Now.
To learn more about Data Analyst with Apache Spark Course – Enrol Now.
To learn more about Data Analyst with Market Risk Analytics and Modelling Course – Enrol Now.

Artificial Intelligence and IT Operations: A new algorithm

Artificial Intelligence and IT Operations: A new algorithm

Artificial intelligence used to automate IT operations has begun being widely termed as AIOps, a new algorithm of deep learning put to use in the field of information technology to speed up businesses and response timings to incidents occurred. It is the new rage after AI itself. And, justifiably so.

Information technology is constantly in flux, changing every minute. To keep up with it, old systems will not work. What is needed for its management is smart and fast computer programs which can keep learning and re-use learnt skills with more and more operations carried out. Trends show that worldwide spending on AI systems will hit the $77.6 billion mark in 2020, three times the amount forecasted for 2018, the IDC revealed recently.

Trends show AIOps will take centre stage when it comes to problem solving and accelerating detection of incidents and remediation.  As AIOps tools mature, IT systems will be able to work on and process a larger variety of data types in a faster and better manner, enhancing performance for more specific jobs assigned to it.

AI experts in the field say AIOps will be used to enhance and increase natural language processing, analysis of the root cause of problems, detection of anomalies, and correlation and analysis of events, among other IT functions, thus giving IT operations professionals greater control over their systems.

AI technology can help improve efficiency in vital industries like healthcare and agriculture. A case in point is the development of the Chatbot which has come to contextualize and give more intuitive and human like responses to customers.

In 2020, it is expected of IT firms to introduce data-source-agnostic solutions. This new tool will be a big boost for the industry as the more varied and variegated the data fed into an AIOps platform, the greater the insights and value the algorithms can come up with. This will directly translate to mean users can determine, more accurately, issues, foresee impacts and fathom how change can affect business-critical activities.

Data Science Machine Learning Certification

One drawback of the current AIOps systems are that they take a lot of time on-boarding and its takes time training company professionals in the use of the AI software as well as feeding the software with vast amounts of data and information. This is a challenge that will have to be met in the coming few years as more and more of the IT world is adopting AI in its systems.

The AIOps is being used increasingly in Indian IT firms as well, they recognizing the need to embrace the AI juggernaut the world has bowed down to. For artificial intelligence certification in Delhi NCR one can sign up for a course at DexLab Analytics which might have the perfect machine Learning course in India for you.


Interested in a career in Data Analyst?

To learn more about Data Analyst with Advanced excel course – Enrol Now.
To learn more about Data Analyst with R Course – Enrol Now.
To learn more about Big Data Course – Enrol Now.

To learn more about Machine Learning Using Python and Spark – Enrol Now.
To learn more about Data Analyst with SAS Course – Enrol Now.
To learn more about Data Analyst with Apache Spark Course – Enrol Now.
To learn more about Data Analyst with Market Risk Analytics and Modelling Course – Enrol Now.

Not to Miss: The Startup India tableau at Republic Day 2020 parade

Not to Miss: The Startup India tableau at Republic Day 2020 parade

The commerce and industry ministry recently, in a written press briefing, said that it will showcase a tableau on Startup India, with an aim to promote innovation and entrepreneurship in the nation. The tableau will be displayed at the Republic Day Parade this year, in a first.

The name of the tableau is ‘Startups: Reach for the Sky’. It is themed on the stages of the life-cycle of a startup and the multifarious elements of support provided by the government, the ministry said in a press statement.

“The front of the tableau depicts a creative mind, full of ideas to solve real world problems. The Startup India Tree, in the middle will represent different kinds of support given,” a government official from the Department of Promotion of Industry & Internal Trade (DPIIT), said in the statement.

The staircase will stand for the various stages of growth – those are – coming up with a concept, creating a prototype, preparing a business plan, building a team, launching into markets and eventually scaling up, an Economic Times report said.

The wheel will denote sectors of economy where Indians have driven and given a fillip to economic growth and created employment opportunities on a big scale, the statement read. The wheel and the map of India together depict the width and the depth of the Startup India movement in the country.

Startup India is a flagship initiative of the Narendra Modi government, conceived with the intention of building a strong environment to nurture innovation, drive sustainable economic growth and generate large scale employment opportunities and job openings.

“We have a million problems, but at the same time we have over a billion minds,” Prime Minister Narendra Modi had said about the flagship programme started in January, 2016. In October, 2019 Prime Minister Narendra Modi said that the Indian startup ecosystem will help India achieve the $5 trillion target for the economy set by the government.  

The objective is to inspire and motivate youth to follow their dreams to generate wealth and become job creators and not just job seekers. Under the Startup India Scheme, eligible companies can get recognised as startups by the ministry in order to access a host of tax benefits, easier compliance, IPR fast tracking and other incentives.

More than 26,000 startups from 551 districts of 28 States and 7 Union Territories have been recognized so far. “Working across IT, Industry 4.0, education, healthcare, agriculture, energy, finance, space, defence and all other sectors of economy, Indian startups have attracted substantial global investments and created more than 2,91,000 jobs,” it added.

Besides DPIIT, the Department of Financial Services, Department of Drinking Water and Sanitation, NDRF Ministry of Home Affairs, CPWD Ministry of Housing and Urban Affairs, and Ministry of Shipping will also participate in the Republic Day parade.


Interested in a career in Data Analyst?

To learn more about Data Analyst with Advanced excel course – Enrol Now.
To learn more about Data Analyst with R Course – Enrol Now.
To learn more about Big Data Course – Enrol Now.

To learn more about Machine Learning Using Python and Spark – Enrol Now.
To learn more about Data Analyst with SAS Course – Enrol Now.
To learn more about Data Analyst with Apache Spark Course – Enrol Now.
To learn more about Data Analyst with Market Risk Analytics and Modelling Course – Enrol Now.

Studies Show Indian Employers Prefer Experienced Workers Over Freshers

Studies Show Indian Employers Prefer Experienced Workers Over Freshers

Employability and the scramble for top Jobs in India 

Looking to hire new talent or searching for a job? Well, some insights several studies and surveys provide about the job scenario in India might interest you.

The Millenial

Indian millennials, aged between 18 and 35 years, according to studies ( wheebox.com/assets/pdf/ISR_Report_2020.pdf ) makes nearly half the Indian workforce and looks likely to remain so for the next decade. This generation of workers are not only working hands but likely consumers as well, strong in their opinions, with access to the internet and social media across urban and rural areas. What they are most ardently looking for are jobs that respect their talent, pay them adequately and improve their employability in the market. 

Employability in India

Employability has remained stagnant for several years now with around 46 per cent candidates job-ready. Of those employed, trends revealed

  • MBA’s in India are now projecting a rate of 54 per cent employability, acquiring the highest paying jobs
  • Employers prefer candidates with work experience, especially 1-5 years. Freshers are least preferred at 15 per cent.
  • The AI industry is showing promise wherein some reports pegged the number of job openings in AI and Machine learning sector at almost 1million in India last year. 
  • Employability for pass-outs of B.Pharma, B.com, BA and Polytechnics showed an increase of around 15% since 2019.
  • Prospective workers from Maharashtra, Tamil Nadu and Uttar Pradesh were found to be most employable
  • While women are as employable as men, women’s participation in the workforce remains at a low 25 per cent vis a vis that of men.

Data Science Machine Learning Certification

What employers seek

  • Domain knowledge
  • Adaptability to the work environment
  • Learning ability and agility
  • Positive attitude

What employees seek

  • Majority of Students, around 88 per cent of those surveyed, sought internship opportunities though the supply did not meet demand in most cases
  • Maharashtra, Tamil Nadu and Andhra Pradesh were preferred and most sought after in terms of work opportunity
  • Over 55% students expect the annual salary to be above Rs. 2.6 lacs, a figure which has remained constant for the past few years

Ways to improve employability

Most students or potential candidates, surveys show, seek proper guidance and training and internship opportunities as varied as customer market analysis courses to customer marketing analysis training and courses teaching retail analytics using Python. While most universities lack the wherewithal to skill their outgoing students, students prefer to sign up for short courses online to equip themselves with the requisite knowledge specific to their industry. All this done with a view to increase their employability in a market deeply customer driven.


Interested in a career in Data Analyst?

To learn more about Data Analyst with Advanced excel course – Enrol Now.
To learn more about Data Analyst with R Course – Enrol Now.
To learn more about Big Data Course – Enrol Now.

To learn more about Machine Learning Using Python and Spark – Enrol Now.
To learn more about Data Analyst with SAS Course – Enrol Now.
To learn more about Data Analyst with Apache Spark Course – Enrol Now.
To learn more about Data Analyst with Market Risk Analytics and Modelling Course – Enrol Now.

A Handbook of the Basic Data Types in Python 3: Strings

A Handbook of the Basic Data Types in Python 3: Strings

In general, a data type defines the format, sets the upper & lower bounds of the data so that a program could use it appropriately. Data types are the classification or categorization of data items which describes the character of a variable. The most used data types are numeric, non-numeric and Boolean (true/false).

Python has the following standard Data Types:

  • Booleans
  • Numbers
  • String
  • List
  • Tuple
  • Set
  • Dictionary

Mutable and Immutable Objects

Data objects of the above types are stored in a computer’s memory for processing. Some of these values can be modified during processing, but the contents of the others can’t be altered once they are created in the memory.

Number values, strings, and tuple are immutable, which means their contents can’t be altered after creation.

On the other hand, the collection of items in a List or Dictionary object can be modified. It is possible to add, delete, insert, and rearrange items in a list or dictionary. Hence, they are mutable objects.

Booleans

A Boolean is such a data type that almost every programming language has, and so does Python. Boolean in Python can have two values – True or False. These values can be used for assigning and comparison.

Numbers

Numbers are one of the most prominent Python data types. In Numbers, there are mainly 3 types which include Integer, Float, and Complex.

String

A sequence of one or more characters enclosed within either single quotes ‘or double quotes” is considered as String in Python. Any letter, a number or a symbol could be a part of the string. Multi-line strings can be represented using triple quotes,”’ or “””.

Data Science Machine Learning Certification

List

Python list is an array-like construct which stores a heterogeneous collection of items of varied data typed objects in an ordered sequence. It is very flexible and does not have a fixed size. The Index in a list begins with a zero in Python.

Tuple

A tuple is a sequence of Python objects separated by commas. Tuples are immutable, which means tuples once created cannot be modified. Tuples are defined using parentheses ().

Set

A set is an unordered collection of items. Set is defined by values separated by a comma inside braces { }. Amongst all the Python data types, the set is one which supports mathematical operations like union, intersection, symmetric difference etc. Since the set derives its implementation from the “Set” in mathematics, so it can’t have multiple occurrences of the same element.

Dictionary

A dictionary in Python is an unordered collection of key-value pairs. It’s a built-in mapping type in Python where keys map to values. These key-value pairs provide an intuitive way to store data. To retrieve the value we must know the key. In Python, dictionaries are defined within braces {}.

This article is about one specific data type, which is a string. The String is a sequence of characters enclosed in single (”) or double quotation (“”) marks.

Here are examples of creating strings in Python.

Counting Number of Characters Using LEN () Function

The LEN () built-in function counts the number of characters in the string.

Creating Empty Strings

Although variables S3 and S4 do not contain any characters they are still valid strings. S3 and S4 both represent empty strings here.

We can verify this fact by using the type () function.

String Concatenation

String concatenation means joining one or more strings together. To concatenate strings in Python we use + operator.

String Repetition Operator (*)

Just like in numbers, * operator can also be used with strings. When used with strings * operator repeats the string n number of times. Its general format is: 1 string * n,

where n is a number of type int.

Membership Operators – in and not in

The in or not in operators are used to check the existence of a string inside another string. For example:

Indexing in a String

In Python, characters in a string are stored in a sequence. We can access individual characters inside a string by using an index.

An index refers to the position of a character inside a string. In Python, strings are 0 indexed. This means that the first character is at index 0; the second character is at index 1 and so on. The index position of the last character is one less than the length of the string.

To access the individual characters inside a string we type the name of the variable, followed by the index number of the character inside the square brackets [].

Instead of manually counting the index position of the last character in the string, we can use the LEN () function to calculate the string and then subtract 1 from it to get the index position of the last character.

We can also use negative indexes. A negative index allows us to access characters from the end of the string. Negative index starts from -1, so the index position of the last character is -1, for the second last character it is -2 and so on.

Slicing Strings

String slicing allows us to get a slice of characters from the string. To get a slice of string we use the slicing operator. Its syntax is:

str_name[start_index:end_index]

str_name[start_index:end_index] returns a slice of string starting from index start_index to the end_index. The character at the end_index will not be included in the slice. If end_index is greater than the length of the string then the slice operator returns a slice of string starting from start_index to the end of the string. The start_index and end_index are optional. If start_index is not specified then slicing begins at the beginning of the string and if end_index is not specified then it goes on to the end of the string. For example:

Apart from these functionalities, there are so many built-in methods for strings which make the string as the useful data type of Python. Some of the common built-in methods are as follows: –

capitalize ()

Capitalizes the first letter of the string

join (seq)

Merges (concatenates) the string representations of elements in sequence seq into a string, with separator string.

lower ()

Converts all the letters in a string that are in uppercase to lowercase.

max (str)

Returns the max alphabetical character from the string str.

min (str)

Returns the min alphabetical character from the string str.

replace (old, new [, max])

Replaces all the occurrences of old in a string with new or at most max occurrences if max gave.

 split (str=””, num=string.count(str))

Splits string according to delimiter str (space if not provided) and returns list of substrings; split into at most num substrings if given.

upper()

Converts lowercase letters in a string to uppercase.

Conclusion

So in this article, firstly, we have seen a brief introduction of all the data types of python. Later in this article, we focused on the strings. We have seen several Python operations on strings as well as the most common useful built-in methods of strings.

Python is the language of the present age, wherein almost every field there is a need for Python. For example, Python for data analysisMachine Learning Using Python has been easy and comprehensible than they were ever before. Thus, if you are also interested in Python and looking for promising courses Computer Vision Course PythonRetail Analytics using PythonNeural Network Machine Learning Python, then get in touch with Dexlab Analytics now and step into the world of opportunities!


Interested in a career in Data Analyst?

To learn more about Data Analyst with Advanced excel course – Enrol Now.
To learn more about Data Analyst with R Course – Enrol Now.
To learn more about Big Data Course – Enrol Now.

To learn more about Machine Learning Using Python and Spark – Enrol Now.
To learn more about Data Analyst with SAS Course – Enrol Now.
To learn more about Data Analyst with Apache Spark Course – Enrol Now.
To learn more about Data Analyst with Market Risk Analytics and Modelling Course – Enrol Now.

Python Statistics Fundamentals: How to Describe Your Data? (Part II)

Python Statistics Fundamentals: How to Describe Your Data? (Part II)

In the first part of this article, we have seen how to describe and summarize datasets and how to calculate types of measures in descriptive statistics in Python. It’s possible to get descriptive statistics with pure Python code, but that’s rarely necessary.

Python is an advanced programming language extensively used in all of the latest technologies of Data Science, Deep Learning and Machine learning. Furthermore, it is particularly responsible for the growth of the Machine Learning course in IndiaMoreover, numerous courses like Deep Learning for Computer vision with Python, Text Mining with Python course and Retail Analytics using Python are pacing up with the call of the age. You must also be in line with the cutting-edge technologies by enrolling with the best Python training institute in Delhi now, not to regret it later.

In this part, we will see the Python statistics libraries which are comprehensive, popular, and widely used especially for this purpose. These libraries give users the necessary functionality when crunching data. Below are the major Python libraries that are used for working with data.

Data Science Machine Learning Certification

NumPy and SciPy – Fundamental Scientific Computing

NumPy stands for Numerical Python. The most powerful feature of NumPy is the n-dimensional array. This library also contains basic linear algebra functions, Fourier transforms, advanced random number capabilities. NumPy is much faster than the native Python code due to the vectorized implementation of its methods and the fact that many of its core routines are written in C (based on the CPython framework).

For example, let’s create a NumPy array and compute basic descriptive statistics like mean, median, standard deviation, quantiles, etc.

SciPy stands for Scientific Python, which is built on NumPy. NumPy arrays are used as the basic data structure by SciPy.

Scipy is one of the most useful libraries for a variety of high-level science and engineering modules like discrete Fourier transforms, Linear Algebra, Optimization and Sparse matrices. Specifically in statistical modelling, SciPy boasts of a large collection of fast, powerful, and flexible methods and classes. It can run popular statistical tests such as t-test, chi-square, Kolmogorov-Smirnov, Mann-Whitney rank test, Wilcoxon rank-sum, etc. It can also perform correlation computations, such as Pearson’s coefficient, ANOVA, Theil-Sen estimation, etc.

Pandas – Data Manipulation and Analysis

Pandas library is used for structured data operations and manipulations. It is extensively used for data preparation. The DataFrame() function in Pandas takes a list of values and outputs them in a table. Seeing data enumerated in a table gives a visual description of a data set and allows for the formulation of research questions on the data.

The describe() function outputs various descriptive statistics values, except for the variance. The variance is calculated using the var() function in Pandas.

The mean() function, returns the mean of the values for the requested axis.

Matplotlib – Plotting and Visualization

Matplotlib is a Python library for creating 2D plots. It is used for plotting a wide variety of graphs, starting from histograms to line plots to heat plots. One can use Pylab feature in IPython notebook (IPython notebook –pylab = inline) to use these plotting features inline. If the inline option is ignored, then pylab converts IPython environment to an environment, very similar to Matlab.

matplotlib.pylot is a collection of command style functions.

If a single list array is provided to the plot() command, matplotlib assumes it is a sequence of Y values and internally generates the X value for you.

Each function makes some change to a figure, like creating a figure, creating a plotting area in a figure, decorating the plot with labels, etc. Now, let us create a very simple plot for some given data, as shown below:

Scikit-learn – Machine Learning and Data Mining

Scikit-learn built on NumPy, SciPy and matplotlib. Scikit-learn is the most widely used Python library for classical machine learning. But, it is necessary to include it in the discussion of statistical modeling as many classical machine learning (i.e. non-deep learning) algorithms can be classified as statistical learning techniques. This library contains a lot of efficient tools for machine learning and statistical modeling including classification, regression, clustering and dimensional reduction.

Conclusion

In this article, we covered a set of Python open-source libraries that form the foundation of statistical modelling, analysis, and visualization. On the data side, these libraries work seamlessly with the other data analytics and data engineering platforms, such as Pandas and Spark (through PySpark). For advanced machine learning tasks (e.g. deep learning), NumPy knowledge is directly transferable and applicable in popular packages such as TensorFlow and PyTorch. On the visual side, libraries like Matplotlib, integrate nicely with advanced dashboarding libraries like Bokeh and Plotly.


https://pandas.pydata.org/pandas-docs/stable/reference/api/pandas.DataFrame.html


Interested in a career in Data Analyst?

To learn more about Data Analyst with Advanced excel course – Enrol Now.
To learn more about Data Analyst with R Course – Enrol Now.
To learn more about Big Data Course – Enrol Now.

To learn more about Machine Learning Using Python and Spark – Enrol Now.
To learn more about Data Analyst with SAS Course – Enrol Now.
To learn more about Data Analyst with Apache Spark Course – Enrol Now.
To learn more about Data Analyst with Market Risk Analytics and Modelling Course – Enrol Now.

Automation is to Highly Impact the Knowledge Workers

Automation is to Highly Impact the Knowledge Workers

Automation will mainly target the knowledge workers, who are highly paid and educated and involved in thinking and analytical jobs.

The robot revolution is anticipated for quite some time now and with the ongoing advancements in Machine Learning, Artificial Intelligence and Data Science, the future is near. However, it is also one of the most dreaded events for the workers going forward, who would be vulnerable to losing their respective jobs.

Going back to the 2017 McKinsey study, around 50% of the jobs in the manufacturing industries are automatable using the latest technology. However, according to the latest report, the white-collar workers, who are well-read and engaged in thinking and analytical jobs, are more likely to suffer the most.

According to a new study conducted by Michael Webb, Stanford University Economist, the powerful technologies of computer science like Artificial Intelligence and Machine Learning, which can make human-like decisions and grow using real-time data, will eventually target the white-collar workers. Artificial Intelligence has already made marked intrusions in the white-collar jobs, like telemarketing, which are primarily overseen by the bots. However, with the tireless efforts of the Data Scientists, along with the expansion of the Machine Learning course in India, it is believed to oust the majority of the knowledge workers, like chemical engineers, market researchers, market analysts, physicists, librarians and more.

Data Science Machine Learning Certification

The new research focuses on the intersecting subject-noun pairs in AI patents and job descriptions to find out the jobs that will be heavily affected by the Ai technology. For example, the job descriptions of market research analysts comprise of “data analysis”, “identifying markets” and “track market trends”, which are in fact, all covered by the AI patents that are existing. This new study looks far more progressive than the previous ones because it analyzes patents for the technology which are yet to develop completely.

With the rising trends of Data Science and Machine Learning, Artificial Intelligence has really come a long way from what an imaginary concept. Thus, courses like Machine Learning Using Python and Python for Data Analysis, are in heavy demands. 


This article has been sourced fromwww.vox.com/recode/2019/11/20/20964487/white-collar-automation-risk-stanford-brookings


Interested in a career in Data Analyst?

To learn more about Data Analyst with Advanced excel course – Enrol Now.
To learn more about Data Analyst with R Course – Enrol Now.
To learn more about Big Data Course – Enrol Now.

To learn more about Machine Learning Using Python and Spark – Enrol Now.
To learn more about Data Analyst with SAS Course – Enrol Now.
To learn more about Data Analyst with Apache Spark Course – Enrol Now.
To learn more about Data Analyst with Market Risk Analytics and Modelling Course – Enrol Now.

Python Statistics Fundamentals: How to Describe Your Data? (Part I)

Python Statistics Fundamentals: How to Describe Your Data?

Statistics is a branch of mathematics which deals with the collection, analysis, interpretation and presentation of masses of numerical data. Statistics is a tool used to communicate our understanding of data. It helps us understand the world better, make assertions, and communicate our confidence in the statements we are making.

Two main statistical methods are used in data analysis:

  1. Descriptive statistics: This method is used to summarize data from a sample using measures such as the mean or standard deviation
  2. Inferential statistics: With this method, you can conclude data that are subject to random variation (e.g., observational errors, sampling variation).

This article is about the descriptive statistics which are used to describe and summarize the datasets. We are also going to see the available Python libraries to get those numerical quantities.

This whole topic will be covered in a series of two blogs. This first blog is about the types of measures in descriptive statistics. Furthermore, we will also see the built-in Python “Statistics” library, which has a relatively small number of the most important statistics functions.

Descriptive statistics can be defined as the measures that summarize a given data, and these measures can be broken down further into the measures of central tendency and the measures of dispersion. Measures of central tendency include mean, median, and the mode, while the measures of dispersion include standard deviation and variance.

We will cover the following topics in descriptive statistics:

  • Measures of Central Tendency
  1. Mean
  2. Median
  3. Mode
  • Measures of Dispersion
  1. Variation
  2. Standard Deviation

First, we need to import the Python statistics module.

Mean

The arithmetic mean is the sum of data divided by the number of data-points. It is a measure of the central location of data in a set of values that vary in range. In Python, we usually do this by dividing the sum of given numbers with the count of the number present. Python mean function can be used to calculate the mean/average of the given list of numbers. It returns the mean of the data set passed as parameters.

mean( ): Arithmetic mean (“average”) of data.

harmonic_mean( ): It is the reciprocal of the arithmetic mean of the reciprocals of the data (say for three numbers a, b and c, 1/mean = 3/(1/a + 1/b + 1/c)).

Median

median( ): Median or middle value of data is calculated as the mean of middle two. When the number of data points is odd, the middle data point is returned. The median is a robust measure of a central location and is less affected by the presence of outliers in your data compared to the mean.

median_low( ): Low median of data is calculated when the number of data points is odd. Here the middle value is usually returned. When it is even, the smaller of the two middle values is returned.

median_high( ): High median of data is calculated when the number of data points is odd. Here, the middle value is usually returned. When it is even, the larger of the two middle values is returned.

Mode

mode( ): Mode (most common value) of discrete data. The mode (when it exists) is the most typical value and is a robust measure of central location.

Measures of Dispersion

Measures of dispersion are statistics that describe how data varies, usually relative to the typical value. While measures of centre give us an idea of the typical value, measures of spread give us a sense of how much the data tends to diverge from the typical value.

These following functions (from the statistics module in python) calculate a measure of how much the population or sample tends to deviate from the typical or average values.

Data Science Machine Learning Certification

Population Variance

pvariance( ): Returns the population variance of data. Use this function to calculate the variance from the entire population. To estimate the variance from a sample, the variance ( ) function is usually a better choice. When called with the entire population, this gives the population variance σ². When called on a sample instead, this is the biased sample variance s², also known as variance with N degrees of freedom.

Population Standard Deviation

pstdev( ): Return the population standard deviation (the square root of the population variance)

Sample Variance

variance ( ): Returns the sample variance of data, an iterable of at least two real-valued numbers. Variance, or second moment about the mean, is a measure of the variability (spread or dispersion) of data. A large variance indicates that the data is spread out; a small variance indicates it is clustered closely around the mean. If the optional second argument is given to the function, it should be the mean of data. This is the sample variance s² with Bessel’s correction, also known as variance with N-1 degrees of freedom.

Sample Standard Deviation

stdev( ): Returns the sample standard deviation (the square root of the sample variance)

Conclusion

So, this article focuses on describing and summarizing the datasets, also helping you to calculate numerical quantities in Python. It’s possible to get descriptive statistics with pure Python code, but that’s rarely necessary. In the next series of this blog we will see the Python statistics libraries which are comprehensive, popular, and widely used especially for this purpose.


Interested in a career in Data Analyst?

To learn more about Data Analyst with Advanced excel course – Enrol Now.
To learn more about Data Analyst with R Course – Enrol Now.
To learn more about Big Data Course – Enrol Now.

To learn more about Machine Learning Using Python and Spark – Enrol Now.
To learn more about Data Analyst with SAS Course – Enrol Now.
To learn more about Data Analyst with Apache Spark Course – Enrol Now.
To learn more about Data Analyst with Market Risk Analytics and Modelling Course – Enrol Now.

Call us to know more