Dexlab, Author at DexLab Analytics | Big Data Hadoop SAS R Analytics Predictive Modeling & Excel VBA - Page 29 of 80

5 On-Going Predictive Analytics Applications That Marketers Should Be Familiar With

5 On-Going Predictive Analytics Applications That Marketers Should Be Familiar With

Predictive Analytics is a very popular concept, and increasingly often, the marketing strategies are tied to the very idea of predictive analytics. However, businesses seeking insights about the future aren’t satisfied with whatever happened in the past. They want to know more, and that’s where the promising role of predictive analytics comes forth.

In this article, we will talk about some modern applications of predictive analytics that are deriving great results in the marketing sphere:

2

Five On-Going Predictive Analytics Marketing Applications

Customer behavior models

Once only bigwig companies, like Amazon and eBay had the ability to do customer behavior prediction, but with increasing expansion of technology, even smaller companies have adopted the practice. Developing a comprehensive catalogue of predictive models is for sure a challenging task, but fortunately a number of relatively easier model types are plying assistance in the marketing scope. Amongst them, three most significant predictive models are Cluster Models, Propensity Models and Collaborative Filtering.

Assessing and prioritizing leads

With 3 B2B marketing use cases, here’s how we can predict early success and prepare the base for more complex use of predictive analytics:

  • Predictive Scoring – Prioritizing known leads, prospects, and accounts based on how they are probable to act upon.
  • Identification Models – Determining and acquiring prospects with characteristics akin to existing consumers.
  • Automated Segmentation – It’s crucial to segmenting leads for customized messaging.

The above-said groundwork helps prepare sales team to better apply the strategies and prioritize leads that can be converted into buyers. But of course, the techniques mentioned above need a high sales volume to perfectly prepare a robust predictive model.

Assessing which products or services to introduce into the market

Data visualization is crucial. It is not only visually effective, but is also ideal in guiding actions, based on customer behavior. It notifies which type of customers lives near a particular store, what is their average age-density and what kind of products they buy: do they purchase hard or soft goods, who goes for grocery shopping, the aged ones or the younger ones, and so on.

Content is the king

Targeting the right customers with the right content at the right moment boosts customer segmentation. It’s one of the most common predictive analytics marketing tricks because it’s simple, effective and directly impacts ROI. Some of the most popular predictive analytic models for content targeting are response modeling, affinity analysis and churn analysis – all of them can foretell you whether it would be fruitful to combine digital and print subscriptions or keep them separate or help you differentiate between a content that should levy a subscription fee from a content that has a one-time sales price.

Enhancing marketing strategies with predictive analytics

 Apart from the above 4 uses, few other drilled-down uses of predictive analytics in the marketing domain are as follows:

  • Gaining access to internal structured data
  • Accessing social media data
  • Employing behavior scoring on customer data

These applications could ascertain whether a social media- based marketing campaign would meet a raging success or a mobile marketing strategy would be more beneficial for the target audience.

For readers interested in making predictive analytics your career option, opt for SAS certification for predictive modeling from DexLab Analytics. At present, SAS predictive modeling training is the go-to course program you need to give wings to your analytics career.


The article has been sourced from   https://www.techemergence.com/predictive-analytics-for-marketing-whats-possible-and-how-it-works


Interested in a career in Data Analyst?

To learn more about Machine Learning Using Python and Spark – click here.

To learn more about Data Analyst with Advanced excel course – click here.
To learn more about Data Analyst with SAS Course – click here.
To learn more about Data Analyst with R Course – click here.
To learn more about Big Data Course – click here.

How Some Astonishing Techs of 2018 are Influencing Development in Africa

How Some Astonishing Techs of 2018 are Influencing Development in Africa

The technological evolution is conquering things which we previously considered to be strictly human. Addressing the scope of current tech space, we can say that the possibilities are endless, quite literally. AI is accomplishing tasks we never thought were feasible, such as composing music and creating videos. With the help of analytics, doctors can predict the effectiveness of cancer treatments in days; whereas earlier precious months were wasted to determine the same. In Africa, AI-powered technology will soon be employed to tackle burning social problems.

So, let’s take a look at some current tech trends that are inspiring development in Africa.

New data sources:

The availability of new sources of data plays a pivotal role in current tech advancements. For example, consider the financial inclusion of a nation’s population. Traditionally, financial institutes analyze financial history of an individual to determine if the person is eligible for a loan or not; which includes credit scores, IDs and other relevant documents. However, this excluded a large portion of the population who never had the chance to build a credit history due to the absence of any form of documentation. FinTech companies in East Africa have adopted a different approach-they are analyzing available mobile data about a person, like the frequency of getting a recharge, and making lending decisions on the base of this data. Thus, more people are now being able to access financial services and accomplish their goals, like educating children or starting businesses.

New features in SAS platform have the ability to analyze images. This is benefiting rangers working for wildlife conservation as previously they would have to manually sort the pictures of animals into species and sexes. Now, SAS’s new AI-driven technology can do the classification and rangers can focus on more important tasks.

Improved predictions:

Africa is seeing the emergence of new machine learning algorithms, like the extreme gradient boosting model, which are allowing data scientists to make more precise predictions. In Nigeria, this is boosting the development of models that prevent customer churn in the telecom industry. These models assess customer information, like billing data, purchase history, demographics and service usage, and create loyalty profiles that enable better marketing campaigns.

Bring into play the unstructured data pool:

Generally, companies crunch data from structured data sources, like transactional data. However, tapping into unstructured data sources, like customer complaints, reviews and text information, can be highly advantageous for businesses. These data sources help predicting customer churn more accurately.

Plunging into Deep Learning:

Deep learning falls under the category of machine learning, which is creating waves of excitement all over the world. It has the ability to model complex concepts in data through the use of high-level structures, algorithms and multiple processing steps. Deep learning teaches computers to recognize patterns through the numerous processing steps and perform tasks that are conventionally carried out by humans, such as image identification and speech recognition.

These models are improving traditional techniques used in credit risk modeling and fraud detection. SAS has collaborated with Equifax to implement deep learning models for improved risk management.

Nigeria has turned its focus on upskilling its people in data science, so that they can take advantage of this AI-era and become an outsourcing hub for deep learning projects.

Emotionally intelligent bots:

An exciting application of AI and language processing is chatbots. They are programmed to enable conversations between machines and humans. This helps save a lot of time and money that was previously wasted on performing repetitive and mundane tasks, such as responding to customer queries related to their bank accounts.

Recently, United Bank of Africa launched its chatbot, named Leo, which is in fact a Facebook bot that allows bankers to carry out real-time transactions and other banking activities, like opening accounts and paying bills.

Thus, we are entering an era where machines can think and learn utilizing the power of AI. AlphaGo, a programme created by Google in 2016, has been able to defeat the best human players of this ancient Chinese game. And AlphaGo Zero, the next version, learned by playing against itself and after a period of time defeated AlphaGO.

To read more blogs on current technologies, follow Dexlab Analytics– we provide the best Machine Learning training in Delhi. Take a look at our machine learning courses in Noida.


Interested in a career in Data Analyst?

To learn more about Data Analyst with Advanced excel course – Enrol Now.
To learn more about Data Analyst with R Course – Enrol Now.
To learn more about Big Data Course – Enrol Now.

To learn more about Machine Learning Using Python and Spark – Enrol Now.
To learn more about Data Analyst with SAS Course – Enrol Now.
To learn more about Data Analyst with Apache Spark Course – Enrol Now.
To learn more about Data Analyst with Market Risk Analytics and Modelling Course – Enrol Now.

Transforming Society with Blockchain and Its Potential Applications Worldwide

Transforming Society with Blockchain and Its Potential Applications Worldwide

According to Google Search, ‘blockchain’ is defined as “a digital ledger in which transactions made in bitcoin or in other cryptocurrency is recorded chronologically and publicly.”

Speaking in a way of cryptocurrency, a block is a record of new transactions that could mean the actual location of cryptocurrency. Once each block has completed its transaction, it’s added to the chain, creating a chain of blocks known as blockchain.

Suppose a Google spreadsheet is shared by each and every computer which is connected to the internet in this world. When a transaction happens, it will be recorded in a row of this spreadsheet. Just like a spreadsheet has rows, Blockchain consists of Blocks for each transaction.

Whoever has access to a computer or mobile can connect to the internet and can have access to the spreadsheet and add a transaction, but the spreadsheet doesn’t permit anyone to edit the information which is already available. No third party can interfere into its transactions, therefore saves time and conflict.

1

Types of Blockchains:

  • Open and permission-less: Public and permissionless blockchains look like bitcoin, the first blockchain. All exchanges in these blockchains are open and no authorizations are required to join these circulated elements.
  • Private and permission: These blockchains are constrained to assigned individuals, exchanges are private, and authorization from a proprietor or supervisor substance is required to join this system. These are frequently utilized by private consortia to oversee industry esteem chain openings.
  • Hybrid blockchains: An extra region is a developing idea of sidechain, which takes into consideration distinctive blockchains (open or private) to speak with each other, empowering exchanges between members crosswise over blockchain systems.

Various Applications Of Blockchain Are As Follows:

a) Smart Contracts:

Smart Contracts eases the way we exchange money, property, shares and avoids third person/party conflicts. Smart keys access can only be permitted to the authorized party. Basically, computers are given the command to control the contracts and to release or hold the funds by giving the keys to the permitted persons.

For example, if I want to rent an office space from you, we can do this in blockchain using cryptocurrency.  You will get a receipt which is saved in the virtual contract and I will get the digital entry key which will reach me by a specified date. If you send the key before the specified date, the function holds it and releases both receipt and the key when the date arrives.

If I receive the key I surely should pay you. And this contract will be canceled when the time gets complete, and it cannot interfere as all the participants will be alerted. The Smart contracts can be used for insurance premiums, financial derivatives, financial services, legal processes etc.

b) Digital Identity:

The future of blockchain will be blooming in the coming years. Blockchain technologies make both managing and tracking digital identities reliable and systematic, resulting in easy registering and minimizing fraud.

Be it national security, citizenship documentation, banking, online retailing or healthcare, identity authentication and authorization is a process entangled in between commerce and culture, worldwide.  Introducing blockchain into identity-based mechanisms can really bring captivating solutions to the security problems we have online.

Blockchain technology is known to offer a solution to many digital identity issues, where identity can be uniquely validated in an undeniable, unchangeable, and secured manner.

Present-day methods involve problematic password-based systems of known secrets which are exchanged and stored on insecure computer systems. Blockchain-based certified systems are actually built on undeniable identity verification for using digital signatures based on the public key related cryptography.

In blockchain identity confirmation, the only check that is performed is to know if the transaction was signed by the authorized private key. It is implied to whoever has access to the private key is the owner and the exact identity of the owner is deemed unrelated.

c) Insurance:

Claims dealing can be disappointing and unrewarding. Insurance agents need to go through deceitful cases and deserted approaches, or divided information sources for clients to express a few – and process these documents manually. Space for mistake is enormous. The blockchain gives an ultimate framework for hazard-free administration and clarity. Its encryption properties enable insurers to represent the ownership to be protected.

“This will be the toughest on the portions of the industry that are least differentiated, where consumers often decide based on price: auto, life, and homeowner’s insurance.” — Harvard Business Review

d) Supply-Chain Communications and Proof-of-Provenance:

The majority of the things we purchase aren’t made by a single organization, yet by a chain of providers who offer their ingredients (e.g., graphite for pencils) to an organization that gathers and markets the final commodity. On the off chance that any of those commodities flops, in any case, the brand takes the brunt of the backfire — it holds most of the duty regarding its supply chain network.

However, consider the possibility that an organization could proactively give carefully perpetual, auditable records that show stakeholders the condition of the item at each esteem included process.

This is not a little task: The worldwide supply chain network is evaluated to be worth $40 trillion; and from a business-process point of view, it’s a fabulously incapable chaos. As a related issue, blockchain can be utilized to track diamonds, creative skill, real estate, and practically any other resources.

e) Music Industry:

While music lovers have hailed digitization as the popular government of the music business, 15.7 billion dollar music industry is confusingly continuing as before. Music piracy through unlawfully downloaded, duplicated and shared content eats into the artist’s sovereignties and music labels’ income. Added to this, is the absence of a vigorous rights administration framework, which prompts loss of income to the artist.

Also, the income, when it really achieves the artist, can take up to two years! Another region of concern is unpaid sovereignties, which are frequently suspended in different stages because of missing data or rights possession. There is additionally an absence of access to continuous advanced sales information, which if accessible can be utilized to strategize advertising efforts more successfully.

These very zones are the place Blockchain can have stunning effects. As a publically accessible and decentralized database that is distributed over the web, Blockchain keeps up lasting and undeletable records in cryptographic format. Exchanges happen over a peer to peer system and are figured, confirmed and recorded utilizing a computerized agreement strategy, disposing of the requirement for an intermediator or outsider to oversee or control data.

The very engineering of Blockchain being unchanging, dispersed and distributed conveys enormous potential to manage the present troubles influencing the music business.

An essential region in which Blockchain can bring out positive change is in the formation of a digital rights database. Digital rights articulation is one of the basic issues distressing the present music industry. Recognizing copyright of a melody and characterizing how sovereignties ought to be part of musicians, entertainers, distributors, and makers are troublesome in digital space. Regularly artists miss out on sovereignties because of complicated copyright condition.

Blockchain’s changeless distributed ledger framework, which guarantees that no single organization can assert proprietorship, ensures an ideal arrangement. Secure documents with all applicable data, for example, structure, versus, straight notes, cover craftsmanship, permitting, and so on, can be encoded onto the Blockchain making a changeless and inerasable record.

f) Government and Public records:

The administration of public services is yet another region, where blockchain can help diminish paper-based procedures, limit fraud, and increment responsibility amongst specialists and those they serve.

Some US states are volunteering to understand the advantages of blockchain: the Delaware Blockchain Initiative propelled in 2016, expects to make a proper legitimate foundation for distributed ledger shares to increase productivity and speed of consolidation administrations.

Illinois, Vermont, and different states have since reported comparative activities. Startup companies are sponsoring in the effort also: in Eastern Europe, the BitFury Group is presently working with the Georgian government to secure and track government records.

Conclusion:

This article focused on the blockchain and its applications in various industries explains challenges and potentials and how people can secure their information digitally without any issues and increasing their ability. As these applications are still under development and yet to be untangled in the future, blockchain could become a powerful tool conducting fair trade, improving business and supporting the society.

To never miss a beat of technology related news and feeds – follow DexLab Analytics. We are a team of experts offering state of the art business analyst training courses in Gurgaon. Not only that, we provide a plethora of machine learning and Hadoop courses too for all the data-hungry candidates. So, drop by and quench your thirst for data from us!

About the Author:

K.Maneesha is an SEO Developer At Mindmajix.com. She holds a masters degree in Marketing from Alliance University, Bangalore. Maneesha is a dog-lover and enjoys traveling with friends on trips. You can reach her at manisha.m4353@gmail.com. Her LinkedIn profile Maneesha Kakulapati.


Interested in a career in Data Analyst?

To learn more about Machine Learning Using Python and Spark – click here.

To learn more about Data Analyst with Advanced excel course – click here.
To learn more about Data Analyst with SAS Course – click here.
To learn more about Data Analyst with R Course – click here.
To learn more about Big Data Course – click here.
Comprehensive Tableau Reference Guide: Calculated Field- Type Conversion Functions

Comprehensive Tableau Reference Guide: Calculated Field- Type Conversion Functions

In this blog, we introduce Type Conversion Functions. In the earlier blogs of the Comprehensive Tableau Reference Guide blog series, we have covered Logical Functions, Number Functions and Date Functions. These blogs are easy-to-read and particularly helpful for Tableau rookies who want to develop a foundational knowledge about the Calculated Field fundamentals. These step-by-step guides are perfect for Tableau enthusiasts who want to understand how and when to use the various functions available in Tableau’s calculated fields.  

Today, we will explain Type Conversion Functions. This group of functions enables users to change the data type of fields. You can convert the result of an expression to another data type. For example, using the Type Conversion functions, you can convert numbers, like age values, to strings. These functions are useful when the underlying data source needs some groundwork to harness the full potential of your visualization.

These functions are uncomplicated and easy to understand. So, let’s dive right in!

  • DATE Function

DATE(expression)

The date function is used to convert a number, string or date expression to a date. Example:

  • DATETIME Function

DATETIME(expression)

Datetime function takes the functionality of the Date function mentioned above a step further as it can be used to return a time component. This function is used to get back a datetime from a date, number or string expression. Example:

  • FLOAT Function

FLOAT(expression)

The Float function is used to return its argument as a floating point number. Example:

  • INT Function

INT(expression)

The INT function is used to convert its argument into an integer. This function truncates result of an expression to the integer closest to zero. Example:

  • STR Function

STR(expression)

The STR function is used to convert its argument into string data type. Example:

With the help of these functions, you can convert the result of arguments to different data types. For instance, if you want to make certain that all the values within date fields are date or datetime data types, then Date function and Datetime function comes very handy.

Want to learn about all the amazing features available in Tableau? Follow DexLab Analytics– we are among the leading institutes providing Tableau certification in Delhi. To know more about our Tableau BI training courses, visit our website. Check back for previous blogs where we have covered some essential Calculated Field functions.


This article has been sourced from: https://interworks.com/blog/ccapitula/2015/04/30/tableau-essentials-calculated-fields-type-conversion


Interested in a career in Data Analyst?

To learn more about Machine Learning Using Python and Spark – click here.

To learn more about Data Analyst with Advanced excel course – click here.
To learn more about Data Analyst with SAS Course – click here.
To learn more about Data Analyst with R Course – click here.
To learn more about Big Data Course – click here.
To Be Ahead of the Curve: Banks Must Beef Up Technology

To Be Ahead of the Curve: Banks Must Beef Up Technology

Technology is critical. To improve efficiency, reduce costs, stay on the cutting edge over tailing rivals, fulfill customer requirements and initiate a proper risk management process, technology is an incredible tool to possess.

The abovementioned facts received momentum at the SAS Risk & Finance Analytics Roadshow in Lagos, during which it was inferred that the banks nowadays are adapting themselves to regulatory changes, thus reducing costs in no time.

In this context, Charles Nyamuzinga, Senior Business Solutions Manager, Pre-Sales Risk Practice, stated that banks in Africa need to confront with additional challenges, including risk analytics skills gaps, challenges associated with data management and integrating finance and risk management nuances across an organization.

2

“But, on the positive side, they have started considering technology as a way of eliminating these challenges, and have access to new streams of data that are also helping to advance the financial inclusion mandate,” he noted.

In compliance with global financial norms, African banks should by now be compliant with the new IFRS9 Accounting Standard, which comes with some changes in the way expected credit losses used to be calculated.

“There is also need to start thinking about the new ‘Basel IV’ framework, which impacts on how banks calculate their risk weighted assets, and the amount of capital they need to offset those risks,” he added.

According to Charles, banks are feeling intense regulatory pressure nowadays, while tussling with daily requirements, challenges and questions associated with taking stress tests. The regulators have become severe on stress testing processes, and that may be for good! Besides, banks need to worry about the effect on reputation, capital shortfalls and negative influence on earnings, along with non-compliance penalties.

His concern was thoroughly evident in these statements, “There’s a good chance that banks in Africa could get this wrong if they use disparate and fragmented systems for data management, model building and implementation and reporting – which is often the case – or if they try to do the computations manually.


“The biggest causes of incorrect modeling are data management and quality issues and skills shortages. Banks have to obtain and analyze enormous amounts of detailed data, for example. And, to comply with IFRS 9, banks must look at millions of customers with hundreds of data points.”

In support of the above observations, SAS Sales Manager, West Africa, Babalola Oladokun raised concerns if a bank ends up miscalculating a customer’s credit score, it would result in giving a loan to someone, who for sure won’t be able to repay it. This can have serious implications for IFRS 9expected credit loss calculations. Furthermore, if a bank lacks in capital on hand to offset the loan deficiency, the case will go straightaway to Basel Capital requirements compliance issues.

“Data gathering and manipulation from disparate data sources wastes time and resources that banks could have used to develop new products and find more convenient ways to serve their customers – something their competitors in the FinTech space are very good at,” he noted.

As last thoughts, FinTechs use virgin data streams to draw instant conclusions and fuel decision-making processes for customers. For an example, they base their inferences about granting a loan to someone who doesn’t even have a bank account – surely, this is an innovative way to give non-banking population access into the world of finance.

If finance and big data interests you, we suggest you go through our credit risk management courses in Delhi. DexLab Analytics is not only a trailblazer in credit risk modelling courses, but also a robust platform for training young minds.


This article first appeared in – https://guardian.ng/business-services/technology-crucial-to-tackling-risks-skill-gaps-in-banks


Interested in a career in Data Analyst?

To learn more about Data Analyst with Advanced excel course – Enrol Now.
To learn more about Data Analyst with R Course – Enrol Now.
To learn more about Big Data Course – Enrol Now.

To learn more about Machine Learning Using Python and Spark – Enrol Now.
To learn more about Data Analyst with SAS Course – Enrol Now.
To learn more about Data Analyst with Apache Spark Course – Enrol Now.
To learn more about Data Analyst with Market Risk Analytics and Modelling Course – Enrol Now.

Comprehensive Tableau Reference Guide: Calculated Field-Date Functions

Comprehensive Tableau Reference Guide: Calculated Field-Date Functions

Calculated fields in Tableau are new fields created by a user that are saved in the data store and can be applied for constructing more robust visualizations.

Comprehensive Tableau Reference Guide is a blog series covering the fundamentals of Tableau Software to help you develop a foundational knowledge of the Calculated Field functions. So, if you are a newbie planning to get started with Tableau or if you simply want to explore the popular features in Tableau, then these step-by-step guides are perfect for you.

In this bog, we shall discuss about the Date Functions that you can use after creating a calculated field. In the previous two articles of this blog series, we explored Logical Functions and Number Functions. Now, let’s begin our exploration of Date Functions.

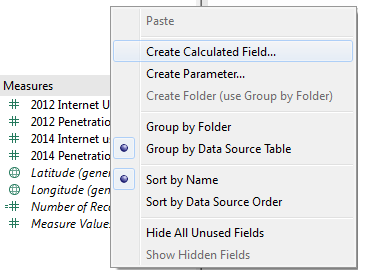
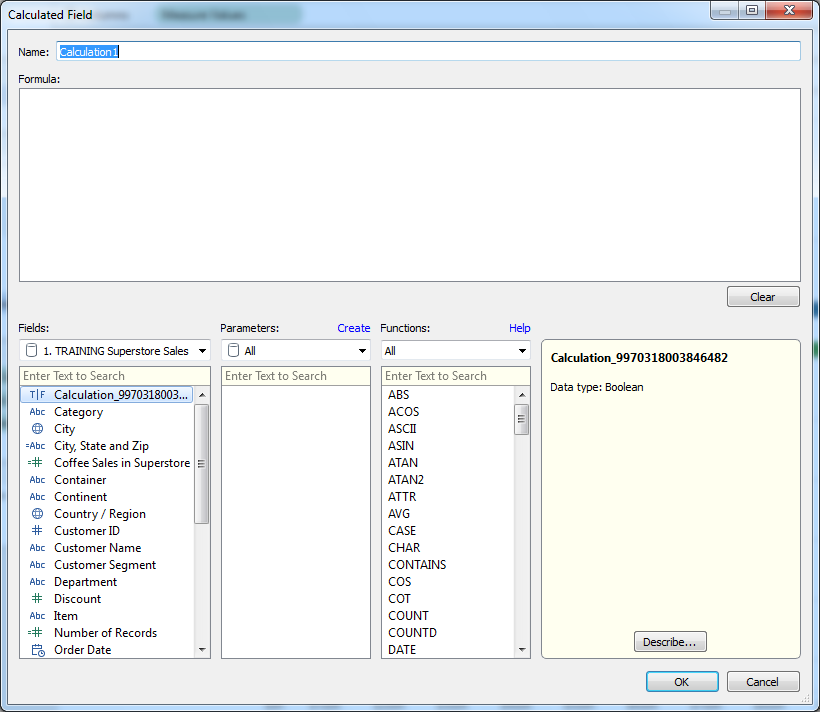
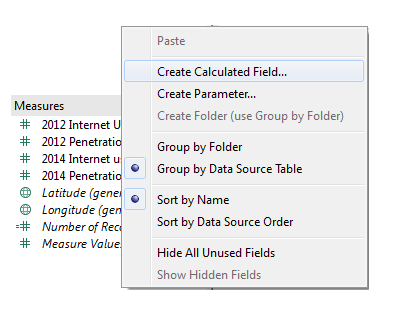
  • To open the Calculated Field window, right-click anywhere over the Date window (sidebar) and the menu appears on the screen.

  • Select the option ‘’Create Calculated Field”. This brings up the Calculated Field window. If you right-click on a specific dimension or measure to create a calculation, then the formula text region of the Calculated Field displays it.

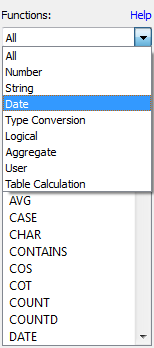
  • Next, select the option ‘’Date’’ from the drop-down menu under ‘’Functions’’. This filters the functions to display only a list of Date Functions.

  • The date_part, which is applied in a number of Date Functions, can take the following values:
  • Second (0-60)
  • Minute (0-59)
  • Hour (0-23)
  • Day (1-31)
  • Weekday (1-7 or use their names, i.e. ‘’Monday’’, etc.)
  • Week (1-52)
  • DayofYear (1-365)
  • Month (1-12 or use their names, i.e. ‘’December’’, etc.)
  • Quarter (1-4)
  • Year (four-digit representation)

Next, let’s examine the Date Functions one by one:

  • DATEADD Function

DATEADD(date_part, interval, date)

The DATEADD function enables a user to specify a part of a date and then increment it. This function alters the date by incrementing the date_part by the number mentioned in the interval. Example:

  • DATEDIFF Function

DATEIFF(date_part, date1, date 2, start_of_week)

This function returns the difference between date1 and date2, expressed in units decided by date_part. The parameter start_of_week is optional, and if it is undefined, then the associated data source determines the start of the week.

  • DATENAME Function

DATENAME(date_part, date, [start_of_week])

Using this function, the date_part parameter of the date is returned as a string. Here also, the start_of_week parameter isn’t compulsory. Example:

  • DATEPARSE Function

DATEPARSE(format, string)

This function works exactly in the opposite manner of DATENAME function. It converts a string into a date or time following the format specified by the user. In case the string and specified format don’t match, then a Null value is returned. Example:

  • DATEPART

DATEPART(date_part, date, start_of_week)

This function returns the date_part parameter of the date as an integer. Again, the start_of_week parameter isn’t compulsory. Example:

When the date_part parameter is set as weekday, start_of_date parameter is excluded, as in this case Tableau uses a specific order to apply offsets.

  • DATETRUNC

DATERUNC(date_part, date, start_of_week)

This function is used to round off the date to the accuracy specified in the date_part of the function. Example:

The start_of_week is optional, and if excluded, then the data source determines it.

  • DAY

DAY(date)

This function is used to return the day of a specific date as an integer. Example:

  • ISDATE

ISDATE(string)

This function runs a logical test and is also incorporated within the list of Logical Functions. It tests a string and indicates if a specified data is valid (true) or not (false). Example:

  • MAX Function

MAX(expression) or MAX(expr1, expr2)

The MAX function is included in other categories of functions too. This function is used to return the maximum of a singular expression across all records or the maximum between two expressions for each record. Both the arguments need to be of the same type. In case one of the arguments is NULL, it returns a NULL value. Example:

  • MIN Function

MIN(expression) or MIN(expr1, expr2)

Similar to the MAX function, MIN function is popularly used as a Number Function, but is also used as a Date Function. This function is used to return the minimum of a singular expression across all records or the minimum between two expressions for each record. Both the arguments need to be of the same type. In case one of the arguments is NULL, it returns a NULL value. Example:

  • MONTH

MONTH(date)

This function is used to return the month of a particular date as an integer. Example:

  • NOW

NOW()

This function is used to get the current date and time. Example:

  • TODAY

TODAY()

This function is used to get the current date. Example:

  • YEAR

YEAR(date)

This function is used to return the year of a particular date as an integer. Example:

Want to learn more about Tableau? Follow DexLab Analytics, one of the leading Tableau training institutes in Delhi, to read more blogs covering all the fantastic features in Tableau. Check back for articles covering Logical Functions and Number Functions. If you are looking for Tableau certification courses in Delhi, check DexLab’s online and classroom tableau training courses.


This article has been sourced from: https://interworks.com/blog/ccapitula/2015/04/15/tableau-essentials-calculated-fields-date-functions


Interested in a career in Data Analyst?

To learn more about Data Analyst with Advanced excel course – Enrol Now.
To learn more about Data Analyst with R Course – Enrol Now.
To learn more about Big Data Course – Enrol Now.

To learn more about Machine Learning Using Python and Spark – Enrol Now.
To learn more about Data Analyst with SAS Course – Enrol Now.
To learn more about Data Analyst with Apache Spark Course – Enrol Now.
To learn more about Data Analyst with Market Risk Analytics and Modelling Course – Enrol Now.

6 Predictive Analytics Use Cases Proven To Ace Marketing Efforts

6 Predictive Analytics Use Cases Proven To Ace Marketing Efforts

Predictive analytics includes a set of functions that leverage customer information to construct interesting assumptions about future potential customers. They play an integral role in determining a customer’s lifecycle.

What’s more, predictive analytics influences company strategy even before any prospect gets converted into a lead. That’s the way it functions, and as the leads are converted into customers, the new data collected impacts the next-generation marketing activities. The process is almost cyclical.

In this post, we will discuss about 6 use cases for predictive analytics that shows a significant impact on marketing ROI.

And here it starts:

Better Lead Scoring

With predictive analytics, lead scoring becomes a whole data-driven process that targets customers. It helps you leverage the actions of existing customers to build better future strategies. No more it remains an anecdotic listicle of measures from sales, instead it points out the ‘hot’ leads that can be pushed down through the funnel of sales.

Improved Lead Nurturing

Remember, one-size-fits-all doesn’t apply to lead nurturing.

For converting prospects into leads, a definitive plan for lead nurturing should be adopted. Predictive analytics is the hands-down tool to consider: take cue from behavioral and demographic data to push leads towards the sales funnel.

Smart Content Distribution

Today, every company invests in quality content creation. Content marketing has the power to fetch measurable ROI for your company. And this is where predictive analytics play a vital role: it analyses the type of content customers would find interesting, based on certain behavioral and demographic data and then automatically distribute them to the prospective leads.

2

Protecting Baseline Becomes Easy

Predictive analytics help learn from the past mistakes. Past behavior is a testimony of future behavior, and it holds true for customers, as well. A clear analysis of behavioral patterns of previously-churned customers in your company would help identify the red flags your present customers are showing, thus results in protecting your baseline for a better, secure future.

Develop Products Fit For Customers

Understanding what customers need becomes a tad too easier when you are armed with a set of behavioral, demographic and psychological data of your customers. Again possible with predictive analytics! Leverage customer data and figure out what they are looking for.

Design Successful Future Campaign

Past performance analysis always leads to constructing better future campaign designs. As more and more new customers seem to enter your business, you need to leverage your data more precisely and curate content based on their preferences and requirements. And may even have to target specific audiences! So, treat past data as a treasure!

As parting thoughts, these six strategies for predictive modeling are perfect for transforming your business. Today, data is the power. Clean, high-quality data have the potential to take your business venture to unforeseeable heights of success.

And for that and more, DexLab Analytics is here to help. Our skilled consultants can crack the toughest data management problems and provide solutions to make predictive modeling using SAS better. For SAS predictive modeling training, peruse over our course section on the website.

 
The article has been sourced from – https://blog.reachforce.com/blog/8-use-cases-for-predictive-analytics-in-marketing
 

Interested in a career in Data Analyst?

To learn more about Machine Learning Using Python and Spark – click here.

To learn more about Data Analyst with Advanced excel course – click here.
To learn more about Data Analyst with SAS Course – click here.
To learn more about Data Analyst with R Course – click here.
To learn more about Big Data Course – click here.

Easy-to-Read Tableau Reference Guide on Calculated Fields – Number Functions

Easy-to-Read Tableau Reference Guide on Calculated Fields

It’s not possible for everyone to ace in Tableau, at least not yet. Tableau is a versatile data visualization application that facilitates users to examine structured data virtually, while displaying information in several interactive graphic perspectives. Though it’s very easy to use and a lot of individuals use Tableau Desktop for creating data visualizations, it churns out best results when employed by expert hands.

Thus, to help Tableau stalwarts, we’re here with a set of blogs on Tableau Essentials that will help you dig into the basics of using this powerful data visualization software, especially Desktop versions 8.1 and 8.2. This blog is a continuation of the Tableau blog on Logical Functions. It was part I and this one, which exclusively sheds light on Number Functions is part II. Here, we will deeply focus on another group of functions implemented for Tableau’s calculated fields. Scroll below to get started…

First, open the Calculated Fields window, right-click on the sidebar (Data window) and choose Create Calculated Field:

TECFNumber1_0-01

Now, in the Calculated Field Window, choose Number from the Functions drop-down menu:

TECFNumber5-02

LN FUNCTION

LN(number)

It returns the natural log of the number. Now, if the numbers appear to be less than or equal to zero, the function tends to return NULL.

For an example,

TECFNumber6-03

LOG FUNCTION

LOG(number,[base])

LOG brings back the log of the number for a given base. In case, there’s no base, the function will use base 10 by default.

For an example,

TECFNumber7-04

PI FUNCTION

PI()

It helps return the numeric constant of PI.

TECFNumber8-05

POWER FUNCTION

POWER(number, function)

This function increases the number to the defined power.

For an example,

TECFNumber9

RADIANS FUNCTION

RADIAN(number)

This is a superb function to convert numbers from degrees to radians.

TECFNumber10

ROUND FUNCTION

ROUND(number,[decimals])

Use this function to round off any number to the nearest integer or to a particular number of decimal places.

For an instance,

TECFNumber11

SIGN FUNCTION

SIGN(number)

This function brings back the sign of a number.

In case of positive numbers, it returns a 1.

For zero, it returns a 0.

For negative numbers, the function returns a -1.

For an example,

TECFNumber12

SQRT FUNCTION

SQRT(number)

It returns the square root of a number.

TECFNumber13

SQUARE FUNCTION

SQUARE(number)

This function returns the square of the number.

For an instance,

TECFNumber14

ZN FUNCTION

ZN(expression)

The specialty of ZN function is that it evaluates any expression.

If the function is NULL, it will return a value of 0, and if not, the expression is returned as before.

For example,

TECFNumber15

STATISTICAL

MAX FUNCTION

MAX(number, number)

This function returns the maximal of two expressions for each record or an expression throughout all records. However, the two statements have to be the same type. If one or the other argument turns NULL, the function returns a value of NULL.

TECFNumber16

MIN FUNCTION

MIN(number, number)

Just like MAX function, MIN function too returns the minimal of an expression across the records or minimal of two expressions for a particular record. The two arguments must be similar in type. Also, if one or the other arguments hold NULL, MIN returns a value NULL.

TECFNumber17

TRIGONOMETRIC

ACOS FUNCTION

ACOS(number)

ACOS function returns the arc cosine of the number and the outcome is in radians.

Take a look,

TECFNumber18

ASIN FUNCTION

ASIN(number)

This function returns the arc sine of the number. And as usual the outcome is in radians.

TECFNumber19

ATAN FUNCTION

ATAN(number)

It returns the arc tangent of any number, and as usual the outcomes is in radians.

TECFNumber20

ATAN2 FUNCTION

ATAN2(y number, x number)

It’s quite similar to the previous ATAN FUNCTION, except it’s used for two given numbers. Otherwise, all remains same.

TECFNumber21

COS FUNCTION

COS(number)

Cos returns the cosine of an angle. Just mention the angle in radians.

For example,

TECFNumber22

COT FUNCTION

COT(number)

COT FUNCTION returns the cotangent of an angle. Marking of angles in radians is important.

TECFNumber23

SIN FUNCTION

SIN(number)

This function returns the sine of an angle. For example,

TECFNumber24

TAN FUNCTION

TAN(number)

 TAN FUNCTION returns the tangent of an angle. You just need to mention the angle in radians and that’s it.

TECFNumber25

Typically, it all depends on the nature of your business; if it needs, you have to go through Number Functions routinely, otherwise not. Now, if you really have to use them then peruse over Tableau course details at DexLab Analytics. Being a premier Tableau training institute in Gurgaon, DexLab will offer a whole new layer of insight into Tableau Essentials.


The article has been sourced from – https://interworks.com/blog/ccapitula/2015/04/07/tableau-essentials-calculated-fields-number-functions


Interested in a career in Data Analyst?

To learn more about Machine Learning Using Python and Spark – click here.

To learn more about Data Analyst with Advanced excel course – click here.
To learn more about Data Analyst with SAS Course – click here.
To learn more about Data Analyst with R Course – click here.
To learn more about Big Data Course – click here.

Comprehensive Tableau Reference Guide: Calculated Fields-Logical Functions

Comprehensive Tableau Reference Guide: Calculated Fields-Logical Functions
Comprehensive Tableau Reference Guide is a blog series for explaining the basics of Tableau Software. So, if you are a newbie planning to get started with Tableau or if you simply want to explore the popular features in Tableau, then these step-by-step guides are perfect for you. In this blog, we will discuss about Logical Functions in Tableau.

  • Go to the Calculated Field window:

1

  • Go to Functions table. From the drop-down menu, select the option ‘’Logical’’:

2

  • This selection filters the list of functions to display a listing of only logical functions, which consists of seven different functions:

3

We will explain these functions one by one.

  • CASE Function:

CASE expression WHEN value1 THEN return1 WHEN value2 THEN return2… ELSE default return END

The CASE function is applied when we need to perform a logical test. This function returns values based on the result of the logical test. A CASE function can also be written as an IF function. Generally, CASE function statements are simpler and shorter.

Example of a formula using CASE function:

004

Going through the country field, when the function comes across the value ‘’United States’’, it uses ‘’USA’’. On the other hand, when it comes across “United Kingdom’’, the function uses ‘’UK”. For all other values in the country field, ‘’World’’ is used.

  • IF Function:

IF test THEN value END/IF test THEN value ELSE else END

A logical test can be created using the IF function. The function works like this- IF the test is true THEN carry out the given condition. The test portion of the function must be Boolean. This can be achieved either by selecting a Boolean field from data source or by constructing the expression using operators and logical comparisons (AND, OR, NOT).

Example:

Logical205

IF test1 THEN value1 ELSEIF test2 THEN value2 ELSE else END

This statement is used when the functionality of IF function needs to be expanded. Additional IF-THEN statements can be incorporated through ELSEIF. Here’s an example to rewrite the CASE formula above with IF-THEN-ELSEIF statement:

Logical3-03

The result is the same as before.

  • IFNULL Function:

IFNULL(expression1, expression2)

The IFNULL function is used to perform a true/false test and check if the value in the tested field is NULL or not. If the value isn’t null then the first value of the function is used, and if the value is null then the second one is used.

Logical4_05

If Total Population of a country has no value, then it will be reset as zero and the null shall be eliminated from the newly created field.

  • IIF Function:

IIF(test, then, else, [unknown])

IIF function is very much alike the IF function described above, just a shorthand version for the IF-THEN-ELSE statement. The final argument of IIF function can define a value in case the test produces an unknown result. Like the IF function, the test must be Boolean, either by data type or the result of the test must give a Boolean value.

Here’s an example:

Logical5-06

If the % of change field is lower than 5% then the value Poor will be returned, or else the value Good will be returned.

  • ISDATE Function:

ISDATE(string)

The ISDATE function is used to determine if a string argument can be converted to a valid date (TRUE) or not (FALSE).

Example:

Logical6_1

This formula is supported by Tableau since the field used is a string data type, however each result will be FALSE. This function comes handy in case dates are formatted in a manner that is unrecognizable by a user, like ISO 8601.

Example:

Logical7_2

The above value stands for September 1, 2014 and is obviously a valid date.

  • ISNULL Function:

ISNULL(expression)

This is a simple function that checks if an expression is null (TRUE) or not (FALSE).

Example:

Logical8-03

The Filter card enables users to filter null values from their visualization.

  • ZN Function:

Statement: ZN(expression)

The ZN function is a variant of the ISNULL and IFNULL functions. It tests whether a function is null or not. In case the function is null, it returns a zero value.

Example:

Logical9_04

It is natural to feel overwhelmed when you see a list of logical functions for the first time. Since we have discussed each one of them, hopefully these functions will come handy in your visualization and data leveraging pursuits.

To learn more about Tableau functions, follow Dexlab Analytics– it is one of the best Tableau training institutes in Delhi. Do take a look at their Tableau BI training courses.


This article has been sourced from:  https://interworks.com/blog/ccapitula/2015/04/01/tableau-essentials-calculated-fields-logical-functions


Interested in a career in Data Analyst?

To learn more about Machine Learning Using Python and Spark – click here.

To learn more about Data Analyst with Advanced excel course – click here.
To learn more about Data Analyst with SAS Course – click here.
To learn more about Data Analyst with R Course – click here.
To learn more about Big Data Course – click here.

Call us to know more