Dexlab, Author at DexLab Analytics | Big Data Hadoop SAS R Analytics Predictive Modeling & Excel VBA - Page 26 of 80

How Hadoop Data Lake Architecture Helps Data Integration

How Hadoop Data Lake Architecture Helps Data Integration

New data objects, like data planes, data streaming and data fabrics are gaining importance these days. However, let’s not forget the shiny data object from a few years back-Hadoop data lake architecture. Real-life Hadoop data lakes are the foundation around which many companies aim to develop better predictive analytics and sometimes even artificial intelligence.

This was the crux of discussions that took place in Hortonworks’ DataWorks Summit 2018. Here, bigwigs like Sudhir Menon shared the story behind every company wanting to use their data stores to enable digital transformation, as is the case in tech startups, like Airbnb and Uber.

In the story shared by Menon, vice president of enterprise information management at hotelier Hilton Worldwide, Hadoop data lake architecture plays a key role. He said that all the information available in different formats across different channels is being integrated into the data lake.

The Hadoop data lake architecture forms the core of a would-be consumer application that enables Hilton Honors program guests to check into their rooms directly.

A time-taking procedure:

Menon stated that the Hadoop data lake project, which began around two years back, is progressing rapidly and will start functioning soon. However, it is a ‘’multiyear project’’. The project aims to buildout the Hadoop-based Hotonworks Data Platform (HDP) into a fresh warehouse for enterprise data in a step-by-step manner.

The system makes use of a number of advanced tools, including WSO2 API management, Talend integration and Amazon Redshift cloud data warehouse software. It also employs microservices architecture to transform an assortment of ingested data into JSON events. These transformations are the primary steps in the process of refining the data. The experience of data lake users shows that the data needs to be organized immediately so that business analysts can work with the data on BI tools.

This project also provides a platform for smarter data reporting on the daily. Hilton has replaced 380 dashboards with 40 compact dashboards.

For companies like Hilton that have years of legacy data, shifting to Hadoop data lake architectures can take a good deal of effort.

Another data lake project is in progress at United Airlines, a Chicago-based airline. Their senior manager for big data analytics, Joe Olson spoke about the move to adopt a fresh big data analytics environment that incorporates data lake and a ‘’curated layer of data.’’ Then again, he also pointed out that the process of handling large data needs to be more efficient. A lot of work is required to connect Teradata data analytics warehouse with Hortonworks’ platform.

Difference in file sizes in Hadoop data lakes and single-client implementations may lead to problems related to garbage collection and can hamper the performance.

Despite these implementation problems, the Hadoop platform has fueled various advances in analytics. This has been brought about by the evolution of Verizon Wireless that can now handle bigger and diverse data sets.

2

In fact, companies now want the data lake platforms to encompass more than Hadoop. The future systems will be ‘’hybrids of on-premises and public cloud systems and, eventually, will be on multiple clouds,’’ said Doug Henschen, an analyst at Constellation Research.

Large companies are very much dependent on Hadoop for efficiently managing their data. Understandably, the job prospects in this field are also multiplying.

Are you a big data aspirant? Then you must enroll for big data Hadoop training in Gurgaon. At Dexlab industry-experts guide you through theoretical as well as practical knowledge on the subject. To help your endeavors, we have started a new admission drive #BigDataIngestion. All students get a flat discount on big data Hadoop certification courses. To know more, visit our website.


Reference: searchdatamanagement.techtarget.com/news/252443645/Hadoop-data-lake-architecture-tests-IT-on-data-integration


Interested in a career in Data Analyst?

To learn more about Data Analyst with Advanced excel course – Enrol Now.
To learn more about Data Analyst with R Course – Enrol Now.
To learn more about Big Data Course – Enrol Now.

To learn more about Machine Learning Using Python and Spark – Enrol Now.
To learn more about Data Analyst with SAS Course – Enrol Now.
To learn more about Data Analyst with Apache Spark Course – Enrol Now.
To learn more about Data Analyst with Market Risk Analytics and Modelling Course – Enrol Now.

Industry Use Cases of Big Data Hadoop Using Python – Explained

Industry Use Cases of Big Data Hadoop Using Python – Explained

Welcome to the BIG world of Big Data Hadoop – the encompassing eco-system of all open-source projects and procedures that constructs a formidable framework to manage data. Put simply, Hadoop is the bedrock of big data operations. Though the entire framework is written in Java language, it doesn’t exclude other programming languages, such as Python and C++ from being used to code intricate distributed storage and processing framework. Besides Java architects, Python-skilled data scientists can also work on Hadoop framework, write programs and perform analysis. Easily, programs can be written in Python language without the need to translate them into Java jar files.

Python as a programming language is simple, easy to understand and flexible. It is capable and powerful enough to run end-to-end advanced analytical applications. Not to mention, Python is a versatile language and here we present a few popular Python frameworks in sync with Hadoop:


  • Hadoop Streaming API
  • Dumbo
  • Mrjob
  • Pydoop
  • Hadoopy


Now, let’s take a look at how some of the top notch global companies are using Hadoop in association with Python and are bearing fruits!

Amazon

Based on the consumer research and buying pattern, Amazon recommends suitable products to the existing users. This is done by a robust machine learning engine powered by Python, which seamlessly interacts with Hadoop ecosystem, aiding in delivering top of the line product recommendation system and boosting fault tolerant database interactions.

Facebook

In the domain of image processing, Facebook is second to none. Each day, Facebook processes millions and millions of images based on unstructured data – for that Facebook had to enable HDFS; it helps store and extract enormous volumes of data, while using Python as the backend language to perform a large chunk of its Image Processing applications, including Facial Image Extraction, Image Resizing, etc.

Rightfully so, Facebook relies on Python for all its image related applications and simulates Hadoop Streaming API for better accessibility and editing of data.

Quora Search Algorithm

Quora’s backend is constructed on Python; hence it’s the language used for interaction with HDFS. Also, Quora needs to manage vast amounts of textual data, thanks to Hadoop, Apache Spark and a few other data-warehousing technologies! Quora uses the power of Hadoop coupled with Python to drag out questions from searches or for suggestions.

2

End Notes

The use of Python is varied; being dynamically typed, portable, extendable and scalable, Python has become a popular choice for big data analysts specializing in Hadoop. Mentioned below are a couple of other notable industries where use cases of Hadoop using Python are to be found:


  • YouTube uses a recommendation engine built using Python and Apache Spark.
  • Limeroad functions on an integrated Hadoop, Apache Spark and Python recommendation system to retain online visitors through a proper, well-devised search pattern.
  • Iconic animation companies, like Disney depend on Python and Hadoop; they help manage frameworks for image processing and CGI rendering.


Now, you need to start thinking about arming yourself with big data hadoop certification course – these big data courses are quite in demand now – as it’s expected that the big data and business analytics market will increase from $130.1 billion to more than $203 billion by 2020.


This article first appeared on – www.analytixlabs.co.in/blog/2016/06/13/why-companies-are-using-hadoop-with-python


Interested in a career in Data Analyst?

To learn more about Data Analyst with Advanced excel course – Enrol Now.
To learn more about Data Analyst with R Course – Enrol Now.
To learn more about Big Data Course – Enrol Now.

To learn more about Machine Learning Using Python and Spark – Enrol Now.
To learn more about Data Analyst with SAS Course – Enrol Now.
To learn more about Data Analyst with Apache Spark Course – Enrol Now.
To learn more about Data Analyst with Market Risk Analytics and Modelling Course – Enrol Now.
Guide on Tableau Essentials: Get Started with Calculated-Field User Functions

Guide on Tableau Essentials: Get Started with Calculated-Field User Functions

We are back with another article on Calculated Fields in Tableau! These step-by-step guides are for helping Tableau rookies master the basics of Tableau software. Not just beginners, these articles are suitable for all Tableau enthusiasts who want to explore the multiple cool features available in Tableau’s Calculated Field.

In today’s blog, we are discussing User Functions. User functions can generate filters depending on the data source. It is used to reference the identity, domain and membership of the current user on Tableau Server or Tableau Online. To access the User Functions window, right click on the Measure or Dimension window and select the option ‘’Create Calculated Field’’. Next select the option ‘’User’’ from the function drop-down menu.

Now, let’s examine the different User Functions one by one.

FULLNAME Function

FULLNAME()

The FULLNAME Function is used to return the full name of the current user. The full name is the Tableau Server or Tableau Online name used to sign in. Except for that, the Tableau Desktop user’s local or network full name is used. Example:

ISFULLNAME Function

ISFULLNAME(string)

This function gives back the value ‘’TRUE’’ if the user’s full name matches the specified string and returns ‘’FALSE” if it doesn’t match. Example:

ISMEMBEROF Function

ISMEMBEROF(string)

If the logged-in person currently using Tableau is a member of the group that matches the string then the ISMEMBEROF function gives back ‘’TRUE’’.  It returns ‘’FALSE’’ if the member is not signed in. Example:

ISUSERNAME Function

ISUSERNAME(string)

The ISUSERNAME Function is used to perform a true/false test where it returns ‘’TRUE’’ when the logged-in user’s name matches the string. Example:

USERDOMAIN Function

USERDOMAIN()

Once the user is signed into Tableau Server, the USERDOMAIN function may be used to return his/her domain. It returns the Windows domain when the user is on a domain. If not, then the function returns a null string. Example:

USERNAME Function

USERNAME()

The USERNAME function returns the username of the current tableau desktop user, which is the Tableau Server or Tableau Online username if the user is signed in. In case the user isn’t signed in, the local or network username is shown. Example:

This brings us to a close on user functions. These functions are one of the many amazing features of Tableau Software that offer users high-level of flexibility. They are very useful for developing customized views on Tableau server or Tableau Online, as the functions work like filters that limit what is visible to users depending on their username and domain.

Calculated fields make Tableau dashboards way more functional. In these blogs, we are covering the basics so you understand how to apply the functions. If you are interested to learn more about Tableau, then you must follow DexLab Analytics. We are a leading Tableau training institute in Delhi. Check back for our previous blogs on Tableau’s Calculated Field functions and definitely go through the details of Tableau BI training courses, which are available on our website.


This article has been sourced from: https://www.interworks.com/blog/ccapitula/2015/05/14/tableau-essentials-calculated-fields-user-functions


Interested in a career in Data Analyst?

To learn more about Data Analyst with Advanced excel course – Enrol Now.
To learn more about Data Analyst with R Course – Enrol Now.
To learn more about Big Data Course – Enrol Now.

To learn more about Machine Learning Using Python and Spark – Enrol Now.
To learn more about Data Analyst with SAS Course – Enrol Now.
To learn more about Data Analyst with Apache Spark Course – Enrol Now.
To learn more about Data Analyst with Market Risk Analytics and Modelling Course – Enrol Now.

Why Portability is Gaining Momentum in the Field of Data

Why Portability is Gaining Momentum in the Field of Data

Ease and portability are of prime importance to businesses. Companies want to handle data in real-time; so there’s need for quick and smooth access to data. Accessibility is often the deciding factor that determines if a business will be ahead or behind in competition.

Data portability is a concept that is aimed at protecting users by making data available in a structured, machine-readable and interoperable format. It enables users to move their data from one controller to another. Organizations are required to follow common technical standards to assist transfer of data instead of storing data in ‘’walled gardens’’ that renders the data incompatible with other platforms.

Now, let’s look a little closer into why portability is so important.

Advantages:

Making data portable gives consumers the power to access data across multiple channels and platforms. It improves data transparency as individuals can look up and analyze relevant data from different companies. It will also help people to exercise their data rights and find out what information organizations are holding. Individuals will be able to make better queries.

From keeping a track of travel distance to monitoring energy consumption on the move, portable data is able to connect with various activities and is excellent for performing analytical examinations on. Portable data may be used by businesses to map consumers better and help them make better decisions, all the while collecting data very transparently. Thus, it improves data personalization.

For example, the portable data relating to a consumers grocery purchases in the past can be utilized by a grocery store to provide useful sales offers and recipes. Portable data can help doctors find quick information about a patient’s medical history- blood group, diet, regular activities and habits, etc., which will benefit the treatment. Hence, data portability can enhance our lifestyle in many ways.

Struggles:

Portable data presents a plethora of benefits for users in terms of data transparency and consumer satisfaction. However, it does have its own set of limitations too. The downside of greater transparency is security issues. It permits third parties to regularly access password protected sites and request login details from users. Scary as it may sound; people who use the same password for multiple sites are easy targets for hackers and identity thieves. They can easily access the entire digital activity of such users.

Although GDPR stipulates that data should be in a common format, that alone doesn’t secure standardization across all platforms. For example, one business may name a domain ‘’Location” while another business might call the same field ‘’Locale”.  In such cases, if the data needs to be aligned with other data sources, it has to be done manually.

According to GDPR rules, if an organization receives a request pertaining to data portability, then it has to respond within one month. While they might be willing to readily give out data to general consumers, they might hold off the same information if they perceive the request as competition.

2

Future:

Data portability runs the risk of placing unequal power in the hands of big companies who have the money power to automate data requests, set up an entire department to cater to portability requests and pay GDPR fines if needed.

Despite these issues, there are many positives. It can help track a patient’s medical statistics and provide valuable insights about the treatment; and encourage people to donate data for good causes, like research.

As businesses as well as consumers weigh the pros and cons of data portability, one thing is clear- it will be an important topic of discussion in the years to come.

Businesses consider data to be their most important asset. As the accumulation, access and analysis of data is gaining importance, the prospects for data professionals are also increasing. You must seize these lucrative career opportunities by enrolling for Big Data Hadoop certification courses in Gurgaon. We at Dexlab Analytics bring together years of industry experience, hands-on training and a comprehensive course structure to help you become industry-ready.

DexLab Analytics Presents #BigDataIngestion

Don’t miss the summer special course discounts on big data Hadoop training in Delhi. We are offering flat 10% discount to all interested students. Hurry!


Interested in a career in Data Analyst?

To learn more about Data Analyst with Advanced excel course – Enrol Now.
To learn more about Data Analyst with R Course – Enrol Now.
To learn more about Big Data Course – Enrol Now.

To learn more about Machine Learning Using Python and Spark – Enrol Now.
To learn more about Data Analyst with SAS Course – Enrol Now.
To learn more about Data Analyst with Apache Spark Course – Enrol Now.
To learn more about Data Analyst with Market Risk Analytics and Modelling Course – Enrol Now.

Tableau Basics: An Article on Aggregate Functions in Calculated Fields

Tableau Basics: An Article on Aggregate Functions in Calculated Fields

Want to be an expert in Tableau? Then you must start with the basics and learn them well. And to help you in your endeavors, we have created a blog series covering the fundamentals of Tableau. These articles are easy-to-follow and shall help you understand how and when to use the Calculated Field functions.

In this blog, we discuss Aggregate Functions. In Aggregate Functions, we group together multiple rows of values to form a single input value that is more meaningful, like a set or list. In order to access these functions select the option ‘Aggregate’ from the drop down list for functions in the ‘Create Calculated Filed’ window.

Now, let’s discuss the different types of Aggregate Functions one by one ad look into a few examples. A person having some experience in Excel will find these functions familiar.


ATTR Function
ATTR(expression)


The ATTR function, short form for attribute, gives back a value when all rows have a single value. In case the values in the rows are different, the value ‘’*” is returned. It ignores null values. Example:

AVG Function
AVG(expression)


The AVG function returns a value that is the average of all the values in a given expression. It is used only for numeric fields. Null values are not considered. Example:

COUNT Function
COUNT(expression)


COUNT function returns the number of items present in a particular group. Null values are ignored. Example:

COUNTD Function
COUNTD(expression)


COUNTD function returns distinct items in a group and counts them only once. Null values are ignored.

The function isn’t offered in certain types of workbooks, like the ones that were created prior to Tableau Desktop v8.2, workbooks where MS Excel or text files are used as sources of data, etc. Example:

MAX Function
MAX(expression)


A MAX function is used to obtain the maximum of two expressions for each record or the maximum of a single expression across all records. The two expressions must have the same type of argument. If either of the arguments is NULL, then NULL value is returned. Example:

MEDIAN Function
MEDIAN(expression)


The median is the middle value of a sequence and the MEDIAN function is used to obtain the median for one particular expression. It only works for fields that are numeric. In case null values are present, they are ignored. Example:

MIN Function
MIN(expression)


The functionality of this function is similar to the MAX function. It is used to return the minimum of a single expression across all records or the minimum between two expressions for each record. If either of the two values is NULL, then a NULL value is returned. Like before, both the expressions need to have the same type of argument. Example:

PERCENTILE Function
PERCENTILE(expression, number)


A number between O and 1 is given and PERCENTILE function returns the percentile expression corresponding to that number. If 0.50 is given, then it returns the median number. Example:

STDEV Function
STDEV(expression)


This is actually a statistical function and stands for standard deviation. STDEV function is used to obtain the statistical standard deviation for all values for a specific expression pertaining to the sample of a population.


STDEVP Function
STDEVP(expression)


The STDEVP function is similar to the STDEV function above, but it returns the statistical standard deviation for all the values in an expression that pertains to a biased population.


SUM Function
SUM(expression)


Simply put, this function adds up all the values in an expression. Example:

VAR Function
VAR(expression)


VAR is another statistical function that returns the statistical variance for all the values in an expression pertaining to a sample of the population.


VARP Function
VARP(expression)


Similar to the function above, VARP function returns the statistical variance for all the values of an expression that pertains to the entire population.

Calculated Fields:

Calculated fields enable users to create more robust visualizations in Tableau. If you have missed our earlier blogs on Calculated Field functions, then visit the blog section of DexLab Analytics-we provide one of the best Tableau certifications in Delhi.

In order to be a Tableau expert, you need to enroll for comprehensive and well-structured Tableau BI training courses.


This article has been sourced from: www.interworks.com/blog/ccapitula/2015/05/07/tableau-essentials-calculated-fields-aggregate-functions


Interested in a career in Data Analyst?

To learn more about Data Analyst with Advanced excel course – Enrol Now.
To learn more about Data Analyst with R Course – Enrol Now.
To learn more about Big Data Course – Enrol Now.

To learn more about Machine Learning Using Python and Spark – Enrol Now.
To learn more about Data Analyst with SAS Course – Enrol Now.
To learn more about Data Analyst with Apache Spark Course – Enrol Now.
To learn more about Data Analyst with Market Risk Analytics and Modelling Course – Enrol Now.
For a Seamless, Real-Time Integration and Access across Multiple Data Siloes, Big Data Fabric Is the Solution

For a Seamless, Real-Time Integration and Access across Multiple Data Siloes, Big Data Fabric Is the Solution

Grappling with diverse data?

No worries, data fabrics for big data is right here.

The very notion of a fabric joining computing resources and offering centralized access to a set of networks has been doing rounds since the conceptualization of grid computing as early as 1990s. However, a data fabric is a relatively new concept based on the same underlying principle, but it’s associated with data instead of a system.

As data have become increasingly diversified, the importance of data fabrics too spiked up. Now, integrating such vast pools of data is quite a problem, as data collected across various channels and operations is often withhold in discrete silos. The responsibility lies within the enterprise to bring together transactional data stores, data lakes, warehouses, unstructured data sources, social media storage, machine logs, application storage and cloud storage for management and control.  

The Change That Big Data Brings In

The escalating use of unstructured data resulted in significant issues with proper data management. While the accuracy and usability quotient remained more or less the same, the ability to control them has been reduced because of increasing velocity, variety, volume and access requirements of data. To counter the pressing challenge, companies have come with a number of solutions but the need for a centralized data access system prevails – on top of that big data adds concerns regarding data discovery and security that needs to be addressed only through a particular single access mechanism.

To taste success with big data, the enterprises need to seek access to data from a plethora of systems in real time in perfectly digestible formats – also connecting devices, including smartphones and tablets enhances storage related issues. Today, big data storage is abundantly available in Apache Spark, Hadoop and NoSQL databases that are developed with exclusive management demands.

2

The Popularity of Data Fabrics

Huge data and analytics vendors are the biggest providers of big data fabric solutions. They help offer access to all kinds of data and conjoin them into a single consolidated system. This consolidated system – big data fabric – should tackle diverse data stores, nab security issues, offer consistent management through unified APIs and software access, provide auditability, flexibility and be upgradeable and process smooth data ingestion, curation and integration.

With the rise of machine learning and artificial intelligence, the requirements of data stores increase as they form the fundamentals of model training and operations. Therefore, enterprises are always seeking a single platform and a single point for data access, they tend to reduce the intricacies of the system and ensure easy storage of data. Not only that, data scientists no longer need to focus on the complexities of data access, rather they can give their entire attention to problem-solving and decision-making.

To better understand how data fabrics provide a single platform and a single point for data access across myriad siloed systems, you need a top of the line big data certification today. Visit DexLab Analytics for recognized and well-curated big data hadoop courses in Gurgaon.

DexLab Analytics Presents #BigDataIngestion

DexLab Analytics Presents #BigDataIngestion

 
Referenes: https://tdwi.org/articles/2018/06/20/ta-all-data-fabrics-for-big-data.aspx
 

Interested in a career in Data Analyst?

To learn more about Data Analyst with Advanced excel course – Enrol Now.
To learn more about Data Analyst with R Course – Enrol Now.
To learn more about Big Data Course – Enrol Now.

To learn more about Machine Learning Using Python and Spark – Enrol Now.
To learn more about Data Analyst with SAS Course – Enrol Now.
To learn more about Data Analyst with Apache Spark Course – Enrol Now.
To learn more about Data Analyst with Market Risk Analytics and Modelling Course – Enrol Now.
An ABC of Apache Spark Streaming

Estimator Procedure under Simple Random Sampling: EXPLAINED

Apache Spark has become one the most popular technologies. It is accompanied with a powerful streaming library, which has quite a few advantages over other technologies. The integration of Spark streaming APIs with Spark core APIs provides a dual purpose real-time and batch analytical platform. Spark Streaming can also be combined with SparkSQL, SparkML and GraphX when complex cases need to be handled. Famous organizations that prevalently use Spark Streaming are Netflix, Uber and Pinterest. Spark Streaming’s fame in the world of data analytics can be attributed to its fault tolerance, ability to process live streams, scalability and high throughput.

2

Need for Streaming Analytics:

Companies generate enormous amounts of data on a daily basis. Transactions happening over the internet, social network platforms, IoT devices, etc. generate large volumes of data that need to be leveraged in real-time. And this process shall gain more important in future. Entrepreneurs consider real-time data analysis as a great opportunity to scale up their businesses.

Spark streaming intakes live data streams, Spark engine processes and divides it and the output is in the form of batches.

Architecture of Spark Streaming:

Spark streaming breaks the data stream into micro batches (known as discretize stream processing). First of all, the receivers accept data in parallel and hold it in worker nodes as buffer. Then the engine runs brief tasks and sends the result to other systems.

Spark tasks are allocated to workers dynamically, that depends on the resources available and the locality of data. The advantages of Spark Streaming are many, including better load balancing and speedy fault recovery. Resilient distributed dataset (RDD) is the basic concept behind fault tolerant datasets.

Useful features of Spark streaming:

Easy to use: Spark streaming supports Java, Scala and Python and uses the language integrated API of Apache Spark for stream processing. Stream jobs can be written in a similar manner in which batch jobs are written.

Spark Integration: Since Spark streaming runs on Spark, it can be utilized for addressing unplanned queries and reusing similar codes. Robust interactive applications can also be designed.

Fault tolerance: Work that has been lost can be recovered without additional coding from the developer.

Benefits of discretized stream processing:

Load balancing: In Spark streaming, the job load is balanced across workers. While, some workers handle more time-consuming tasks, others process tasks that take less time. This is an improvement from traditional approaches where one task is processed at a time. This is because if the task is time-taking then it behaves like a bottle neck and delays the whole pipeline.

Fast recovery: In many cases of node failures, the failed operators need to be restarted on different nodes. Recomputing lost information involves rerunning a portion of the data stream. So, the pipeline gets halted until the new node catches up after the rerun. But in Spark, things work differently. Failed tasks can be restarted in parallel and the recomputations are distributed across different nodes evenly. Hence, recovery is much faster.

Spark streaming use cases:

Uber: Uber collects gigantic amounts of unstructured data from mobile users on a daily basis. This is converted to structured data and sent for real time telemetry analysis. This data is analyzed in an ETL pipeline build using Spark streaming, Kafka and HDFS.

Pinterest: To understand how Pinterest users are engaging with pins globally, it uses an ETL data pipeline to provide information to Spark through Spark streaming. Hence, Pinterest aces the game of showing related pins to people and providing relevant recommendations.

Netflix: Netflix relies on Spark streaming and Kafka to provide real-time movie recommendations to users.

Apache foundation has been inaugurating new techs, such as Spark and Hadoop. For performing real-time analytics, Spark streaming is undoubtedly one of the best options.

As businesses are swiftly embracing Apache Spark with all its perks, you as a professional might be wondering how to gain proficiency in this promising tech. DexLab Analytics, one of the leading Apache Spark training institutes in Gurgaon, offers expert guidance that is sure to make you industry-ready. To know more about Apache Spark certification courses, visit Dexlab’s website.

This article has been sources from: https://intellipaat.com/blog/a-guide-to-apache-spark-streaming-tutorial


Interested in a career in Data Analyst?

To learn more about Data Analyst with Advanced excel course – Enrol Now.
To learn more about Data Analyst with R Course – Enrol Now.
To learn more about Big Data Course – Enrol Now.

To learn more about Machine Learning Using Python and Spark – Enrol Now.
To learn more about Data Analyst with SAS Course – Enrol Now.
To learn more about Data Analyst with Apache Spark Course – Enrol Now.
To learn more about Data Analyst with Market Risk Analytics and Modelling Course – Enrol Now.
Estimator Procedure under Simple Random Sampling: EXPLAINED

Estimator Procedure under Simple Random Sampling: EXPLAINED

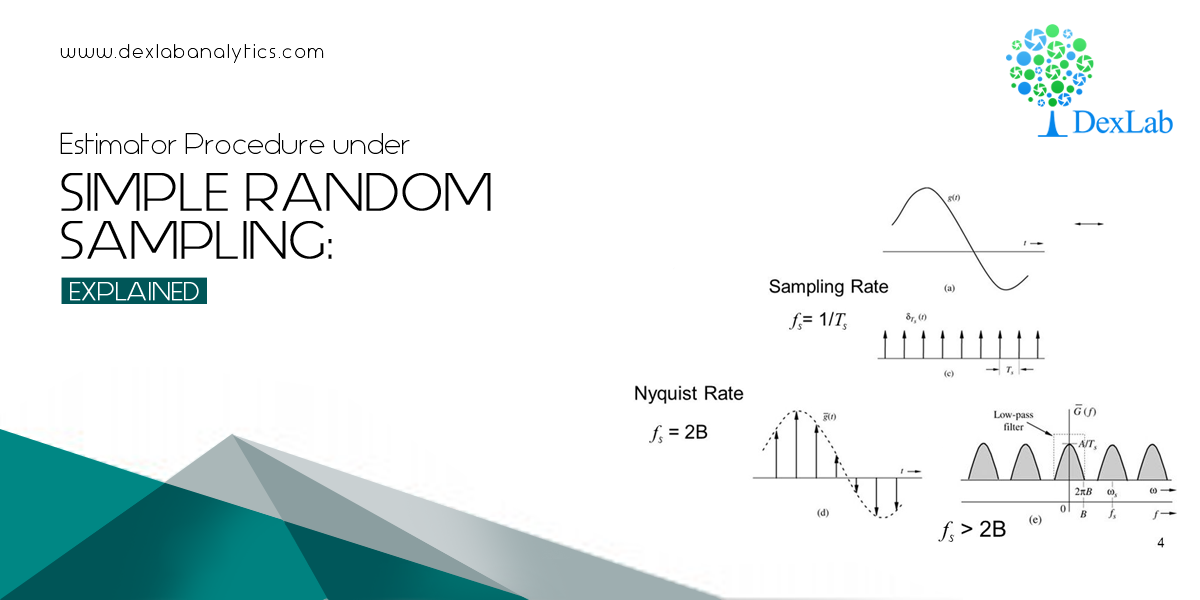
In continuation with the previous introductory blog on sampling: An ABC Guide to Sampling Theory, we will take a closer look into the concept of the estimator procedure under Simple Random Sampling with the help of mathematical examples. It will help us understand the underlying phenomenon, the manner to be precise in which the estimator function of sampling works.

Simple random sampling (SRS) is a method of selecting a sample comprising ‘n’ number of sampling units out of the population of ‘N’ number of sampling units such that every sampling unit has an equal chance of being chosen.

The Estimator Procedure under Simple Random Sampling

The process of selection of a sample under SRS (Simple Random Sampling) is random. This means, each number of the population has an equal probability of getting selected, which makes each of the observation identical and independently distributed.

The statistic chosen by the investigation of estimation of random samples need to satisfy a set of certain properties given below:

  1. Unbiasedness
  2. Consistency
  3. Sufficiency
  4. Efficiency

As a matter of fact, investigation is always about coming up with an idea regarding the population parameters based on the sample observations. The best part would be to formulate an unbiased, consistent estimator, which is also efficient. Normally, a sample mean for a set of sample observations is considered to be a very desirable estimator to form ideas about population parameters.

In detail, let’s examine the relevance of each of the properties of an estimator:

Unbiasedness of an estimator

Take a look at the below examples to understand the very idea of unbiasedness.

Example 1:

Answer:-

According to the problem, we have

Adding (1) & (2), we get,

So, from (3), we get:-

 is called an unbiased estimators for .

Now, subtracting (2) & (1), we get –

Example 2:

Assume that an investigator draws a sample from this population using SRSWR. Then show that the sample mean is an unbiased estimator for the population mean.

Now, by specification we have:-

We are redefined to show that:-

L.H.S  :

DexLab Analytics Presents #BigDataIngestion

DexLab Analytics Presents #BigDataIngestion


Data sampling is the key to business analytics and data science. On that note, DexLab Analytics offers state of the art Data Science Certification for all data enthusiasts. Recently, they have organized a new admission drive #BigDataIngestion offering exclusive 10% off on in-demand courses, including big data, machine learning and data science courses.


Interested in a career in Data Analyst?

To learn more about Data Analyst with Advanced excel course – Enrol Now.
To learn more about Data Analyst with R Course – Enrol Now.
To learn more about Big Data Course – Enrol Now.

To learn more about Machine Learning Using Python and Spark – Enrol Now.
To learn more about Data Analyst with SAS Course – Enrol Now.
To learn more about Data Analyst with Apache Spark Course – Enrol Now.
To learn more about Data Analyst with Market Risk Analytics and Modelling Course – Enrol Now.
Hadoop or Spark: Which Big Data Framework to Choose?

Hadoop or Spark:  Which Big Data Framework to Choose?

Feeling confused?

Of late, Spark has overtaken Hadoop for being the most active open source big data project. Though they have their differences, they both have many common uses.

To begin, they both are incredible big data frameworks. For some years, Hadoop has been leading the open source big data framework clusters but recently highly advanced Spark tends to have captured the market. The latter has become increasingly popular and for all the right reasons. But that is not to say, Hadoop is losing its significance entirely.

They don’t perform exactly the similar tasks. Neither are they mutually exclusive. Though it’s been heard that Spark can work 100X faster than Hadoop in some scenarios, it doesn’t come with its own distributed storage system, which is quite fundamental to big data projects. Distributed storage offers elaborate multi-petabyte dataset storage solution across almost infinite number of computer hard drives. As compared to expensive machinery customization which holds everything in one device, distributed system is cheap as well as scalable, which means as many devices can be added if the network of data set ever grows.

Moreover, Spark doesn’t have its own file system; it cannot organize files in a distributed way without help from third party. This is the reason why several companies think of installing Spark after Hadoop, so that superior analytical applications of Spark can employ data stored using HDFS.

So, what makes Spark win over Hadoop? It’s the SPEED. Spark is a champion of handling a large chunk of its operations ‘in memory’- this reduces a lot of time and effort, indeed. Thanks to MapReduce!

2

MapReduce writes of the data right to its physical storage medium after each activity. The main purpose of this was to ensure a fully recovery if something goes wrong – nevertheless, Spark organizes data in Resilient Distributed Datasets, where data can be easily recovered following failure or any kind of mishap.

The main driving factor behind growth of Spark lies in its adept functionality for tackling advanced data processing tasks, including machine learning and real-time stream processing. Real-time processing stands for feeding data into analytical applications the moment it’s seized, and insights are right away directed back to the users through a dashboard to inspire action. This kind of processing is nowadays very much used in big data, thus making Spark enjoy an upper hand against its Hadoop counterpart.

The technology of machine learning is right at the kernel of digital revolution – artificial intelligence and creating far-fetched algorithms is an area of analytics Spark excels at. Its speed and the sound capability to tackle streaming data are the reasons behind. Spark has its own machine learning libraries, known as MLib, while Hadoop needs to collaborate with third-party machine learning library, for example Apache Mahout.

As closing thoughts, though it appears that the two big data frameworks are stiff competitors of each other, yet this is really not the case in the reality. The corporate uses offers both the application services, letting the buyer decide which one they prefer to pick, subject to their functionality and need.

DexLab Analytics Presents #BigDataIngestion

DexLab Analytics Presents #BigDataIngestion


The good news is that DexLab offers both Hadoop and Apache Spark Certification Training. What’s more, a recent admission drive is ongoing #BigDataIngestion. Enroll now and enjoy 10% discount on big data certification training courses.


The blog originally was published on – www.forbes.com/sites/bernardmarr/2015/06/22/spark-or-hadoop-which-is-the-best-big-data-framework/2/#714061d161d6


Interested in a career in Data Analyst?

To learn more about Data Analyst with Advanced excel course – Enrol Now.
To learn more about Data Analyst with R Course – Enrol Now.
To learn more about Big Data Course – Enrol Now.

To learn more about Machine Learning Using Python and Spark – Enrol Now.
To learn more about Data Analyst with SAS Course – Enrol Now.
To learn more about Data Analyst with Apache Spark Course – Enrol Now.
To learn more about Data Analyst with Market Risk Analytics and Modelling Course – Enrol Now.
Call us to know more