
Dexlab, Author at DexLab Analytics | Big Data Hadoop SAS R Analytics Predictive Modeling & Excel VBA - Page 25 of 80

The Power of Data: How the Industry Has Changed After Adding Data

The volume of data is expanding at an enormous rate, each day. No more are 1s and 0s are petty numerical digits, they are now a whole new phenomenon – known as Big Data. A fair assessment of the term helped us understand the massive volume of corporate data collected from a broad spectrum of sources is what big data is all about.

A recent report suggested that organizations are expected to enhance their annual revenues by an average of $5.2 million – thanks to big data.

More about Data, Rather Big Data

Back in the day, most of the company information used to be stored in written formats, like on paper. For example, if 80% of confidential information was kept on paper, 20% was stored electronically. Now, out of that 20%, 80% was kept in databases.

With time, things have changed. Across the business domain, more than 80% of companies store their data in electronic formats nowadays, and at least 80% of that is found outside databases, because most organizations prefer storing data in ad hoc basis in files at random places.

2

Now, the question is what kind of data is of crucial importance? Data, that impacts the most?

With that in mind, we’ve three kinds of data:

  • Customer Data
  • IT Data
  • Internal Financial Data

The Value of Data

For companies, data means dollars – the way data costs companies’ their time and resources, it also leads to increased revenue generation. However, the key factor to be noted here is – the data have to be RELEVANT. Despite potential higher revenues through advanced data skills and technology implementation, an average enterprise is only able to employ 51% of total accumulated and generated data, and less than 48% of decisions are based on that.

To say the least, unlike before, today’s organizations gather data from a wide array of sources – CCTV footage, video-audio files, social networking data, health metrics, blogs, web traffic logs and sensor feeds – previously companies were not as efficient and tech-savvy as they are now. In fact, five years ago, some of the sources from which data is accumulated did not even exist nor were they available on corporate radar.

With the rise of ingenious and connected technologies, companies are turning digital. It hardly matters if you are an automobile manufacturer, fashion collaborator or into digital marketing – being connected digitally and owning meaningful data is all to cash on. You can structure intricate database just with consumers’ details, both personal and professional, such as age, gender, interests, buying patterns, behavioral statistics and habits. Remember, accumulating and analyzing data is not only productive for your company but also becomes a saleable service in its own way.

Make Data the Bedrock of Your Business

Data has to be the life and blood of business plans and decisions you want to make. Ensure your employees learn about the value of data collection, make sure you align your IT resources properly and keep pace with the latest data tools and technologies as they tend to keep on changing, constantly.

Embrace the change – while physical assets are losing importance, data appears to be the most valuable asset a company can ever have.

For big data hadoop certification in gurgaon, look no further than DexLab Analytics. With the right skills in tow and adequate years of experience, this analytics training institute is the toast of the town. For more information, visit our official page. 


The blog has been sourced from:

https://www.digitaldoughnut.com/articles/2016/april/data-may-be-the-most-valuable-asset-your-company-h

https://www.techrepublic.com/blog/cio-insights/big-data-cheat-sheet/

https://www.techrepublic.com/article/the-3-most-important-types-of-data-for-your-business


Interested in a career in Data Analyst?

To learn more about Data Analyst with Advanced excel course – Enrol Now.
To learn more about Data Analyst with R Course – Enrol Now.
To learn more about Big Data Course – Enrol Now.

To learn more about Machine Learning Using Python and Spark – Enrol Now.
To learn more about Data Analyst with SAS Course – Enrol Now.
To learn more about Data Analyst with Apache Spark Course – Enrol Now.
To learn more about Data Analyst with Market Risk Analytics and Modelling Course – Enrol Now.

Analytics of Things is Transforming the Way Businesses Run

Analytics of Things is Transforming the Way Businesses Run

As Internet of Things (IoT) invades every aspect of our lives, big data analytics is likely to be utilized for many more things other than solving business problems. This growing popularity of big data analytics, which is altering the way businesses run, has given birth to a new term- ‘ Analytics of Things’.

Much before big data was identified as the most valuable asset for businesses, enterprises had expressed need for a system that could handle an ‘information explosion’. In 2006, an open source distributed storage and processing system was developed. This system called Hadoop spread across commodity hardware and encouraged the nurturing of many more open source projects that would target different aspects of data and analytics.

Growth of Hadoop:

The primary objective with which Hadoop was developed was storing large volumes of data in a cost effective manner. Enterprises were clueless how to handle their ever increasing volumes of data. So, the first requirement was to dump all that data in a data lake and figure out the use cases gradually. Initially, there used to be a standard set of open source tools for managing data and the data architecture lacked variety.

Prior to adopting big data, companies managed their reporting systems through data warehouses and different types of data management tools. The telecom and banking industry were among the first to step into big data. Over time, some of them completely shifted their reporting work to Hadoop.

2

Evolution of big data architecture:

Big data tools have witnessed drastic evolution. This encouraged enterprises to employ a new range of use cases on big data using the power of real-time processing hubs. This includes fraud detection, supply chain optimization and digital marketing automation among other things. Since Hadoop’s birth in 2006, big data has developed a lot. Some of these developments include intelligent automation and real-time analytics.

To keep up with the demands for better big data architecture, real-time analytics was incorporated in Hadoop and its speed was also improved. Different cloud vendors developed Platform as a Service (PaaS) component and this development was a strong driving force behind big data architectures becoming more diverse.

As companies further explored ways to extract more meaning from their data, it led to the emergence of two major trends: Analytics as a service (AaaS) and data monetization.

AaaS platforms provided a lot of domain experience and hence gave generic PaaS platforms a lot more context. This development made big data architecture more compact.

Another important development came with data monetization. Some sectors, like healthcare and governance, depend heavily on data collected through a range of remote IoT devices. To make these processes speedier and reduce network load, localized processing was needed and this led to the emergence of ‘edge analytics’. Now, there is good sync between edge and centralized platforms, which in turn enhances the processes of data exchange and analysis.

The above mentioned developments show how much big data has evolved and that currently a high level of fine-tuning is possible in its architecture.

Often enterprises struggle with successful implementation of big data. The first step is to define your big data strategy. Instead of going for full blown implementation, undertake shorter implementation cycles.

It is highly likely that our future will become completely driven by big data and ground-breaking innovations like automated analysts and intelligent chatbots. Don’t be left behind. Enroll for big data Hadoop certification courses and take full advantage of the power big data holds in today’s world of work. The big data Hadoop training in Gurgaon ensures that every student becomes proficient enough to face real challenges in the industry. Enroll now and get flat 10% discount on all big data certification courses.


Reference: www.livemint.com/AI/bRwVnGBm6hH78SoUIccomL/Big-Data-Analytics-of-Things-upend-the-way-biz-gets-done.html


Interested in a career in Data Analyst?

To learn more about Data Analyst with Advanced excel course – Enrol Now.
To learn more about Data Analyst with R Course – Enrol Now.
To learn more about Big Data Course – Enrol Now.

To learn more about Machine Learning Using Python and Spark – Enrol Now.
To learn more about Data Analyst with SAS Course – Enrol Now.
To learn more about Data Analyst with Apache Spark Course – Enrol Now.
To learn more about Data Analyst with Market Risk Analytics and Modelling Course – Enrol Now.
Why R is the Most Suitable Programming Language for Encompassing Data Science Projects?

Why R is the Most Suitable Programming Language for Encompassing Data Science Projects?

Since the early 1990’s, when R was first conceptualized, it has been leading the show in the field of data science. In the past few years, however, the popularity of R has increased exponentially – thanks to the advancement in data analytics environment. From data scientists to statisticians and researchers, R has become a hot-favorite for all. And, why not? It’s a GNU package and a free software package for statistical computing.

In this era of evolution, finding the best tool to stay ahead of the curve is the need of the hour. For that and more, we have selected R and given below are the points proving why R is the best programming tool in the competitive environment of data science.

2

R is a substitute for data science for non-technical data enthusiasts

Well, if you are aware of leading data science trends and programming languages, you will find two high-end data science tools – R and Python – they tend to be the topic of conversation for all data-related matter. Python is a top of the line programming language for software professionals who have a knack in mathematics, statistics and machine learning, but lacks big time in offering library support on subjects like Econometrics and a bunch of communication tools, including reporting.

Most of the consultants working in the field of data science belongs from business community, and have no particular interest in technical know-how about developing software and acing programming languages. Learning python would not be as much of help as it would be mastering R programming – R is a programming language that supports libraries for stats, machine learning and data science. Thus, R is the best fit for data science enthusiasts not belonging from technical background. Also, R offers support packages or libraries for Econometrics, Finance, etc. – all of this is widely used for data analytics.

For R language training in Delhi, drop by DexLab Analytics.

After Tidyverse, mastering R is easy

Previously, learning R was no mean feat. It was considered one of the toughest languages to learn and largely inconsistent; the reasons being structuring and formality. But the things started to change when Tidyverse was introduced – it’s a robust set of packages and tools that offers steady structural programming interface.

In fact, after the launch of ‘dplyr’ and ‘ggplot2’, curve complexities got reduced even more. Just like any other languages, R went on getting better with its programming interface and achieving more structural and consistent – thanks to Tidyverse – it turned out to be efficient as it includes support packages for visualization, modeling, manipulation, iteration and communication – all of these turned R a super easy language to ace on.

R is mostly used for business purposes

The biggest advantage of R as compared to other programming languages is its capability to create industry-ready reports and infographics, and ML-powered web applications. For business-related matter, no other tool is as efficient as R.

But have you wondered what makes R so popular among the business community? It’s the two special R-enabled frameworks – RMARKDOWN and Shiny.

RMARKDOWN helps in developing reconstructable reports, which are regarded as the stepping stone for building blogs, websites, presentations, books and journals. On the other hand, Shiny is a powerful framework for creating interactive web applications for R. It is handy and widely popular.

DexLab Analytics offers leading R programming courses in Gurgaon for all the data enthusiasts. Check out the course itinerary and decide for yourself.


The blog has been sourced from – 

www.technotification.com/2018/06/r-programming-data-science.html


Interested in a career in Data Analyst?

To learn more about Data Analyst with Advanced excel course – Enrol Now.
To learn more about Data Analyst with R Course – Enrol Now.
To learn more about Big Data Course – Enrol Now.

To learn more about Machine Learning Using Python and Spark – Enrol Now.
To learn more about Data Analyst with SAS Course – Enrol Now.
To learn more about Data Analyst with Apache Spark Course – Enrol Now.
To learn more about Data Analyst with Market Risk Analytics and Modelling Course – Enrol Now.
How Aspiring Data Scientists Should Choose a Suitable Programming Language for Data Science

How Aspiring Data Scientists Should Choose a Suitable Programming Language for Data Science

Data science is a fascinating and one of the fastest growing fields in the world to work in. This is why it’s becoming increasingly popular for data scientists to consider the potentials of programming languages-they form an integral part of data science.

Possessing incredible skills of programming instantly pumps up the chances of bagging a high-profile data science job, whereas the novices, who have never studied programming in their entire life have to struggle hard.

However, this is not all – only a sack of all-round programming skills won’t help you grab the sexiest job of 21st century, there are several things to consider before you set off on becoming a successful data scientist. And they are as follows:

Generality

For a true blue data scientist, it’s not enough to possess encompassing programming skills but also the aptitude for crunching numbers. Remember, a data scientist’s day is largely spent on sourcing and processing raw data for the purpose of data cleaning – no amount of smart set of programming languages or machine learning models would be of any help.

2

Specificity

In advanced data science, learning knows no bounds – each time you get to reinvent something new. Learn to ace a wide array of packages and modules available in a chosen language. However, the extent of the use and application is subject to the domain-particular packages you are working on.

Performance

In few cases, optimizing the performance of the codes is essential, especially when tackling huge volumes of crucial data. Compiled languages are normally faster as compared to interpreted ones; in the same way, statically typed languages are more fail-proof than dynamically typed. As a result, an apparent trade-off exists against productivity.

With all these in mind, it’s time to delve into the most popular languages used in the field of data science – let’s start with R – it’s the most powerful open source language used for a gamut of statistical and data visualization applications, including neural networks, advanced plotting, non-linear regression, phylogenetics and lot more.

Next, we can’t help but brag about an excellent all-rounder – Python – a top notch programming language choice for all types of data scientists, seasoned and freshers. A large chunk of the data science process revolves around the cutting edge ETL process – this makes Python a universal language to excel at. Google’s Tensorflow is an added bonus point.

Lastly, SQL tops rank as a leading data processing language instead of being just an advanced analytical tool. Owing to its longevity and efficiency, SQL is deemed to be one of the most powerful weapons that modern data scientist should know of.

Parting Thoughts

In the end of the discussion, we now have a set of languages to consider for excelling data science – what you need to do is comprehend your usage requirements and compare generality, specificity and performance factors. This will help you surge towards a successful career minus the complexities associated.

DexLab Analytics offers top of the line Data Science Courses in Delhi for data enthusiasts. If you are interested in a data analyst course in Noida, drop by this esteemed institute and navigate through our in-demand courses.


The blog has been sourced from – 

https://medium.freecodecamp.org/which-languages-should-you-learn-for-data-science-e806ba55a81f

https://towardsdatascience.com/what-programming-language-should-aspiring-data-scientists-learn-875017ad27e0

http://bigdata-madesimple.com/how-i-chose-the-right-programming-language-for-data-science


Interested in a career in Data Analyst?

To learn more about Data Analyst with Advanced excel course – Enrol Now.
To learn more about Data Analyst with R Course – Enrol Now.
To learn more about Big Data Course – Enrol Now.

To learn more about Machine Learning Using Python and Spark – Enrol Now.
To learn more about Data Analyst with SAS Course – Enrol Now.
To learn more about Data Analyst with Apache Spark Course – Enrol Now.
To learn more about Data Analyst with Market Risk Analytics and Modelling Course – Enrol Now.
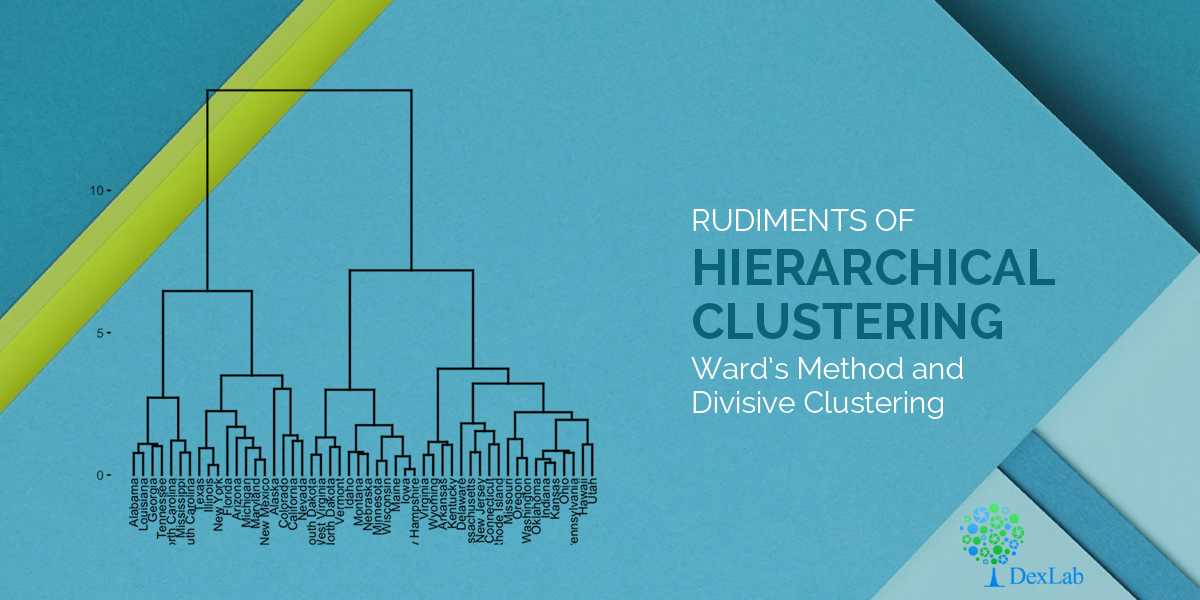
Rudiments of Hierarchical Clustering: Ward’s Method and Divisive Clustering

Rudiments of Hierarchical Clustering: Ward’s Method and Divisive Clustering

Clustering, a process used for organizing objects into groups called clusters, has wide ranging applications in day to day life, including fields like marketing, city-planning and scientific research.

Hierarchical clustering, one the most common methods of clustering, builds a hierarchy of clusters either by a ‘’bottom up’’ approach (Agglomerative clustering) or by a ‘’top down’’ approach (Divisive clustering). In the previous blogs, we have discussed the various distance measures and how to perform Agglomerative clustering using linkage types. Today, we will explain the Ward’s method and then move on to Divisive clustering.

Ward’s method:

This is a special type of agglomerative hierarchical clustering technique that was introduced by Ward in 1963. Unlike linkage method, Ward’s method doesn’t define distance between clusters and is used to generate clusters that have minimum within-cluster variance. Instead of using distance metrics it approaches clustering as an analysis of variance problem. The method is based on the error sum of squares (ESS) defined for jth cluster as the sum of the squared Euclidean distances from points to the cluster mean.

Where Xij is the ith observation in the jth cluster. The error sum of squares for all clusters is the sum of the ESSj values from all clusters, that is,

Where k is the number of clusters.

The algorithm starts with each observation forming its own one-element cluster for a total of n clusters, where n is the number of observations. The mean of each of these on-element clusters is equal to that one observation. In the first stage of the algorithm, two elements are merged into one cluster in a way that ESS (error sum of squares) increases by the smallest amount possible. One way of achieving this is merging the two nearest observations in the dataset.

Up to this point, the Ward algorithm gives the same result as any of the three linkage methods discussed in the previous blog. However, as each stage progresses we see that the merging results in the smallest increase in ESS.

This minimizes the distance between the observations and the centers of the clusters. The process is carried on until all the observations are in a single cluster.

2

Divisive clustering:

Divisive clustering is a ‘’top down’’ approach in hierarchical clustering where all observations start in one cluster and splits are performed recursively as one moves down the hierarchy. Let’s consider an example to understand the procedure.

Consider the distance matrix given below. First of all, the Minimum Spanning Tree (MST) needs to be calculated for this matrix.

The MST Graph obtained is shown below.

The subsequent steps for performing divisive clustering are given below:

Cut edges from MST graph from largest to smallest repeatedly.

Step 1: All the items are in one cluster- {A, B, C, D, E}

Step 2: Largest edge is between D and E, so we cut it in 2 clusters- {E}, {A., B, C, D}

Step 3: Next, we remove the edge between B and C, which results in- {E}, {A, B} {C, D}

Step 4: Finally, we remove the edges between A and B (and between C and D), which results in- {E}, {A}, {B}, {C} and {D}

Hierarchical clustering is easy to implement and outputs a hierarchy, which is structured and informative. One can easily figure out the number of clusters by looking at the dendogram.

However, there are some disadvantages of hierarchical clustering. For example, it is not possible to undo the previous step or move around the observations once they have been assigned to a cluster. It is a time-consuming process, hence not suitable for large datasets. Moreover, this method of clustering is very sensitive to outlietrs and the ordering of data effects the final results.

In the following blog, we shall explain how to implement hierarchical clustering in R programming with examples. So, stay tuned and follow DexLab Analytics – a premium Big Data Hadoop training institute in Gurgaon. To aid your big data dreams, we are offering flat 10% discount on our big data Hadoop courses. Enroll now!


Check back for our previous blogs on clustering:

Hierarchical Clustering: Foundational Concepts and Example of Agglomerative Clustering

A Comprehensive Guide on Clustering and Its Different Methods
 

Interested in a career in Data Analyst?

To learn more about Data Analyst with Advanced excel course – Enrol Now.
To learn more about Data Analyst with R Course – Enrol Now.
To learn more about Big Data Course – Enrol Now.

To learn more about Machine Learning Using Python and Spark – Enrol Now.
To learn more about Data Analyst with SAS Course – Enrol Now.
To learn more about Data Analyst with Apache Spark Course – Enrol Now.
To learn more about Data Analyst with Market Risk Analytics and Modelling Course – Enrol Now.

Data Aspirants, Consider These 4 Career Options & Jazz-up Number Games!

Data Aspirants, Consider These  4 Career Options & Jazz-up Number Games!

Is crunching numbers your favorite hobby?

Are you interested in deciphering how many people use smartphones, regularly?

Do you feel fascinated by the way businesses use data to frame decisions?

If yes, then you are at the right place – a career, where you could leverage this inquisitiveness and knack for numbers is just carved for you. Not necessarily it has to be data science career option, but we’ve charted down top 5 career choices for the data curious you!

Data Scientist

Tagged as the sexiest job of 21st century, data scientist jobs are irresistible. First of all, the field of data science is expanding steadfastly – IBM prediction says the demand for data scientists will increase by 28% by the end of 2020. This brings good news for job seekers, who are on toes to enter the fascinating world of data science, where the salaries are pumping up – already they have touched six figures.

The main objective of data scientists is to collect meaningful data to help businesses formulate strategic decisions. Cleaning up and structuring the data is of primary importance – followed by cutting edge tool implementation, such as algorithms, statistical models and deep learning structures – all of them aids in extracting insights out of relevant data.

Statistician

Other than data geeks, very few love the very idea of becoming a statistician. But for guys who love churning data, the role of statistician is the most fascinating in the world. They help solve the toughest problem with data, while finding and providing answers to crucial questions.

Statisticians’ aptitude for numbers knows no bounds – and the range of projects on which they work is diverse. From ascertaining unemployment rates to nabbing the discerning the effectiveness of prescription drugs to calculating the number of endangered animals living in a given area – from designing the strategies for data collection to nabbing the latest trends, statisticians need to juggle between a lot of tasks, and solve crucial problems.

Computer Scientist

The computers are lifeline of today’s businesses – so jobs related to computing power is selling like hot cakes. The field of computer science is encompassing – nerds in love with data can discover a treasure trove of career options under this umbrella term. If you are a true blue crime buff, choose computer forensics as your leading career option. Or else, are you a major computer game aficionado? Then aspire to become a game developer or architect.

 Today, software developers and architects are witnessing surging demand, and most of the jobs in this technology domain help draw salaries over $100000 annually. So, what you waiting for?!

2

Database Administrator

Data is next to oil; of late, it’s been treated as a valuable resource. Thus, we should look for ways to keep it safe and well-protected. Database administrators are ideal for this defensive job. They not only toil to set up fortified databases but also are responsible for maintenance, model up-keeping and implementing security measures. Undeniably, it’s one of the most challenging jobs in the world of data but at the same time, it’s also the most rewarding one – at present, it ranks as the world’s #7 best technology job, according to a notable US tabloid.

Done reading? Now, data-lovers, when are you taking the next step to turn your avocation into your vocation? Pretty soon, right!

Quick Note: DexLab Analytics is offering state of the art Data Science Courses at affordable prices. For more details on Data Science Certification, visit the official page today.


The blog has been sourced from – dataconomy.com/2018/06/five-careers-to-consider-for-data-enthusiasts


Interested in a career in Data Analyst?

To learn more about Data Analyst with Advanced excel course – Enrol Now.
To learn more about Data Analyst with R Course – Enrol Now.
To learn more about Big Data Course – Enrol Now.

To learn more about Machine Learning Using Python and Spark – Enrol Now.
To learn more about Data Analyst with SAS Course – Enrol Now.
To learn more about Data Analyst with Apache Spark Course – Enrol Now.
To learn more about Data Analyst with Market Risk Analytics and Modelling Course – Enrol Now.

How Data Science Is Getting Better, Day by Day?

HOW DATA SCIENCE IS GETTING BETTER, DAY BY DAY?

In the latest Star Wars movie, the character of Rose Tico – a humble maintenance techie with a talent for tinkering is relatable; her role expands and responsibilities increase as the movie gets going, just like our data scientists. A chance encounter with Finn puts her into the frontlines of action, and by the end of the movie, she’s flying ski-speeders in the new galactic civil war, one of the most critical battles in the movie – with time, her role becomes more complex and demanding, but she never quivers and embraces the challenges to get the job done.

A lot many data scientists draw similarities with Rose’s character. In the last 5 years, the job role and responsibility of data analysts has undergone an unrecognizable change – as data proliferation is increasing in capacity and complexity, the responsibility is found shifting base from dedicated consultants to cross-functional, highly-skilled data teams, proficient enough in integrating skills together. Today’s data consultants need to complete tasks collaboratively to formulate trailblazing analysis that let businesses predict future success and growth pattern, effectively.

Get excellent data science certification from DexLab Analytics.

Quite conventionally, the intense role of prediction falls on the sophisticated crop of data scientists, while business analysts are more oriented towards measuring churn. On the other hand, intricate tasks, like model construction or natural language processing are performed by an elite team of data professionals, armed with strong engineering expertise.

Said differently, the emergence of data manipulation languages, such as R and Python is surging – owing to their extensive usage and adaptability, businesses are biased towards implementing these languages for advanced analysis. Drawing inspiration from Rose’s character, each data scientist should adapt to newer technology and expectations, and enhance expertise and skills that’s needed for the new role.

However, acing the cutting edge programming languages and tools isn’t enough for the challenge – today, data teams need to visualize their results, like never before. The insights churned out of advanced machine learning are curated for consumption by business pioneers and operation teams. Thus, the results have to be crisp, clear and creatively presented. As a result, predictive tools are being combined with effective capability of Python and R with which analysts and stakeholders are quite familiar.

The whole big data industry is changing, and the demand for skilled big data analysts is sky-rocketing. In this tide of change, if you are not relying on advanced data analysis tools and predictive analytics, you are going to lag behind. Companies that analyze data, boost decision-making, and observe social media trends – changing with time – will have immense advantages over companies that don’t pay attention to these crucial parameters.

2

No second thoughts, it’s an interesting time for data aspirants to make significant impacts in the whole data community and trigger fabulous business results. For professional training or to acquire new skills – drop by DexLab Analytics – their data Science Courses in Noida are outstanding.

The blog has been sourced from  dataconomy.com/2018/02/whole-new-world-data-teams


Interested in a career in Data Analyst?

To learn more about Data Analyst with Advanced excel course – Enrol Now.
To learn more about Data Analyst with R Course – Enrol Now.
To learn more about Big Data Course – Enrol Now.

To learn more about Machine Learning Using Python and Spark – Enrol Now.
To learn more about Data Analyst with SAS Course – Enrol Now.
To learn more about Data Analyst with Apache Spark Course – Enrol Now.
To learn more about Data Analyst with Market Risk Analytics and Modelling Course – Enrol Now.

Step-by-Step Guide on Calculated Fields-String Functions in Tableau

Step-by-Step Guide on Calculated Fields-String Functions in Tableau

This blog is an easy-to-read article on String Functions in Tableau’s Calculated Field. Previously, we have covered many other functions in Calculated Fields, like Logical Functions, Date Function and Aggregate Functions. These step-by-step articles are meant for beginners who wish to be well acquainted with functions in Tableau. In fact, these blogs are great for all Tableau enthusiasts who want to explore the numerous amazing features available in Tableau.

So, let’s begin exploring String Functions.

Firstly, get to the Calculated Field window following the steps explained in the previous blog posts. Next, select the option ‘’String’’ from the Functions drop-down menu to view all the string functions.

ASCII Function

ASCII(string)

This function is used to return the ASCII code for the first character in a string. Example:

CHAR Function

CHAR(integer)

This function works in the reverse of ASCII function. CHAR function is used to change an integer ASCII code to a character. Example:

CONTAINS Function

CONTAINS(string, substring)

The CONTAINS function gives back the value TRUE if a string contains a specific substring and FALSE if it doesn’t contain it. Example:

ENDSWITH Function

ENDSWITH(string, substring)

This works in a similar way to the function described above. The function is used to indicate if a string ends with a selected substring or not, returning either TRUE or FALSE. Example:

FIND Function

FIND(string, substring, [start])

The FIND function is used to get the starting position of a substring within a string. The first character of the string is position 1. In case the substring is not located, then it returns the value 0. Example:

If the start argument is defined, any instance of the substring appearing before the start shall be ignored. Here’s an example:

ISDATE Function

ISDATE(string)

This function performs a logical test and is also included in the set of logical functions and date functions. It is used to test a string and determine if it is a valid date or not. Example:

LEFT Function

LEFT(string, num_chars)

A number is specified and using that this function returns the characters in the string. Example:

Incase start_of_week is excluded then it is determined based on the data source.

LEN Function

LEN(string)

This is the length function that is used to return the number of characters in a given string field. Example:

LOWER Function

LOWER(string)

This function is used to convert each and every character in a given string into lower case letters. Example:

LTRIM Function

LTRIM(string)

This function is used to remove spaces at the beginning of a string. Example:

MAX Function

MAX(a, b)

The Max function is included in many categories of functions. When used as a string function, the MAX function gives back the value that is highest in the sort sequence, which is defined by the database for that field’s column. If the field is NULL, then the function returns the value NULL. Example:

MID Function

MID(string, start, [length])

The MID function is used for obtaining characters from the middle of a text string. The start argument states the beginning of the returned value and the length argument gives the number of characters that is to be returned. In case the length isn’t included, then all the characters from the start position is considered. The first character in a string position is 1. Example:

MIN Function

MIN(a, b)

Works similary as the MAX function; the MIN function returns the minimum between a and b. Both must be of identical data type. With strings, the MIN function returns the lower value as per the sort sequence defined in the database. In case either of the argument is null, the function returns the value NULL. Example:

REPLACE Function

REPLACE(string, substring, replacement)

This function finds the occurrence of substring in a string and replaces them with the replacement string. If the substring cannot be located in the string then there’s no replacement. Example:

RIGHT Function

RIGHT(string, num_chars)

This works in reverse of the LEFT function. It gives back the characters starting at the end of a given string. And the amount of characters is determined by the argument giving the number of characters. Example:

RTRIM Functon

RTRIM(string)

This is similar to the LTRIM function and removes trailing spaces at the end of a string. Example:

SPACE Function

SPACE(number)

The SPACE function returns a string of spaces and the number of spaces is mentioned in the number argument. Example:

STARTSWITH Function

STARTSWITH(string, substring)

This works in reverse of the ENDSWITH function and returns TRUE or FALSE depending on whether a string starts with the given substring or not. Example:

TRIM Function

TRIM(string)

The TRIM function removes any leading or trailing spaces in a particular string. Example:

UPPER Function

UPPER(string)

The last function in the list of string function- the UPPER function works in reverse of the LOWER function. It is used to convert all the characters in the string to uppercase characters. Example:

This brings us to an end of the String functions. If you want to learn about the other functions in calculated fields then you must follow DexLab Analytics and check back for our previous blog posts.

This is the concluding blog of the blog series on Tableau’s Calculated Field functions. If you want to learn more about Tableau’s fantastic features then enroll for Tableau BI training courses. We offer professional Tableau certification in Delhi.

 
This article has been sourced from:
https://www.interworks.com/blog/ccapitula/2015/04/22/tableau-essentials-calculated-fields-string-functions
 

Interested in a career in Data Analyst?

To learn more about Data Analyst with Advanced excel course – Enrol Now.
To learn more about Data Analyst with R Course – Enrol Now.
To learn more about Big Data Course – Enrol Now.

To learn more about Machine Learning Using Python and Spark – Enrol Now.
To learn more about Data Analyst with SAS Course – Enrol Now.
To learn more about Data Analyst with Apache Spark Course – Enrol Now.
To learn more about Data Analyst with Market Risk Analytics and Modelling Course – Enrol Now.
The Nitty-Gritty When It Comes to SAS 101

The Nitty-Gritty When It Comes to SAS 101

SAS is a state-of-the-art business intelligence tool that is primarily designed to facilitate reporting, data analysis, mining and predictive modeling using convincing visualization and interactive dashboards. Being a powerful programming language, SAS performs complex statistical data analysis; unlike other built-in tools, like Microsoft Excel, SAS lets users to salvage and run data from a plethora of sources, along with ensuring enough control and freedom during data manipulation and compilation.

Statistical Analysis System (SAS) was introduced for organizations to explore their vast datasets in a highly interactive format. Today, SAS is largely used in machine learning, data science and business intelligence applications. Not only does it arms the organizations with the necessary tools and techniques to monitor key BI metrics, but also develops incredible insights and comprehensive reports, facilitating informed decision-making procedures.

2

SAS Fuelling Career Growth

Business analytics and incredible BI tools have become central for running medium and large-scale enterprises across the globe, efficiently. With data becoming increasingly instrumental in pushing businesses to horizons of success, a majority of organizations is betting on SAS BI analytics.

As a result, the demand for SAS consultants is surging at an accelerating rate. Since more and more companies are adopting SAS analytics and altering the ways they used to work, SAS-related jobs are flooding the market. Handsome pay-packages are being offered to the right candidates, skilled and professional.

According to a recent study, the average salary of a diligent SAS programmer is around 10.8 Lacs – organizations are looking for professionals who would not only know how to slice and dice but also know how to draw the right projections and effectively communicate the insights. This is where SAS training Delhi comes in – Head-start a data journey with DexLab Analytics, as it offers the best SAS analytics training Delhi.

Books: For Enhancing the Level of SAS Knowledge

Besides encompassing SAS certification course modules, books tend to take us all a step closer to the bubbling pool of knowledge – SAS books are carefully written, specifically keeping in mind the requirements and focused areas of programmers and analysts.

Without any further ado, let’s dive into a well-curated list of SAS books that’ll help you ace the language like a pro:


  • SAS Essentials: Mastering SAS for Data Analytics by Elliott and Woodward – With an advanced approach, this book is perfect for master’s students of data analysis and programming and higher-level undergraduates.
  • SAS for Dummies by McDaniel and Hemedinger – An absolute beginner’s approach to SAS, this book is widely popular for its simple language, easier representation of facts and easy-to-follow guidelines.
  • The Little SAS Book by Delwiche and Slaughter – Ideal for beginners and experienced SAS consultants, as well, this book includes self-contained lessons, plenty of examples and interesting visuals.
  • SAS Certification Prep Guide – Released by the SAS institute, this is the final and official test-prep guide to be SAS certified.
  • Learning SAS by Examples: A Programmer’s Guide by Ron Cody – If you are a fast learner, this is the one for you. Each chapter in this book ends with test problems so that you are trained SAS-ready.


As final thoughts, SAS analytics is the most powerful tool for performing complex data analysis. Grasping the fundamentals of SAS language will surely present you a big leg up in the analytical domain. For SAS certification courses, drop by DexLab Analytics.


The blog has been sourced from –

https://www.whoishostingthis.com/resources/sas-programming

https://intellipaat.com/blog/what-is-sas-analytics

https://analyticsindiamag.com/analytics-india-salary-study-2017-by-analytixlabs-aim
 

Interested in a career in Data Analyst?

To learn more about Data Analyst with Advanced excel course – Enrol Now.
To learn more about Data Analyst with R Course – Enrol Now.
To learn more about Big Data Course – Enrol Now.

To learn more about Machine Learning Using Python and Spark – Enrol Now.
To learn more about Data Analyst with SAS Course – Enrol Now.
To learn more about Data Analyst with Apache Spark Course – Enrol Now.
To learn more about Data Analyst with Market Risk Analytics and Modelling Course – Enrol Now.
Call us to know more