Dexlab, Author at DexLab Analytics | Big Data Hadoop SAS R Analytics Predictive Modeling & Excel VBA - Page 24 of 80

How Can Big Data Tools Complement a Data Warehouse?

How Can Big Data Tools Complement a Data Warehouse?

Every person believes that he/she is above average. Businesses feel the same way about their best asset— data. They want to believe that their big data is above average and perfect for implementing advanced big data tools. But, that’s not the case always.

Do you really need big data tools?

In the data world, big data tools like Hadoop Spark and NoSQL are like freight trains delivering goods. Freight trains are powerful, but they’ve limited routes and a slow start. They are great for delivering goods in bulk regularly. However, if you need a swift delivery, freight train might not be the best choice.

So firs of all, it is important to understand if there’s a big data scenario in your business or not.

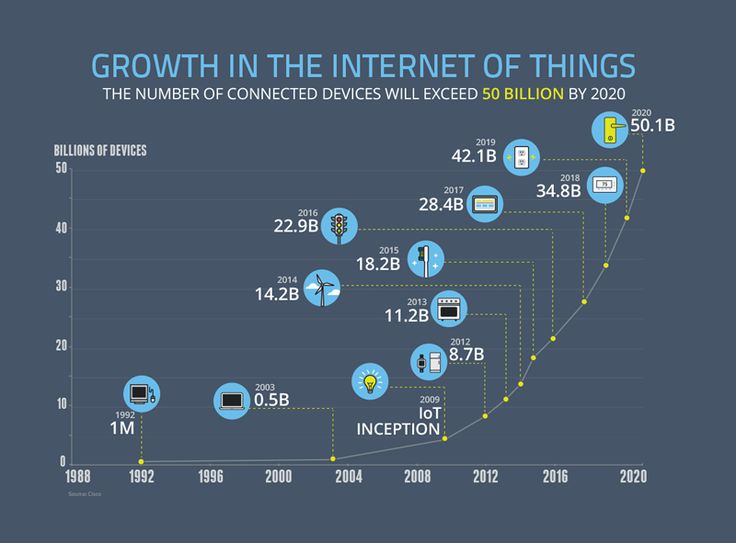
A 100 times increase in data velocity, volume or variety indicates that you have a big data situation at hand. For example, if data velocity increases to hundreds of thousands of transactions per hour from thousands of transactions, or if the data sources shoot up from dozens to hundreds, you can safely conclude that your business is dealing with big data.

In such scenarios, you are likely to get frustrated with traditional SQL tools. A complete revamp or moderate tuning of existing big data tools is needed to effectively handle such massive data sets.

2

What tools to use?

The tool to be used depends on the task at hand. For main business outcomes like sales, payments, etc., traditional reporting tools employed within the data warehouse architecture are suitable. For secondary business outcomes like following the customer journey in detail, tracking browsing history and monitoring device activity, big data tools within data warehouse are necessary. In a data warehouse these events are aggregated into models that show the summarized business processes.

Incorporating Big Data Tools in Data Warehouse

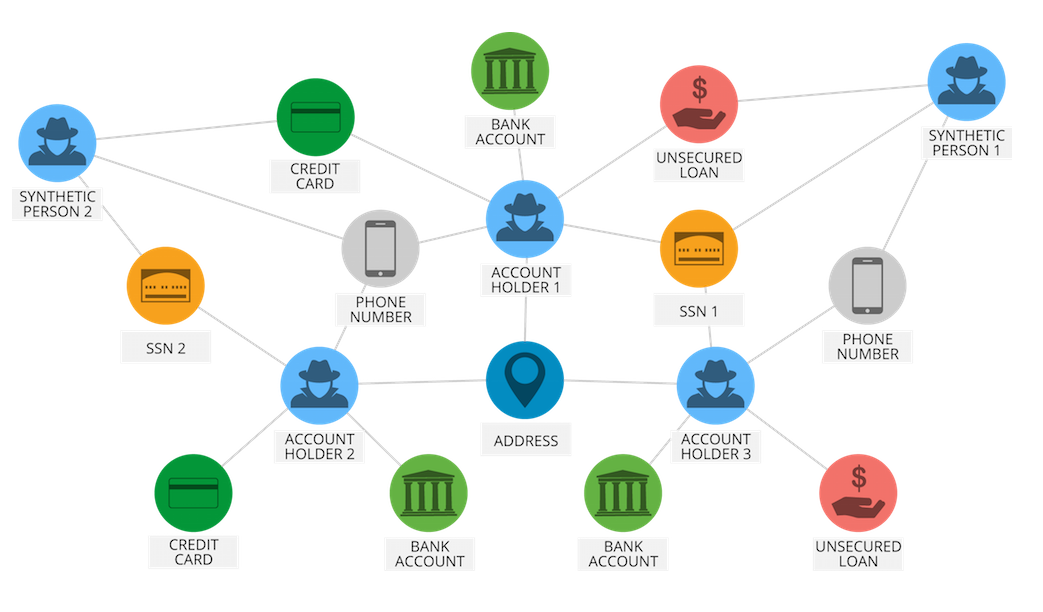
Consider an alarm company with sensors that are connected though the internet across an entire country. Storing the response of individual sensors in a SQL data warehouse would incur huge expenses, but no value. An alternative storage solution is retaining this information in data lake environments that are cheaper and later aggregating them in a data warehouse. For example, the company could define sensor events that constitute a person locking up a house. A fact table recording departures and arrivals could be stoked up in a data warehouse as an aggregate event.

There are many other use cases. Some are given below:

Sum up and filter IoT data:  A leading bed manufacturing company uses biometric sensors in their range of luxury mattresses. Apache Hadoop could be used to store individual sensor readings and Apache Spark can be employed to amass and filter signals. The aggregated data in data warehouses can be used to create time-trended reports once the boundary metrics are surpassed.

Merge real-time data with past data: Financial institutes need live access to market data. However, they also need to store that data and use it for identifying historical trends in future. Merging these two types of data with tools like Apache Kafka or Amazon Kinesis is important because, with these tools the data can be directly streamed to visualization tools and there’s hardly any delay.

The ultimate goal is to form a balance between the two sides of the data pipeline. While it is important to collect as much raw data about customers as possible, it is equally important to use the right tool for the right job.

To read more blogs on the latest developments in the field of big data, follow DexLab Analytics. We are a premier Hadoop training institute in Gurgaon. To aid your big data dreams, we have started a new admission drive #BigDataIngestion where we offer flat 10% discount to all students interested in our big data Hadoop courses. Enroll now!


Reference: https://tdwi.org/articles/2018/07/20/arch-all-5-use-cases-integrating-big-data-tools-with-data-warehouse.aspx


Interested in a career in Data Analyst?

To learn more about Data Analyst with Advanced excel course – Enrol Now.
To learn more about Data Analyst with R Course – Enrol Now.
To learn more about Big Data Course – Enrol Now.

To learn more about Machine Learning Using Python and Spark – Enrol Now.
To learn more about Data Analyst with SAS Course – Enrol Now.
To learn more about Data Analyst with Apache Spark Course – Enrol Now.
To learn more about Data Analyst with Market Risk Analytics and Modelling Course – Enrol Now.

5 Trends Shaping the Future of Data Analytics

5 Trends Shaping the Future of Data Analytics

Data Analytics is popular. The future of data science and analytics is bright and happening. Terms like ‘artificial intelligence’ and ‘machine learning’ are taking the world by storm.

Annual demand for the fast-growing new roles of data scientist, data developers, and data engineers will reach nearly 700,000 openings by 2020, says Forbes, a leading business magazine.


Last year, at the DataHack Summit Kirk Borne, Principal Data Scientist and Executive Advisor at Booz Allen Hamilton shared some slivers of knowledge in the illuminating field of data science. He believes that the following trends will shape up the world of data analytics, and we can’t agree more.

Dive down to pore over a definitive list – thank us later!

Internet of Things (IoT)

Does IoT ring any bell? Yes, it does, because it’s nothing but evolved wireless networks. The market of this fascinating new breed of tech is expected to grow from $170.57 billion in 2017 to $561.04 billion by 2022 – reasons being advanced analytics and superior data processing techniques.

Artificial Intelligence

An improved version of AI is Augmented Intelligence – instead of replacing human intelligence, this new sophisticated AI program largely focuses on AI’s assistive characteristic, enhancing human intelligence. The word ‘Augmented’ stands for ‘to improve’ and together it reinforces the idea of amalgamating machine intelligence with human conscience to tackle challenges and form relationships.

Augmented Reality

Look forward to better performances and successful models? Data is the weapon of all battles. Augmented Reality is indeed a reality now. The recent launch of Apple ARkit is a pivotal development in bulk manufacturing of AR apps. The power of AR is now in the fingertips of all iPhone users, and the development of Google’s Tango is an added thrust.

Hyper Personalization

#KnowYourCustomer, it has become an indispensable part of today’s retail marketing; the better you know your customers, the higher are the chances of selling a product. Yes, you heard that right. And Google Home and Amazon Echo is boosting the ongoing operations.

Graph Analytics

Mapping relationships across wide volumes of well connected critical data is the essence of graph analytics. It’s an intricate set of analytics tools used for unlocking insightful questions and delivering more accurate results. A few use cases of graph analytics is as follows:

  • Optimizing airline and logistic routes
  • Extensive life science researches
  • Influencer analysis for social network communities
  • Crime detection, including money laundering

 
Advice: Be at the edge of data accumulation – because data is power, and data analytics is the power-device.

Calling all data enthusiasts… DexLab Analytics offers state of the art data analytics training in Gurgaon within affordable budget. Apply now and grab amazing discounts and offers on data analyst course.


The article has been sourced from – yourstory.com/2017/12/data-analytics-future-trends


Interested in a career in Data Analyst?

To learn more about Data Analyst with Advanced excel course – Enrol Now.
To learn more about Data Analyst with R Course – Enrol Now.
To learn more about Big Data Course – Enrol Now.

To learn more about Machine Learning Using Python and Spark – Enrol Now.
To learn more about Data Analyst with SAS Course – Enrol Now.
To learn more about Data Analyst with Apache Spark Course – Enrol Now.
To learn more about Data Analyst with Market Risk Analytics and Modelling Course – Enrol Now.

The Future of Humanity Lies in Big Data

The Future of Humanity Lies in Big Data

The World Economic Forum Annual Meeting 2018 was held in Davos, Switzerland. Here politicians, decision-makers from the world’s largest companies, and thought leaders come together to discuss about pressing global challenges. In this important platform, the opening words of historian, professors and famous author Yuval Harari were these— ‘’ we are probably the last generations of Homo sapiens.’’

He went on to explain that the new entities that humans will eventually evolve into will differ a lot more from the modern man than we did from our predecessors, the Neanderthals. However, the new species won’t be products of natural evolution of human genes, rather the result of humans engineering bodies and brains.

2

Harari said that in future, the power will lie in the hands of those who control data. Data is the most important asset in the world and has redefined the prerequisites of power and dominance. Earlier, the ownership of land and subsequently machinery separated humans into aristocrats and commoners, capitalists and workers. However, in the modern age data is the determining asset. This is reflected in the biggest companies of the world. Out of ten of the leading companies in the world, six are tech firms that deal with enormous amounts of data, namely Apple, Microsoft, Amazon, Alphabet, Tencent and Facebook. The fact that these companies are only around two decades old suggests the role big data played in their growth.

Technology has advanced to the extent that data can be used to hack not just computers but also human beings. It takes only two things- data and computing power. Computing power is advancing with enormous speed. Today, the processing powers of mobile phones we use are greater than the best computers from a few decades ago. At the same time, digital information is ever increasing. Humans generate an average of 2.5 million terabytes of data in a day!

The data humans generate is mostly in unstructured form, especially the data that comes from online surveys and social media platforms. However, if analyzed, this data can reveal a lot about the personality of the person generating the data. It is layered with meaning and very open to interpretation. Understandably, analysts are focusing more and more on making sense of this unstructured data.

Hacking the human mind with algorithms

Through machine learning, smart artificial intelligence and deep learning, it is now possible to mine volumes of data and find patterns that earlier went unnoticed to human minds, which are ‘biologically limited’. Right kind of data and the power of computers can be utilized to develop algorithms that know more about people than they do themselves. After all, humans are just biochemical algorithms and the amalgamation of neuroscience and artificial intelligence has enabled the creation of algorithms that help understand the mechanics of human mind better than ever before.

In the words of Harari— ‘’As you surf the internet, as you watch videos or check your social feed, the algorithms will be monitoring your eye movements, your blood pressure, your brain activity, and they will know.’’

To read more blogs on big data, analytics and all the latest trends in these fields, follow DexLab Analytics. We are a leading institute providing Hadoop training in Gurgaon. Do take a look at our big data Hadoop certifications— we are offering flat 10% discount in these courses.


Interested in a career in Data Analyst?

To learn more about Data Analyst with Advanced excel course – Enrol Now.
To learn more about Data Analyst with R Course – Enrol Now.
To learn more about Big Data Course – Enrol Now.

To learn more about Machine Learning Using Python and Spark – Enrol Now.
To learn more about Data Analyst with SAS Course – Enrol Now.
To learn more about Data Analyst with Apache Spark Course – Enrol Now.
To learn more about Data Analyst with Market Risk Analytics and Modelling Course – Enrol Now.

How To Incorporate Embedded Analytics In Your Products or Applications?

How To Incorporate Embedded Analytics In Your Products or Applications?

The adept R&D team shares a common responsibility – devising incredible products and solutions.  Right from VPs and directors of development to DevOps and system engineers – every professional is well aware about their customer expectations.

In today’s data-driven industry, customers desire to collect information regarding product use, numerous status updates, number of times they engaged with the product and so on. In short, they need access to data that not only help unravel crucial insights but also makes the product fetching.

Definitely, you can create your very own analytics solution, but what if it takes so much time that your competitors outgo you? So, what next?

Embedding analytics into your product or application can be your thing for the day, but how to do it effortlessly?

2

Collect Data from Various Sources

We are surrounded by IoT (Internet of Things) and IIoT (Industrial Internet of Things) revolution, where each connected device and sensor accumulates data and this collection and analysis of data is significant to customers. Teams need to sit together and discuss out options for creating an analytics overlay for the product, which will trigger a million questions – how can we get through it? Will our solution scale the growth of number of users? How can we go on improving our products? How do we keep up with all the developments happening in analytics?

Things to Consider While Embedding Analytics

“Start by looking for specific analytic applications that complement your ERP and BI platform investments. In the long term, review vendor capability to support reusable analytics artifacts (i.e., services) in a service-oriented architecture environment,” – says Gartner.

To this, we’ve listed a few functionalities waiting for your attention:

Data Access – How simple do you want your platform to be so as to integrate your data well across all sources and types?

Visualization – Does the platform you chose comprise widgets you need? If not, can you develop them using customization options?

Modeling – How much easier will it be to code for data preparation for user consumption?

Embeddability (iFrame, JS libraries, JavaScript) – Dashboards should be built in a way to suit your customer’s requirements either in mobiles or in web-based applications.

Extensibility (APIs, SDK, JavaScirpt) – No hard fact, for incorporating analytics workflow, solutions supporting API is the key. Otherwise, not getting extensibility will leave you tied to the same analytics platform and can cost you consulting fees and vendor-developed modifications.

Process integration – Generally, integration takes months – so find a vendor who is capable enough to integrate with your products in a week or two so that you remain focused on the benefits alone.

Security – Judge a vendor based on his security credentials – it’s one of the most crucial considerations to tick off your checklist.

As last thoughts, the consideration of these 7 functionalities is just the beginning of embedding analytics into your products or applications. To sail through, the most important thing to do is to choose a suitable vendor who will grow and start thinking of you as a partner and not just any customer. Let him offer you quick, easy and seamless integration, and you solely focus on your customer needs and preferences, and for this, they will LOVE YOU for sure!

If you are still confused about embedded analytics or related concept, let career-building business analyst training courses in Noida help you! For more information on business analyst training delhi, drop by DexLab Analytics.


This blog has been sourced from – https://www.sisense.com/blog/going-embedded-pillar-analytics-success


Interested in a career in Data Analyst?

To learn more about Data Analyst with Advanced excel course – Enrol Now.
To learn more about Data Analyst with R Course – Enrol Now.
To learn more about Big Data Course – Enrol Now.

To learn more about Machine Learning Using Python and Spark – Enrol Now.
To learn more about Data Analyst with SAS Course – Enrol Now.
To learn more about Data Analyst with Apache Spark Course – Enrol Now.
To learn more about Data Analyst with Market Risk Analytics and Modelling Course – Enrol Now.

The 8 Leading Big Data Analytics Influencers for 2018

The 8 Leading Big Data Analytics Influencers for 2018

Big data is one of the most talked about technology topics of the last few years. As big data and analytics keep evolving, it is important for people associated with it to keep themselves updated about the latest developments in this field. However, many find it difficult to be up to date with the latest news and publications.

If you are a big data enthusiast looking for ways to get your hands on the latest data news, then this blog is the ideal read for you. In this article, we list the top 8 big data influencers of 2018. Following these people and their blogs and websites shall keep you informed about all the trending things in big data.

2

Kirk Borne

Known as the kirk in the field of analytics, his popularity has been growing over the last couple of years.  From 2016 to 2017, the number of people following him grew by 30 thousand. Currently he’s the principal data scientist at Booz Allen; previously he has worked with NASA for a decade. Kirk was also appointed by the US president to share his knowledge on Data Mining and how to protect oneself from cyber attacks. He has participated in several Ted talks. So, interested candidates should listen to those talks and follow him on Twitter.

Ronald Van Loon

He is an expert on not only big data, but also Business Intelligence and the Internet of Things, and writes articles on these topics so that readers become familiar with these technologies. Ronald writes for important organizations like Dataconomy and DataFloq. He has over hundred thousand followers on Twitter. Currently, he works as a big data educator at Simplelearn.

Hilary Manson

She is a big data professional who manages multiple roles together. Hilary is a data scientist at Accel, Vice president at Cloudera, and a speaker and writer in this field. Back in 2014, she founded a machine learning research company called Fast Forward labs. Clearly, she is a big data analytics influencer that everyone should follow.

Carla Gentry

Currently working in Samtec Inc; she has helped many big shot companies to draw insights from complicated data and increase profits. Carla is a mathematician, an economist, owner of Analytic Solution, a social media ethusiat, and a must-follow expert in this field.

Vincent Granville

Vincent Granville’s thorough understanding of topics like machine learning, BI, data mining, predictive modeling and fraud detection make him one the best influencers of 2018. Data Science Central-the popular online platform for gaining knowledge on big data analytics has been cofounded by Vincent.

Merv Adrian

Presently the Research Vice President at Gartner, he has over 30 years of experience in IT sector. His current work focuses on upcoming Hadoop technologies, data management and data security problems. By following Merv’s blogs and twitter posts, you shall be informed about important industry issues that are sometimes not covered in his Gartner research publications.

Bernard Marr

Bernard has earned a good reputation in the big data and analytics world. He publishes articles on platforms like LinkedIn, Forbes and Huffington Post on a daily basis. Besides being the major speaker and strategic advisor for top companies and the government, he is also a successful business author.

Craig Brown

With over twenty years of experience in this field, he is a renowned technology consultant and subject matter expert. The book Untapped Potential, which explains the path of self-discovery, has been written by Craig.

If you have read the entire article, then one thing is very clear-you are a big data enthusiast! So, why not make your career in the big data analytics industry?

Enroll for big data Hadoop courses in Gurgaon for a firm footing in this field. To read more interesting blogs regularly, follow Dexlab Analytics– a leading big data Hadoop training center in Delhi. Interested candidates can avail flat 10% discount on selected courses at DexLab Analytics.


Reference: www.analyticsinsight.net/top-12-big-data-analytics-and-data-science-influencers-in-2018


Interested in a career in Data Analyst?

To learn more about Data Analyst with Advanced excel course – Enrol Now.
To learn more about Data Analyst with R Course – Enrol Now.
To learn more about Big Data Course – Enrol Now.

To learn more about Machine Learning Using Python and Spark – Enrol Now.
To learn more about Data Analyst with SAS Course – Enrol Now.
To learn more about Data Analyst with Apache Spark Course – Enrol Now.
To learn more about Data Analyst with Market Risk Analytics and Modelling Course – Enrol Now.

Top 5 Up-And-Coming Big Data Trends for 2018

Top 5 Up-And-Coming Big Data Trends for 2018

The big data market is constantly growing and evolving. It is predicted that by 2020 there will be over 400,000 big data jobs in the US alone, but only around 300,000 skilled professionals in the field. The constant evolution of the big data industry makes it quite difficult to predict trends. However, below are some of the trends that are likely to take shape in 2018.

Open source frameworks:

Open source frameworks like Hadoop and Spark are dominating the big data realm for quite some time now and this trend will continue in 2018. The use of Hadoop is increasing by 32.9% every year- according to Forrester forecast reports. Experts say that 2018 will see an increase in the usage of Hadoop and Spark frameworks for better data processing by organizations. As per TDWI Best Practices report, 60% of enterprises aim to have Hadoop clusters functioning in production by end of 2018.

As Hadoop frameworks are becoming more popular, companies are looking for professionals skilled in Hadoop and similar techs so that they can draw valuable insights from real-time data. Owing to these reasons, more and more candidates interested to make a career in this field are going for big data Hadoop training.

Visualization Models:

A survey was conducted with 2800 BI experts in 2017 where they highlighted the importance of data discovery and data visualization. Data discovery isn’t just about understanding, analyzing and discovering patterns in the data, but also about presenting the analysis in a manner that easily conveys the core business insights. Humans find it simpler to process visual patterns. Hence, one of the significant trends of 2018 is development of compelling visualization models for processing big data.

2

Streaming success:

Every organization is looking to master streaming analytics- a process where data sets are analyzed while they are still in the path of creation. This removes the problem of having to replicate datasets and provides insights that are up-to-the-second. Some of the limitations of streaming analytics are restricted sizes of datasets and having to deal with delays. However, organizations are working to overcome these limitations by end of 2018.

Dark data challenge

Dark data refers to any kind of data that is yet to be utilized and mainly includes non-digital data recording formats such as paper files, historical records, etc. the volume of data that we generate everyday may be increasing, but most of these data records are in analog form or un-digitized form and aren’t exploited through analytics. However, 2018 will see this dark data enter cloud. Enterprises are coming up with big data solutions that enable the transfer of data from dark environments like mainframes into Hadoop.

Enhanced efficiency of AI and ML:

Artificial intelligence and machine learning technologies are rapidly developing and businesses are gaining from this growth through use cases like fraud detection, pattern recognition, real-time ads and voice recognition. In 2018, machine learning algorithms will go beyond traditional rule-based algorithms. They will become speedier and more precise and enterprises will use these to make more accurate predictions.

These are some of the top big data trends predicted by industry experts. However, owing to the constantly evolving nature of big data, we should brace ourselves for a few surprises too!

Big data is shoving the tech space towards a smarter future and an increasing number of organizations are making big data their top priority. Take advantage of this data-driven age and enroll for big data Hadoop courses in Gurgaon. At DexLab Analytics, industry-experts patiently teach students all the theoretical fundamentals and give them hands-on training. Their guidance ensures that students become aptly skilled to step into the world of work. Interested students can now avail flat 10% discount on big data courses by enrolling for DexLab’s new admission drive #BigDataIngestion.


Reference: https://www.analyticsinsight.net/emerging-big-data-trends-2018


Interested in a career in Data Analyst?

To learn more about Data Analyst with Advanced excel course – Enrol Now.
To learn more about Data Analyst with R Course – Enrol Now.
To learn more about Big Data Course – Enrol Now.

To learn more about Machine Learning Using Python and Spark – Enrol Now.
To learn more about Data Analyst with SAS Course – Enrol Now.
To learn more about Data Analyst with Apache Spark Course – Enrol Now.
To learn more about Data Analyst with Market Risk Analytics and Modelling Course – Enrol Now.

A Comprehensive Study on Analytics and Data Science India Jobs 2018

A Comprehensive Study on Analytics and Data Science India Jobs 2018

India accounts for 1 in 10 data science job openings worldwide – with about 90,000 vacancies, India ranks as the second-biggest analytics hub, next to the US – according to a recent study compiled by two renowned skilling platforms. The latest figure shows a 76% jump from the last year.

With the advent of artificial intelligence and its overpowering influence, the demand for skill-sets in machine learning, data science and analytics is increasing rapidly. Job creation in other IT fields has hit a slow-mode in India, making it imperative for people to look towards re-skilling themselves with new emerging technologies… if they want to stay relevant in the industry. Some newer roles have also started mushrooming, with which we are not even acquainted now.

2

Top trends in analytics jobs in 2018 as follows:

  • The total number of data science and analytics jobs nearly doubled from 2017 to 2018.
  • There’s been a sharp contrast in the percentage increase of analytics job inventory in the past years – from 2015 to 2016, the number of analytics jobs increased by 52%, which increased by only 40% from 2014 to 2015.
  • Currently, if we go by the reports, nearly 50000 analytics job positions are currently available to get filled by suitable candidates. Although the exact numbers are difficult to ascertain.
  • Amazon, Goldman Sachs, Citi, E&Y, Accenture, IBM, HCL, JPMorgan Chase, KPMG and Capgemini – are 10 top-tier organizations with the highest number of analytics opening in India.

City Figures

Bengaluru is the IT hub of India and accounts for the largest share of the data science and analytics jobs in India. Approximately, it accounted for 27% of jobs till the quarter of the last year.

Tier-II cities also witnessed a surging trend in such roles from 7% to 14% in between 2017 and 2018 – as startups started operating out of these locations.

Delhi/NCR ranks second contributing 22% analytics jobs in India, followed by Mumbai with 17%.

Industry Figures

Right from hospitality, manufacturing and finance to automobiles, job openings seem to be in every sector, and not just limited to hi-tech industries.

Banking and financial sector continued to be the biggest job drivers in analytics domain. Almost 41% of jobs were posted from the banking sector alone, though the share fell from last year’s 46%.

Ecommerce and media and entertainment followed the suit and contributed to analytics job inventory. Also, the energy and utilities seem to have an uptick in analytics jobs, contributing to almost 15% of all analytics jobs, 4% hike from the last year’s figure.

Education Requirement Figures

In terms of education, almost 42% of data analytics job requirements are looking for a B.Tech or B.E degree in candidates. 26% of them prefer a postgraduate degree, while only 10% seeks an MBA or PGDM.

In a nutshell, 80% of employers resort to hiring analytics professionals who have an engineering degree or a postgraduate degree.

As a result, Data analyst course has become widely popular. It’s an intensive, in-demand skill training that is intended for business, marketing and operations managers, data analyst and professionals and financial industry professionals. Find a reputable data analyst training institute in Gurgaon and start getting trained from the experts today.


The article has been sourced from:

https://qz.com/1297493/india-has-the-most-number-of-data-analytics-jobs-after-us

https://analyticsindiamag.com/analytics-and-data-science-india-jobs-study-2017-by-edvancer-aim


Interested in a career in Data Analyst?

To learn more about Data Analyst with Advanced excel course – Enrol Now.
To learn more about Data Analyst with R Course – Enrol Now.
To learn more about Big Data Course – Enrol Now.

To learn more about Machine Learning Using Python and Spark – Enrol Now.
To learn more about Data Analyst with SAS Course – Enrol Now.
To learn more about Data Analyst with Apache Spark Course – Enrol Now.
To learn more about Data Analyst with Market Risk Analytics and Modelling Course – Enrol Now.

Step-by-step Guide for Implementation of Hierarchical Clustering in R

Step-by-step Guide for Implementation of Hierarchical Clustering in R

Hierarchical clustering is a method of clustering that is used for classifying groups in a dataset. It doesn’t require prior specification of the number of clusters that needs to be generated. This cluster analysis method involves a set of algorithms that build dendograms, which are tree-like structures used to demonstrate the arrangement of clusters created by hierarchical clustering.

It is important to find the optimal number of clusters for representing the data. If the number of clusters chosen is too large or too small, then the precision in partitioning the data into clusters is low.

NbClust

The R package NbClust has been developed to help with this. It offers good clustering schemes to the user and provides 30 indices for determining the number of clusters.

Through NbClust, any combination of validation indices and clustering methods can be requested in a single function call. This enables the user to simultaneously evaluate several clustering schemes while varying the number of clusters.

One such index used for getting optimum number of clusters is Hubert Index.

2

Performing Hierarchical Clustering in R

In this blog, we shall be performing hierarchical clustering using the dataset for milk. The flexclust package is used to extract this dataset.

The milk dataset contains observations and parameters as shown below:

As seen in the dataset, milk obtained from various animal sources and their respective proportions of water, protein, fat, lactose and ash have been mentioned.

For making calculations easier, we scale down original values into a standard normalized form. For that, we use processes like centering and scaling. The variable may be scaled in the following ways:

Subtract mean from each value (centering) and then divide it by standard deviation or divide it by its mean deviation about mean (scaling)

Divide each value in the variable by maximum value of the variable

After scaling the variables we get the following matrix

The next step is to calculate the Euclidean distance between different data points and store the result in a variable.

Hierarchical average linkage method is used for performing clustering of different animal sources. The formula used for that is shown below.

We obtain 25 clusters from the dataset.

To draw the dendogram we use the plot command and we obtain the figure given below.


The Nbclust library is used to get the optimum number of clusters for partitioning the data. The maximum and minimum number of clusters that is needed is stored in a variable. The nbClust method finds out the optimum number of clusters according to different clustering indices and finally the Hubert Index decides the optimum value of the number of clusters.

The optimum cluster value is 3, as can be seen in the figure below.

Values corresponding to knee jerk visuals in the graph give the number of clusters needed.

The graph shows that the maximum votes from various clustering indices went to cluster 3. Hence, the data is partitioned into 3 clusters.

The graph is partitioned into 3 clusters as shown by the red lines.

Now, the points are portioned into 3 clusters as opposed to the 25 clusters we got initially.

Next, the clusters are assigned to the observations.

The clusters are assigned different colors for ease of visualization


That brings us to a close on the topic of Hierarchical clustering. In the upcoming blogs, we shall be discussing K-Means clustering. So, follow DexLab Analytics – a leading institute providing big data Hadoop training in Gurgaon. Enroll for their big data Hadoop courses and avail flat 10% discount. To more about this #SummerSpecial offer, visit our website.


Interested in a career in Data Analyst?

To learn more about Data Analyst with Advanced excel course – Enrol Now.
To learn more about Data Analyst with R Course – Enrol Now.
To learn more about Big Data Course – Enrol Now.

To learn more about Machine Learning Using Python and Spark – Enrol Now.
To learn more about Data Analyst with SAS Course – Enrol Now.
To learn more about Data Analyst with Apache Spark Course – Enrol Now.
To learn more about Data Analyst with Market Risk Analytics and Modelling Course – Enrol Now.

Study: Demand for Data Scientists is Sky-Rocketing; India Leads the Show

Study: Demand for Data Scientists is Sky-Rocketing; India Leads the Show

Last year, India witnessed a surging demand for data scientists by more than 400% – as medium to large-scale companies are increasingly putting their faith on data science capabilities to build and develop next generation products that will be well integrated, highly personalized and extremely dynamic.

Companies in the Limelight

At the same time, India contributed to almost 10% of open job openings for data scientists worldwide, making India the next data science hub after the US. This striking revelation comes at a time when Indian IT sector job creation has hit a slow mode, thus flourishing data science job creation is found providing a silver lining. According to the report, Microsoft, JPMorgan, Deloitte, Accenture, EY, Flipkart, Adobe, AIG, Wipro and Vodafone are some of the top of the line companies which hired the highest number of data scientists this year. Besides data scientists, they also advertised openings for analytics managers, analytics consultants and data analysts among others.

City Stats

After blue chip companies, talking about Indian cities which accounts for the most number of data scientists – we found that Bengaluru leads the show with highest number of data analytics and science related jobs accounting for almost 27% of the total share. In fact, the statistics has further increased from the last year’s 25%, followed by Delhi NCR and Mumbai. Even, owing to an increase in the number of start-ups, 14% of job openings were posted from Tier-II cities.

Notable Sectors

A large chunk of data science jobs originated from the banking and financial sector – 41% of job generation was from banking sector. Other industries that followed the suit are Energy & Utilities and Pharmaceutical and Healthcare; both of which have observed significant increase in job creation over the last year.

Get hands on training on data science from DexLab Analytics, the promising big data hadoop institute in Delhi.

2

Talent Supply Index (TSI) – Insights

Another study – Talent Supply Index (TSI) by Belong suggested that the demand in jobs is a result of data science being employed in some areas or the other across industries with burgeoning online presence, evident in the form of targeted advertising, product recommendation and demand forecasts. Interestingly, businesses sit on a massive pile of information collected over years in forms of partners, customers and internal data. Analyzing such massive volumes of data is the key.

Shedding further light on the matter, Rishabh Kaul, Co-Founder, Belong shared, “If the TSI 2017 data proved that we are in a candidate-driven market, the 2018 numbers should be a wakeup call for talent acquisition to adopt data-driven and a candidate-first approach to attract the best talent. If digital transformation is forcing businesses to adapt and innovate, it’s imperative for talent acquisition to reinvent itself too.”

Significantly, skill-based recruitment is garnering a lot of attention of the recruiters, instead of technology and tool-based training. The demand for Python skill is the highest scoring 39% of all posted data science and analytical jobs. In the second position is R skill with 25%.

Last Notes

The analytics job landscape in India is changing drastically. Companies are constantly seeking worthy candidates who are well-versed in particular fields of study, such as data science, big data, artificial intelligence, predictive analytics and machine learning. In this regard, this year, DexLab Analytics launches its ultimate admission drive for prospective students – #BigDataIngestion. Get amazing discounts on Big Data Hadoop training in Gurgaon and promote an intensive data culture among the student fraternity.

For more information – go to their official website now.


Interested in a career in Data Analyst?

To learn more about Data Analyst with Advanced excel course – Enrol Now.
To learn more about Data Analyst with R Course – Enrol Now.
To learn more about Big Data Course – Enrol Now.

To learn more about Machine Learning Using Python and Spark – Enrol Now.
To learn more about Data Analyst with SAS Course – Enrol Now.
To learn more about Data Analyst with Apache Spark Course – Enrol Now.
To learn more about Data Analyst with Market Risk Analytics and Modelling Course – Enrol Now.

Call us to know more