Dexlab, Author at DexLab Analytics | Big Data Hadoop SAS R Analytics Predictive Modeling & Excel VBA - Page 22 of 80

6 Indian Union Ministries That Are Using Artificial Intelligence

6 Indian Union Ministries That Are Using Artificial Intelligence

It’s no brainer; artificial intelligence has seeped deep into our lives and it has even caught the attention of Indian government. Indian government initiatives are proof of that. The NDA-led BJP government is an admirer of new technology and has given enough importance to AI by setting up an AI Task Force to arm India for the Industrial Revolution 4.0.

In fact, if you follow through a series of events or speeches, you’ll find how frequently our Prime Minister, Narendra Modi projects India and his government to be technologically-driven. In this blog, we’ll share how our top 6 Union Ministries are using Artificial Intelligence on a wider scale for better economy and powerful country presence:
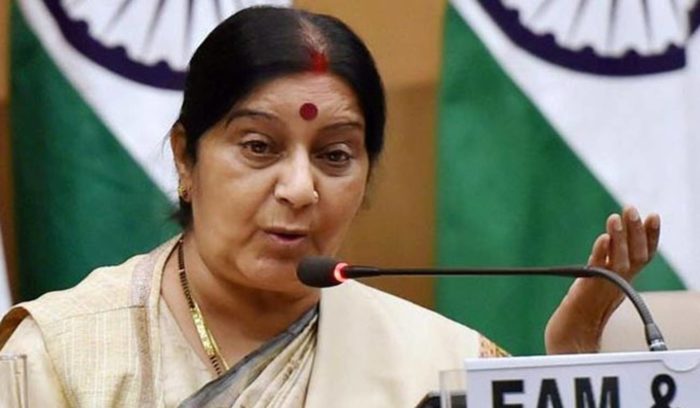
Ministry of Defense

AI Task Force of the Ministry of Defense led by Tata Sons Chairman N Chandrasekaran filed its final report to Defense Minister Nirmala Sitharaman about employing AI for military superiority. The report includes recommendations regarding making India AI-empowered, both in terms of offensive and defensive needs, across naval, aviation, cyber, land, nuclear and biological warfare verticals.

NITI Aayog (the former Planning Commission)

The National Institution for Transforming India recently identified 5 sectors, namely ealthcare, agriculture, education, smart cities and infrastructure, smart mobility and transportation where profound importance will given towards AI implementation to serve societal needs.

Ministry of Information and Broadcasting

Recently, BECIL (Broadcast Engineering Consultants India Limited), functioning under the Ministry of Information and Broadcasting unveiled a tender showing the present government is more likely to take public opinion and media seriously. The government has chalked out a proposal for a respective “technology platform”, which would tap into public emotions by analyzing social media blogs, accounts, posts and even emails to promote nationalism and negate any media bickering by India’s adversaries.

Ministry of Railways

Indian Railways has been in a line of fire for its food catering services. Say thanks to Artificial Intelligence – AI is transforming the way the food is prepared. Not only is it revamping the entire food menu in trains but also promoting a greener environment by going bio-degradable and delivering food in environment-friendly containers.

Ministry of Home Affairs

First of its kind, Intelligence Traffic Management System is going to be installed by the Delhi Police, under the supervision of Home Ministry. This initiative will initiate smart traffic signals, with the help of AI and their first phase is going to be completed by April 2019.

Ministry of External Affairs

With intent to enhance the flow of information between countries, the Ministry of External Affairs had recently conducted a confidential meeting including global AI stalwarts to discuss how to drag attention of Indian Diaspora.

A quick bite: Niti Aayog, under the guidance of CEO Amitabh Kant has been a key stimulator of numerous digital campaigns across the country, including Aadhaar, encompassing biometric programme and India Chain Project.

Now, all you data enthusiasts chart your career in the right direction with DexLab Analyticsbig data hadoop certification in Noida!! DexLab Analytics being a noted big data hadoop institute in Noida offers nothing but the best.


The blog has been sourced from – analyticsindiamag.com/7-indian-union-ministries-who-have-embraced-artificial-intelligence-big-time


Interested in a career in Data Analyst?

To learn more about Data Analyst with Advanced excel course – Enrol Now.
To learn more about Data Analyst with R Course – Enrol Now.
To learn more about Big Data Course – Enrol Now.

To learn more about Machine Learning Using Python and Spark – Enrol Now.
To learn more about Data Analyst with SAS Course – Enrol Now.
To learn more about Data Analyst with Apache Spark Course – Enrol Now.
To learn more about Data Analyst with Market Risk Analytics and Modelling Course – Enrol Now.

Fundamental Concepts of Statistics for Data Science Beginners- Part One

Fundamental Concepts of Statistics for Data Science Beginners- Part One

Do you aspire to be a data scientist? Then is it essential that you have a solid understanding of the core concepts of statistics. Everyone doesn’t have a Ph.D. in Statistics. And that isn’t the only way to excel in the field of data science. But yes, knowing stats well is a prerequisite for data science.

Nowadays, popularly used libraries, like Tesorflow, liberate the user from the intricacies of complex mathematics. Still, it is advisable to be familiar with the fundamental principles on which they work, because that will enable you to use the libraries better.

In this blog, we attempt to shed light on some basic concepts, theorems and equations of statistics for data science.

Statistical Distributions:

Statistical distributions are important tools that you must arm yourself with to be a skilled data scientist. Here, we shall talk about two important distributions, namely Poisson distribution and Binomial distribution.

Poisson distribution:
This distribution is used to find out the number of events that are expected to occur during an interval of time. For example, the number of page views in one second, the number of phone calls in a particular period of time, number of sales per hour, etc.

The symbols used in the equation are:

x: exact number of successes

e: constant equal to 2.71828 approximately

λ: average number of successes per time interval

Poisson distribution is used for calculating losses in manufacturing. Let us consider that a machine generates metal sheets that have ‘x’ flaws per yard. Suppose the error rate is 2 per yard of sheet (λ). Applying this information to Poisson distribution, we can calculate the probability of having exactly two errors in a yard.

Source: Brilliant.org

Poisson distribution is used for faster detection of anomalies.

Binomial distribution:

This is a very common distribution in Statistics. Suppose you have flipped a coin thrice. Using basic combinatorics for flipping a coin thrice, we see that there are eight combinations possible. We find out the probabilities of getting 0, 1, 2 or 3 heads and plot this on a graph. This gives us the binomial distribution for this particular problem. It must be remembered that Binomial distribution curve is similar to a Normal distribution Curve. Normal distribution is used when values are continuous and Binomial distribution is used for discrete values.

Source: mathnstuff.com

Binomial distribution is a discrete probability distribution where number of trials is predetermined and there are two possible outcomes– success and failure, win or lose, gain or loss. Depending on a few conditions, like the total number of trails is large, the probability of success is near 1 and the probability of failure is near 0, the trails are independent and identical, etc., the binomial distribution is approximated to a normal distribution.

Source: MathBitsNotebook

Binomial distribution has many applications in business. For example, it is estimated that 5% of tax returns for individuals with high net worth in USA is fraudulent. These frauds might be uncovered through audits. Binomial distribution is used to find out for ‘n’ number of tax returns that are audited, what is the probability for say 5 fraudulent returns to be uncovered.

There are some more probability distributions, like Bernoulli and Geometric distributions. We shall cover that and more in the following blogs. So, stay tuned and follow DexLab Analytics. The experts here offer top-quality data science courses in Delhi. Go through the data science certification details right now!


References:

upgrad.com/blog/basics-of-statistics-for-data-science

anomaly.io/anomaly-detection-poisson-distribution

analyticsvidhya.com/blog/2017/09/6-probability-distributions-data-science


Interested in a career in Data Analyst?

To learn more about Data Analyst with Advanced excel course – Enrol Now.
To learn more about Data Analyst with R Course – Enrol Now.
To learn more about Big Data Course – Enrol Now.

To learn more about Machine Learning Using Python and Spark – Enrol Now.
To learn more about Data Analyst with SAS Course – Enrol Now.
To learn more about Data Analyst with Apache Spark Course – Enrol Now.
To learn more about Data Analyst with Market Risk Analytics and Modelling Course – Enrol Now.

The Big Data Driven Future of Fashion: How Data Influences Fashion

The Big Data Driven Future of Fashion: How Data Influences Fashion

Big Data is revolutionizing every industry, including fashion. The nuanced notion of big data is altering the ways designers create and market their clothing. It’s not only aiding designers in understanding customer preferences but also helps them market their products well. Hadoop BI is one of the potent tools of technology that provides a wide pool of information for designers to design range of products that will sell.

2

How Does the Mechanism Work?

Large sets of data help draw patterns and obviously trends play a crucial role across the fashion industry. In terms of nature, fashion and trends both are social. Irrespective of the nature of data, structured or unstructured, framing trends and patterns in the fashion industry leads to emerging ideas, strategies, shapes and styles, all of which ushers you into bright and blooming future of fashion.

What Colors To Choose For Your Line?

KYC (Know Your Customer) is the key here too. A fashion house must know which colors are doing rounds amongst the customers. Big data tells a lot about which color is being popular among the customers, and based on that, you can change your offerings subject to trend, style picks and customer preferences.

Men’s or Women’s Clothing: Which to Choose?

Deciding between men’s or women fashion is a pivotal point for any designer. Keep in mind, target demographic for each designer is different, and they should know who will be their prospective customers and who doesn’t run a chance.

Big data tool derive insights regarding when customers will make purchases, how large will be the quantity and how many items are they going to buy. Choosing between men’s and women’s fashion could make all the difference in the world.

Arm yourself with business analyst training courses in Gurgaon; it’s high time to be data-friendly.

Transforming Runway Fashion into Retail Merchandise

Launching a brand in the eyes of the public garners a lot of attention, and the designs need to be stellar. But, in reality the fashion that we often see on runways is rarely donned by the ordinary customers; because, the dresses and outfits that are showcased on the ramp are a bit OTT, thus altered before being placed in the stores. So, big data aids in deciphering which attires are going to be successful, and which will fail down the line. So, use the power of big data prudently and reap benefit, unimaginable across the global retail stores.

Deciding Pricing of the Product

As soon as the garbs leave the runway, they are tagged with prices, which are then posted inside the stores, after analyzing how much the customers are willing to pay for a particular product. For averaging, big data is a saving grace. Big data easily averages the prices, and decides a single mean price, which seems to be quite justifiable.

However, remember, while pricing, each garments are designed keeping in mind a specified customer range. Attires that are incredibly expensive are sold off to only a selected affluent user base, while the pricing of items that are designed for general public are pegged down. Based on previous years’ data, big data consultants can decide the pricing policy so that there’s something for all.

The world of fashion is changing, and so is the way of functioning. From the perspective of fashion house owner, collect as much data as possible of customers and expand your offerings. Big data analytics is here to help you operate your business and modify product lines that appeals to the customers in future.

And from the perspective of a student, to harness maximum benefits from data, enroll in a data analyst course in Gurgaon. Ask the consultants of DexLab Analytics for more deets.


The article has been sourced from

channels.theinnovationenterprise.com/articles/8230-big-data-hits-the-runway-how-big-data-is-changing-the-fashion-industry

iamwire.com/2017/01/big-data-fashion-industry/147935

bbntimes.com/en/technology/big-data-is-stepping-into-the-fashion-world


Interested in a career in Data Analyst?

To learn more about Data Analyst with Advanced excel course – Enrol Now.
To learn more about Data Analyst with R Course – Enrol Now.
To learn more about Big Data Course – Enrol Now.

To learn more about Machine Learning Using Python and Spark – Enrol Now.
To learn more about Data Analyst with SAS Course – Enrol Now.
To learn more about Data Analyst with Apache Spark Course – Enrol Now.
To learn more about Data Analyst with Market Risk Analytics and Modelling Course – Enrol Now.

Business Intelligence: How to Enhance User Adoption?

Business Intelligence: How to Enhance User Adoption?

For business modernization, smart business intelligence solution is the key. Getting to the crux and leveraging vast pools of data that companies gain access to triggers encompassing digital transformation. BI tools not only let companies grasp the data but also develop actionable insights to smoothen the impactful decision-making capabilities and take companies towards future progress.

It’s not an out of ordinary kind of concept, for half a decade, companies have been utilizing these kinds of tools for better efficiency and productive outcomes, yet user adoption for BI tool remains relatively low.

2

Reasons behind Lower User Adoption of Business Intelligence:

Guys at the helm of company affairs, including Chief Information Officers, Chief Technology Officers and Chief Data Officers may think it’s high time to incorporate Business Intelligence tools for smarter operations, but it may not have the same effect on the employees. Employees may not be much inspired!

It holds truer, especially for those employees, who have been in the workforce for long and haven’t for once used such intricate, new-age tools to decipher what data says. For them, old is gold – they prefer to continue their own kind of data analysis in the same way they have been doing for so many years.

How Companies Can Improve Data-Driven Mindsets?

In order to be ahead of the curve, the data mindset of the workforce needs to be changed. If businesses have to be completely data-driven, they can’t just take Business Intelligence lightly.

Here are a few ways business can drive user adoption of BI:

Introduce BI as a necessity, not luxury

Once understanding company data was considered as an added advantage to normal work procedures. But, in this age of digital transformation, it’s no longer a luxury but a necessity. And sooner the employees realize this, the better it becomes.

Employees across organizations should have thorough access to data. It boosts decision-making. By going completely data-driven, business intelligence user adoption will automatically improve. Along with employees, businesses too will benefit a lot from such adoption.

Promote Favorable Impacts of BI

Putting light on success stories of BI implementation helps! It’s being regarded as a powerful way to encourage budding data scientists and already in-workforce employees: the powerful impression of BI and its significant impacts on key performance indicators will tell a different story to the world.

The best way of doing it would be by developing an internal case study that will elucidate how a team after incorporating Business Intelligence fulfilled their desired organizational goals. For best results, let a manager or C-level employee present the case study to the workforce. Surely, this will enhance levels of user adoption of BI.

Continuous Training is a Must

Business Intelligence calls for no one-track solutions; the concept deals with almost endless opportunities, which means continuous training initiatives should be taken up to explore every facet of this cutting edge tool.

When an employee have deeper knowledge about a particular tool, they are more likely to derive maximum benefits out of it. So, by giving continuous training, through various FAQs, webinars and video tutorials, employees can now become very easily completely data-driven.

Now, following these easy yet effective tips, business leaders can increase their lower rates of BI adoption and stride towards full digital transformation of their companies, triggering impactful future goals.

Want to know more about Data Science Courses in Noida? Drop by DexLab Analytics; for a fulfilling learning experience, opt for their Data Science Courses. They are simply excellent and student-friendly. 

 
The blog has been sourced from — www.sisense.com/blog/make-business-intelligence-necessity-drive-user-adoption
 

Interested in a career in Data Analyst?

To learn more about Data Analyst with Advanced excel course – Enrol Now.
To learn more about Data Analyst with R Course – Enrol Now.
To learn more about Big Data Course – Enrol Now.

To learn more about Machine Learning Using Python and Spark – Enrol Now.
To learn more about Data Analyst with SAS Course – Enrol Now.
To learn more about Data Analyst with Apache Spark Course – Enrol Now.
To learn more about Data Analyst with Market Risk Analytics and Modelling Course – Enrol Now.

Cryptojacking: How Businesses Can Protect Systems from This Latest Cyber Threat

Cryptojacking: How Businesses Can Protect Systems from This Latest Cyber Threat

The rising threat of cyber attacks and the sophistication of these crimes have created a frightening security situation all over the world. The cases of data and privacy breach are increasing every day. Both private and public sector are at risk and understandably the average internet user is very paranoid. Cybercriminals keep innovating new ways to take advantage of security vulnerabilities present in systems.

Cryptojacking is one such cyber threat that has targeted countless unsuspected users all around the world. Particularly in India, cryptojacking has become a pressing problem. According to a recent study by Quick Heal Technologies, from January to May 2018, nearly 3 million cryptojacking cases have been reported.

2

What is Cryptojacking?

Cryptojacking is a method of hacking into systems and illegally using them to mine cryptocurrency. Malicious scripts are loaded into machines without the knowledge of owners. The group or individual that loads the malicious program reaps the rewards of cryptomining activities, while the owner of the machine isn’t provided any kind of compensation.

There are two types of processes used to carry out cryptojacking attacks:

In the first process, a cryptomining code is installed in the compromised system by means of an infected file.

In the second method, a website or online ad is infected with a JavaScript-based cryptomining script. When users click on this link, the scrip auto-executes itself.

Why is Cryptojacking So Challenging for Businesses?

The malicious script transmits processing power from the compromised machine to the unauthorized cryptocurrency mining. This affects the computer in the following ways:

  • Slows down the system
  • Causes the machine to lag
  • Some applications become completely inaccessible
  • Resource-intensive operations related to cryptomining damage the hardware of an infected system and at times even cause it to crash repeatedly.

Cryptojacking is a serious business hazard. These disruptions result in downtime and IT tickets, which basically cost the business a lot of money. Global businesses lose billions of dollars due to IT downtime. Infected systems consume huge amounts of electricity and hence the operational costs increase significantly. Bottom line, cryptojacking eats away business revenues, which if taken precautions may be avoided.

How to Protect from Cryptojacking Attacks?

The modern cyber-attack landscape evolves every minute. In the face of such dynamism, it is absolutely essential to adopt a multi-layered approach for preserving IT security. The need of the hour is to invest in advanced security solutions. These solutions must include the following features:

Endpoint Security: In order to protect endpoints from cryptojacking a robust Endpoint Security solution with cutting-edge features like behavior based detection and antivirus is necessary.

Web Filtering: Web Filtering includes a set of tools that can be customized to safeguard your business network from suspicious websites. Distrustful websites are blocked and users are prevented from accessing them.

Network Monitoring: This is a tool that is able to detect huge surges in processor activity, which is a well-known symptom of a cryptojacked device. It helps network administrators keep a close eye on data anomalies.

Mobile Device Management (MDM): Business users depend on mobile phones for conveniently carrying out activities. Hence, deploying a robust MDM solution is important for preventing this type of hijacking.

Apart from these, businesses must ensure basic security hygiene, such as installing a web security solution for the safety of visitors on their website and also carry out patching of latest security updates. For example, SecBI has developed an artificial intelligence solution that analyzes network data and identifies cryptojacking threats.

For more blogs on the latest technical innovations, follow the premier big data Hadoop training instituteDexLab Analytics. Do take a look at the course details for big data Hadoop certification in Delhi.


Reference: cio.economictimes.indiatimes.com/tech-talk/how-businesses-can-secure-their-systems-from-cryptojacking/3175


Interested in a career in Data Analyst?

To learn more about Data Analyst with Advanced excel course – Enrol Now.
To learn more about Data Analyst with R Course – Enrol Now.
To learn more about Big Data Course – Enrol Now.

To learn more about Machine Learning Using Python and Spark – Enrol Now.
To learn more about Data Analyst with SAS Course – Enrol Now.
To learn more about Data Analyst with Apache Spark Course – Enrol Now.
To learn more about Data Analyst with Market Risk Analytics and Modelling Course – Enrol Now.

Top 5 Reasons to Feel Excited about Data Analytics This Year

TOP 5 REASONS TO FEEL EXCITED ABOUT DATA ANALYTICS THIS YEAR

‘Tis the year to be super excited about data analytics! Without further ado, let’s find out why:-

Cloud Infrastructure is Expanding and Fostering Fast-paced Innovations

Considering the recent trends in cloud data and related applications, 2018 is a critical time for cloud analytics. Businesses must steadily transition to a cloud environment and for that a robust and flexible analytics strategy is to be adopted. Through cloud analytics platforms businesses can leverage common data logic and unlock new analytic capabilities to plan, predict, discover, visualize, simulate and manage. In short, what businesses need is a hybrid mode that includes data, analytics and applications spread across multi-cloud and on-premise environments. Research suggests that by employing analytics that are built to work together businesses can increase the total cost of ownership (TCO) by 3-5 times and the return on investment (ROI) can be as high as 171%.

Source: ZDNet

The Power of Machine Learning Unleashed

Machine learning and artificial intelligence have made big progress in the last one year. Hence, automated and AI powered tools are becoming central in decision-making. The rapid growth in automation has profound effect on the way analytics is used. It can be said that machine learning is perking up analytics big time. With the help of automated technologies users can develop contextual insights with ease and uncover patterns from massive volumes of data. And data scientists are harnessing these automated technologies to drive scalable insights for smarter business processes.

Source: Tech Carpenter

The Spreadsheet is Nearing Retirement

The spreadsheet has come a long way since its inception. But, for many businesses it is time to move to better alternatives that are free from some of the inefficiencies and inaccuracies of spreadsheets. For these businesses the solution is shifting to cloud-based models that help connect operational plans to financial plans.

Source: GCN.com

Customer Experience is the Current Competitive Battleground

According to the Harris Interactive study, 88% customers prefer purchasing products or services from a company that offers great customer service over a company that provides the latest innovations. Quality customer experience is crucial for business growth. And for that companies must invest in CEM (customer experience management). CEM technology collects data from varied sources and uses advanced analytics to leverage historical experiences and access data fast. This platform ensures that customers are satisfied, their grievances are addressed and there’s an improvement in sales, profits and brand image.

Source: StoryMiners

Big data Industry to Grow 7 times in 7 years!

Studies suggest that the big data industry in India is likely to become a 20 billion dollar industry by 2015. It is expected that analytics and data science market will grow by 7 times in the next 7 years. Currently, the analytics and big data industry is worth an estimated $2.71 billion in annual revenues and is growing rapidly at a rate of 33.5% CAGR.

Source: Analytics India

Do you know that this year over 16,000 freshers have been hired in the analytics workforce of India? That’s an increase by 33% from last year’s 12,000! Join the big data bandwagon with a professional certificate from this reputed data analyst training institute in Delhi. One of the unique features of this data analyst course in Gurgaon is that it includes trainers who are industry-experts in this field and hence bring with them excellent domain experience.


References:

digitalistmag.com/cio-knowledge/2018/01/03/top-10-trends-for-analytics-in-2018-05668659

360logica.com/blog/10-reasons-excited-data-analytics-2018

analyticsindiamag.com/analytics-data-science-industry-in-india-study-2018-by-analytixlabs-aim

getcloudcherry.com/blog/competition-customer-experience


Interested in a career in Data Analyst?

To learn more about Data Analyst with Advanced excel course – Enrol Now.
To learn more about Data Analyst with R Course – Enrol Now.
To learn more about Big Data Course – Enrol Now.

To learn more about Machine Learning Using Python and Spark – Enrol Now.
To learn more about Data Analyst with SAS Course – Enrol Now.
To learn more about Data Analyst with Apache Spark Course – Enrol Now.
To learn more about Data Analyst with Market Risk Analytics and Modelling Course – Enrol Now.

A Comprehensive Guide on the Functioning of Chatbots

A Comprehensive Guide on the Functioning of Chatbots

Chatbot is a technology that is rapidly growing and is likely to power 85% of customer service by 2020. And this is already mid 2018. Though this technology is booming, many are new to the concept of chatbots. To help such newbies, on this blog we will discuss what a chatbot really is and also talk about the different parameters related to it.

So, what is a chatbot?

A chatbot is a computer program that interacts with human users through simulated conversations using the Internet. The chatbot cannot set commands by itself. It simply provides solutions to human queries through the most natural medium of communication, which is chatting and messaging in the language of customers.

The next question that comes to our mind is-

What are the tasks that a chatbot can perform?

In this regard, it must be kept in mind that chatbots are basically programs that automate tasks. The tasks span over a variety of fields, including customer support, appointment scheduling, performing surveys and lead generation. Here are some areas of the business areas where chatbots have been very beneficial:

  1. A chatbot answers FAQs and gives the information customers want about different products and services. In short, businesses keep chatbots to handle all the customer queries. In fact, bots are able to respond to multiple queries at a time!
  2. It helps customers schedule appointments, plan trips and informs them if a product is available or not.

It has been found that companies that use the services of chatbots can save up to 60% of their time!

Why have Chatbots become the talk of town?

Most important reason for their growing popularity is that they allow the company to be present on a platform that is extensively used by customers– online. With the advent of chatbots, brands can be in the same space as their customers, without being physically present. Customers are able to interact with businesses 24/7. Thus, bots act like sales representatives online that are ready to assist customers. This directly leads to higher sales for many businesses. Moreover, chatbots respond depending on the industry it’s employed in and the customer it’s interacting with. Hence, it helps deliver personalized responses to every single user.

Working of a chatbot:

Chatbots are basically a form of AI that is developed by means of complicated programming. There are two main types of chatbots. Some chatbots function through a set of structured questions and answers and some function mainly through machine learning algorithms. The later is more complicated. However, both may look the same to users.

Scripted and structured bots: The chatbots working with structured question and answers have a limited knowledge base. Their skills are limited to correctly answering only specific questions which the bots are programmed to answer. There might be questions that aren’t included in the programming, to which the bot is likely to respond with ‘’I’m sorry, I didn’t understand the question.’’ These bots are as smart as the programming behind them permits. These types of bots are generally used for marketing in Messenger platforms. They perform tasks like sending daily mails and content pieces, generating leads, performing surveys, etc.

Source: DZone

NLP based chatbots: These bots understand language very well and deviations from the standard set of questions won’t baffle them easily. NPL (natural language processing) is a part of machine learning and the incorporation of NPL is what enables these bots to understand the nuances of language so well. Obviously, it takes a lot more work to develop these intelligent chatbots. There are three main concepts in NPL- intent, entity and utterance. Intent and entities are responsible for structuring the chatbot, whereas utterance is responsible for improving the bots with use. The best part about machine learning chatbots is that the more they are interacted with, the cleverer they become.

With the availability of free DIY chatbot platforms, chatbots can now be created without prior knowledge on coding. But, if you wish to be a pro in this field then acquire the necessary skills through the machine learning training in Gurgaon. For all the trending news on big data and related tech, follow DexLab Analytics. We are an institute that provides high-quality machine learning courses in India.


Reference: dzone.com/articles/here-is-a-complete-guide-of-chatbots

onlim.com/en/how-do-chatbots-work


Interested in a career in Data Analyst?

To learn more about Data Analyst with Advanced excel course – Enrol Now.
To learn more about Data Analyst with R Course – Enrol Now.
To learn more about Big Data Course – Enrol Now.

To learn more about Machine Learning Using Python and Spark – Enrol Now.
To learn more about Data Analyst with SAS Course – Enrol Now.
To learn more about Data Analyst with Apache Spark Course – Enrol Now.
To learn more about Data Analyst with Market Risk Analytics and Modelling Course – Enrol Now.

#TimeToReboot: 10 Random, Fun Facts You Must Know About IT Industry

#TimeToReboot: 10 Random, Fun Facts You Must Know About IT Industry

Indian IT sector is expected to grow at a modest rate this fiscal year, which started from April – companies are expanding their scopes and building new capabilities or enhancing the older ones. Demand for digital services is showing spiked up trends. The good news is that the digital component industry is flourishing, faster than expected. It’s forming a bigger part of tech-induced future, and we’re all excited!!

On that positive note, here we’ve culled down a few fun facts about IT industry that are bound to intrigue your data-hungry heart and mind… Hope you’ll enjoy the read as much as I did while scampering through research materials to compile this post!

Let’s get started…

Email is actually older than the World Wide Web.

Our very own, Hewlett Packard started in a garage… In fact, several other top notch US digital natives, including Microsoft, Google and Apple had such humble beginnings.

Bill Gates’ own house was designed using a MAC PC, yes you heard that right!

The very first computer mouse was carved out of wood. Invented by Dough Engelbart, first-ever mouse wasn’t made of any plastic or metal of any kind, but plain, rustic WOOD.

The QWERTY keyboard, which we use now, is simple, easy to use and effective. But, did you know: DVORAK keyboard was proven to be at least 20X faster?

The original name of Windows OS was Interface Manager.

Do you think 1GigaByte is enough? Well, the first 1 GB hard drive made news in 1980 with a price tag of $40.000 and gross weight of 550 pounds.

Very first PC was known as ‘Simon’ from Berkley Enterprise. It was worth $300, which was quite an ostentatious amount back in the 1950s, the year when this PC was launched.

In 1950’s computers were called ‘Electronic Brains’.

1 out of 8 marriages in the US happened between couples who’ve met online. Wicked?


Feeling excited to know all these stuffs… Now, on serious note, in the days to come, the Indian IT industry is all set to transform itself with high velocity tools and technology, and if you want to play a significant role in this digital transformation, arm yourself with decent data-friendly skill or tool.

The deal turns sweeter if you hail from computer science background or have a knack to play with numbers. If such is the case, we have high end business analyst training courses in Gurgaon to suit your purpose and career aspiration – drop by DexLab Analytics, being a top of the line analytics training institute, they bring to you a smart concoction of knowledge, aptitude and expertise in the form of student-friendly curriculum. For more details, visit their site today.


The blog has been sourced from:

qarea.com/blog/facts-from-the-it-industry

forbesindia.com/article/leaderboard/indian-it-services-sector-time-for-a-reboot/49671/1


Interested in a career in Data Analyst?

To learn more about Data Analyst with Advanced excel course – Enrol Now.
To learn more about Data Analyst with R Course – Enrol Now.
To learn more about Big Data Course – Enrol Now.

To learn more about Machine Learning Using Python and Spark – Enrol Now.
To learn more about Data Analyst with SAS Course – Enrol Now.
To learn more about Data Analyst with Apache Spark Course – Enrol Now.
To learn more about Data Analyst with Market Risk Analytics and Modelling Course – Enrol Now.

Python Is Gaining Popularity against SAS, R – Says Burtch Works

Python Is Gaining Popularity against SAS, R – Says Burtch Works

Python is on the rise – though R and SAS are languages of choice amongst the data scientists but R is soon ascending the steps of analytics ladder. Already a lot of practitioners and data scientists have armed themselves up with this incredible R Programming tool for future career aspirations. To add volume to the statement, we’ve a new survey from a high-end recruitment agency, Burtch Works – let’s see what their comprehensive report says about our preferred language.

The survey began with R, an open source tool and SAS, another commercial tool. Later in 2016, Burtch Works added another open source tool, Python.

This year, however we witnessed something that never happened before. There’s no clear winner, this time – Python stood at 33%, R at 33% and SAS at 34%. “This is the first year that we’ve seen SAS, R, and Python all at the same level of preference,” said Linda Burtch, a quantitative recruiting specialist and Managing Director at Burtch Works.

2

According to the results, R declined slightly as compared to last year figure, whereas SAS remained fairly flat. On a positive note, Python continued reflecting an increasing trend over the last two years, since its inclusion.

“The most noticeable trend from the 2018 data was Python’s ascension, and how Python’s growing popularity has been eroding support for R,” Burtch shared with InformationWeek. “Data scientists have typically strongly preferred Python, but predictive analytics professionals working primarily with structured data are shifting that way as well.”

To grab Python Certification, visit DexLab Analytics

But what makes Python so fetching? It is considered to be a very strong language for machine learning, perfect for data visualizations and other statistical applications, better than SAS and R. Budding professionals enjoy working with Python(48%) as compared to R(38%) and SAS(14%). Survey reveals that open source tools, such as R and Python are in-favor of professionals who are young and new in technology. 

Going by the survey results, the use of R has fallen drastically from 50% in 2016 to below 40% this year. At the same time, the growth of python has been phenomenal – in 2016, it was standing at 20% and this year, it is hovering around 50%.

“Python gained support in almost every category we examined this year and has especially taken hold at the early career level, with professionals who have five or less years of work experience,” Burtch concluded to InformationWeek.

As parting thoughts, Python is considered to be a very versatile programming language. Its popularity soared in recent years – its usage and employability knows no bounds. For beginners and newcomers, it’s like a treasure trove waiting to be discovered. So, if you are one of them, it’s high time to consider a Machine Learning Using Python certification program – easy to learn and highly accessible, Python programming is ideal to get started. Most importantly, its simplified syntax with an undue focus on natural language is an added bonus.


The blog has been sourced from – 

informationweek.com/big-data/ai-machine-learning/python-gains-on-sas-r/d/d-id/1332331

kdnuggets.com/2017/07/6-reasons-python-suddenly-super-popular.html


Interested in a career in Data Analyst?

To learn more about Data Analyst with Advanced excel course – Enrol Now.
To learn more about Data Analyst with R Course – Enrol Now.
To learn more about Big Data Course – Enrol Now.

To learn more about Machine Learning Using Python and Spark – Enrol Now.
To learn more about Data Analyst with SAS Course – Enrol Now.
To learn more about Data Analyst with Apache Spark Course – Enrol Now.
To learn more about Data Analyst with Market Risk Analytics and Modelling Course – Enrol Now.

Call us to know more