Dexlab, Author at DexLab Analytics | Big Data Hadoop SAS R Analytics Predictive Modeling & Excel VBA - Page 18 of 80

Human Element Remains Critical for Enhanced Digital Customer Experience

Human Element Remains Critical for Enhanced Digital Customer Experience

Digital customer engagement and service is trending the charts. Companies are found actively focusing on establishing long-lasting relationships in sync with customer expectations to hit better results and profitable outcomes. Customers are even hopeful about businesses implementing smart digital channels to solve complex service issues and finish transactions.

70 % of customers expect companies to have a self-service option in their websites and 50% expect to solve issues concerning products or services themselves – according to Zendesk.

In this regard, below we’ve charted down a few ways to humanize the customer experience, keeping the human aspect in prime focus:

2

Adding Human Element through Brand Stories

Each brand tells a story. But, how, or in what ways do the brands tell their story to the customers? Is it through videos or texts? Brand’s history or values need to be iterated in the right voice to the right audience. Also, the companies must send a strong message saying how well they value their customers and how they always put their customers in the first place, before anything else.

Additionally, the company’s sales team should always look forward to help their customers with after-purchase information – such as how well the customers are enjoying certain features, whether any improvement is needed and more – valuable customer feedback always help at the end of the day!

AI for Feedback

Identify prospective customers who are becoming smarter day by day. This is done via continuous feedback loops along with automated continuous education. Whenever you receive feedback from a specific customer interaction, it’s advised to feed it back to their profile. An enclosed feedback loop is quite important to gain meaningful information about customers and their purchasing pattern. This is the best way to know well your customers and determine what they want and how.

Time and again, customers are asked by brands to take part in specific surveys and rate their services, describing what their feelings are about those particular products or services. All this helps comprehend customer’s satisfaction quotient regarding services, and in a way helps you take necessary action in enhancing customer experience.

Personalized Content for Customer Satisfaction

Keeping customers interested in your content is the key. Become a better story-teller and enhance customer satisfaction. Customers like it when you tell your brand’s story in your own, innovative way. But, of course, marketers face a real challenge when writing down an entertaining story, not appearing like written by agency but themselves.

A token of advice from our side – never go too rigid; be original, and try to narrate the story in an interactive way. To craft a unique brand story, the essence lies in using little wit, humor and a dash of self-effacement to add a beat to the brand.

End Notes

As parting thoughts, we would like to say always act in real-time, and better understand what your customers what and their behavioral traits. This way it would be easier to predict their next move. What’s more, your brand should be people-based and make intelligent use of customer’s available data to develop a deeper understating about your users and their respective needs.

DexLab Analytics is a prime data analyst training institute in Delhi – their data analyst training courses is as per industry standards and brimmed with practical expertise merged with theoretical knowledge. Visit the website now.

 
The blog has been sourced fromdataconomy.com/2018/08/how-to-keep-the-human-element-in-digital-customer-experience
 

Interested in a career in Data Analyst?

To learn more about Data Analyst with Advanced excel course – Enrol Now.
To learn more about Data Analyst with R Course – Enrol Now.
To learn more about Big Data Course – Enrol Now.

To learn more about Machine Learning Using Python and Spark – Enrol Now.
To learn more about Data Analyst with SAS Course – Enrol Now.
To learn more about Data Analyst with Apache Spark Course – Enrol Now.
To learn more about Data Analyst with Market Risk Analytics and Modelling Course – Enrol Now.

A Comprehensive Analysis of Many-to-Many Database Relationships

A Comprehensive Analysis of Many-to-Many Database Relationships

Many-to-many relationships are trickier. Especially, when it involves data on the tables. In situations such as this, comprehending crucial scenarios, different circumstances and pursuing effective interaction with data becomes a priority.

To lighten up things, let’s start from the basics – where we differentiate the terms ‘database’ and ‘relationship’. This will help you envisage different circumstances as we discuss them later.

‘Database’ is nothing but a particular way of organizing information so that it can be easily accessible, manageable and be updated as and when required. Data is stored in rows, columns and tables – it makes it easier to find what you need.

2

Interestingly, ‘relationship’ between various items of data in a database is all about establishing logic for combining data from one or more tables. Relationships are developed through stable connections between two or more tables. Below, we’ve enumerated 3 types of relationships:

  • One-to-One Relationship – In this, the field connecting both tables has unique values in every row.
  • One-to-Many Relationship – Here, one table consists of unique values for every row, but the other one carries duplicate values for one or all corresponding values on the first table.
  • Many-to-Many Relationship – Here, you will find duplicated values on both sides of the table, resulting in excessive calculations for each query.

Breakdown of M2M Relationship

Put simply, Many-to-Many Relationship happens when a field from two or more tables includes same value, values that are duplicated in both tables. Connections such as these are complex and often confusing.

So, how to resolve them?

Some of the most common methods to resolve M2M Relationships are given below, but the approaches are subject to the number of tables involved. For example, if there are only 2 tables and 1 Relationship, here goes the best option for you:

  • Break the relationship into two distinct One-to-Many relationships
  • Build an aggregated table

In case, there are more than 2 tables and more than 1 relationship, the best options for you would be:

  • Apply the LookUp Function, copy a value from a table and import it onto another
  • Merge the two tables into one

M2M Relationship and SQL Databases

Some good news is rolling your way! SQL and other such relational databases, empowered with referential integrity are found providing support to Many-to-Many Relationships. This helps in keeping relationships productive and working well, and SQL is great at combining these in queries.

This is why SQL tops the list against all contemporary programming languages – it handles Many-to-Many Relationships in the best way possible. Today, SQL Certification Training has become widely popular. Anyone who is proficient with Windows OS can opt for Microsoft SQL Server training – such programs are known to blend theoretical knowledge with practical expertise quite seamlessly. Business Analysts, SQL Developers, ADMIN are some of the most coveted job profiles an expert in SQL can seek through.

For more information on SQL Certification Training in Gurgaon, drop by DexLab Analytics: they are specialist training partner for many advanced professional skill building programmes.


The blog has been sourced from — www.sisense.com/blog/many-many-relationships-good-relationship


Interested in a career in Data Analyst?

To learn more about Data Analyst with Advanced excel course – Enrol Now.
To learn more about Data Analyst with R Course – Enrol Now.
To learn more about Big Data Course – Enrol Now.

To learn more about Machine Learning Using Python and Spark – Enrol Now.
To learn more about Data Analyst with SAS Course – Enrol Now.
To learn more about Data Analyst with Apache Spark Course – Enrol Now.
To learn more about Data Analyst with Market Risk Analytics and Modelling Course – Enrol Now.
5 Incredible Techniques to Lift Data Analysis to the Next Level

5 Incredible Techniques to Lift Data Analysis to the Next Level

Today, it’s all about converting data into actionable insights. How much data an organization collects from a plethora of sources is all companies cares of. To understand the intricacies of the business operations and helps team identify future trends, data is the power.

Interestingly, there’s more than one way to analyze data. Depending on your requirement and types of data you need to have, the perfect tool for data analytics will fluctuate. Here, we’ve 5 methods of data analysis that will help you develop more relevant and actionable insights.

DexLab Analytics is a premier data analytics training institute in Noida. It offers cutting edge data analyst courses for data enthusiasts.

2

Difference between Quantitative and Qualitative Data:

What type of data do you have? Quantitative or qualitative? From the name itself you can guess quantitative deal is all about numbers and quantities. The data includes sales numbers, marketing data, including payroll data, revenues and click-through rates, and any form of data that can be counted objectively.

Qualitative data is relatively difficult to pin down; they tend to be more subjective and explanatory. Customer surveys, interview results of employees and data that are more inclined towards quality than quantity are some of the best examples of qualitative data. As a result, the method of analysis is less structured and simple as compared to quantitative techniques.

Measuring Techniques for Quantitative Data:

Regression Analysis

When it comes to making forecasts and predictions and future trend analysis, regression studies are the best bet. The tool of regression measures the relationship between a dependent variable and an independent variable.

Hypothesis Testing

Widely known as ‘T Testing’, this type of analytics method boosts easy comparison of data against the hypothesis and assumptions you’ve made regarding a set of operations. It also allows you to forecast future decisions that might affect your organization.

Monte Carlo Simulation

Touted as one of the most popular techniques to determine the impact of unpredictable variables on a particular factor, Monte Carlo simulations implement probability modeling for smooth prediction of risk and uncertainty. This type of simulation uses random numbers and data to exhibit a series of possible outcomes for any circumstance based on any results. Finance, engineering, logistics and project management are a few industries where this incredible tool is widely used.

Measuring Techniques for Qualitative Data:

Unlike quantitative data, qualitative data analysis calls for more subjective approaches, away from pure statistical analysis and methodologies. Though, you still will be able to extract meaningful information from data by employing different data analysis techniques, subject to your demands.

Here, we’ve two such techniques that focus on qualitative data:

Content Analysis

It works best when working with data, like interview data, user feedback, survey results and more – content analysis is all about deciphering overall themes emerging out of a qualitative data. It helps in parsing textual data to discover common threads focusing on improvement.

Narrative Analysis

Narrative analysis help you understand organizational culture by the way ideas and narratives are communicated within an organization. It works best when planning new marketing campaigns and mulling over changes within corporate culture – it includes what customers think about an organization, how employees feel about their job remuneration and how business operations are perceived.

Agreed or not, there’s no gold standard for data analysis or the best way to perform it. You have to select the method, which you deem fit for your data and requirements, and unravel improved insights and optimize organizational goals.

 
The blog has been sourced fromwww.sisense.com/blog/5-techniques-take-data-analysis-another-level
 

Interested in a career in Data Analyst?

To learn more about Data Analyst with Advanced excel course – Enrol Now.
To learn more about Data Analyst with R Course – Enrol Now.
To learn more about Big Data Course – Enrol Now.

To learn more about Machine Learning Using Python and Spark – Enrol Now.
To learn more about Data Analyst with SAS Course – Enrol Now.
To learn more about Data Analyst with Apache Spark Course – Enrol Now.
To learn more about Data Analyst with Market Risk Analytics and Modelling Course – Enrol Now.

World’s Biggest Tech Companies 2018: A Comprehensive List

World’s Biggest Tech Companies 2018: A Comprehensive List

Talking of world’s biggest and most-valued companies, people instinctively turn their gaze to technology sector. Ever since the phenomenal dotcom boom and onset of WorldWideWeb, the tech firms have been garnering accolades owing to their huge market caps and power to disrupt conventional industries.

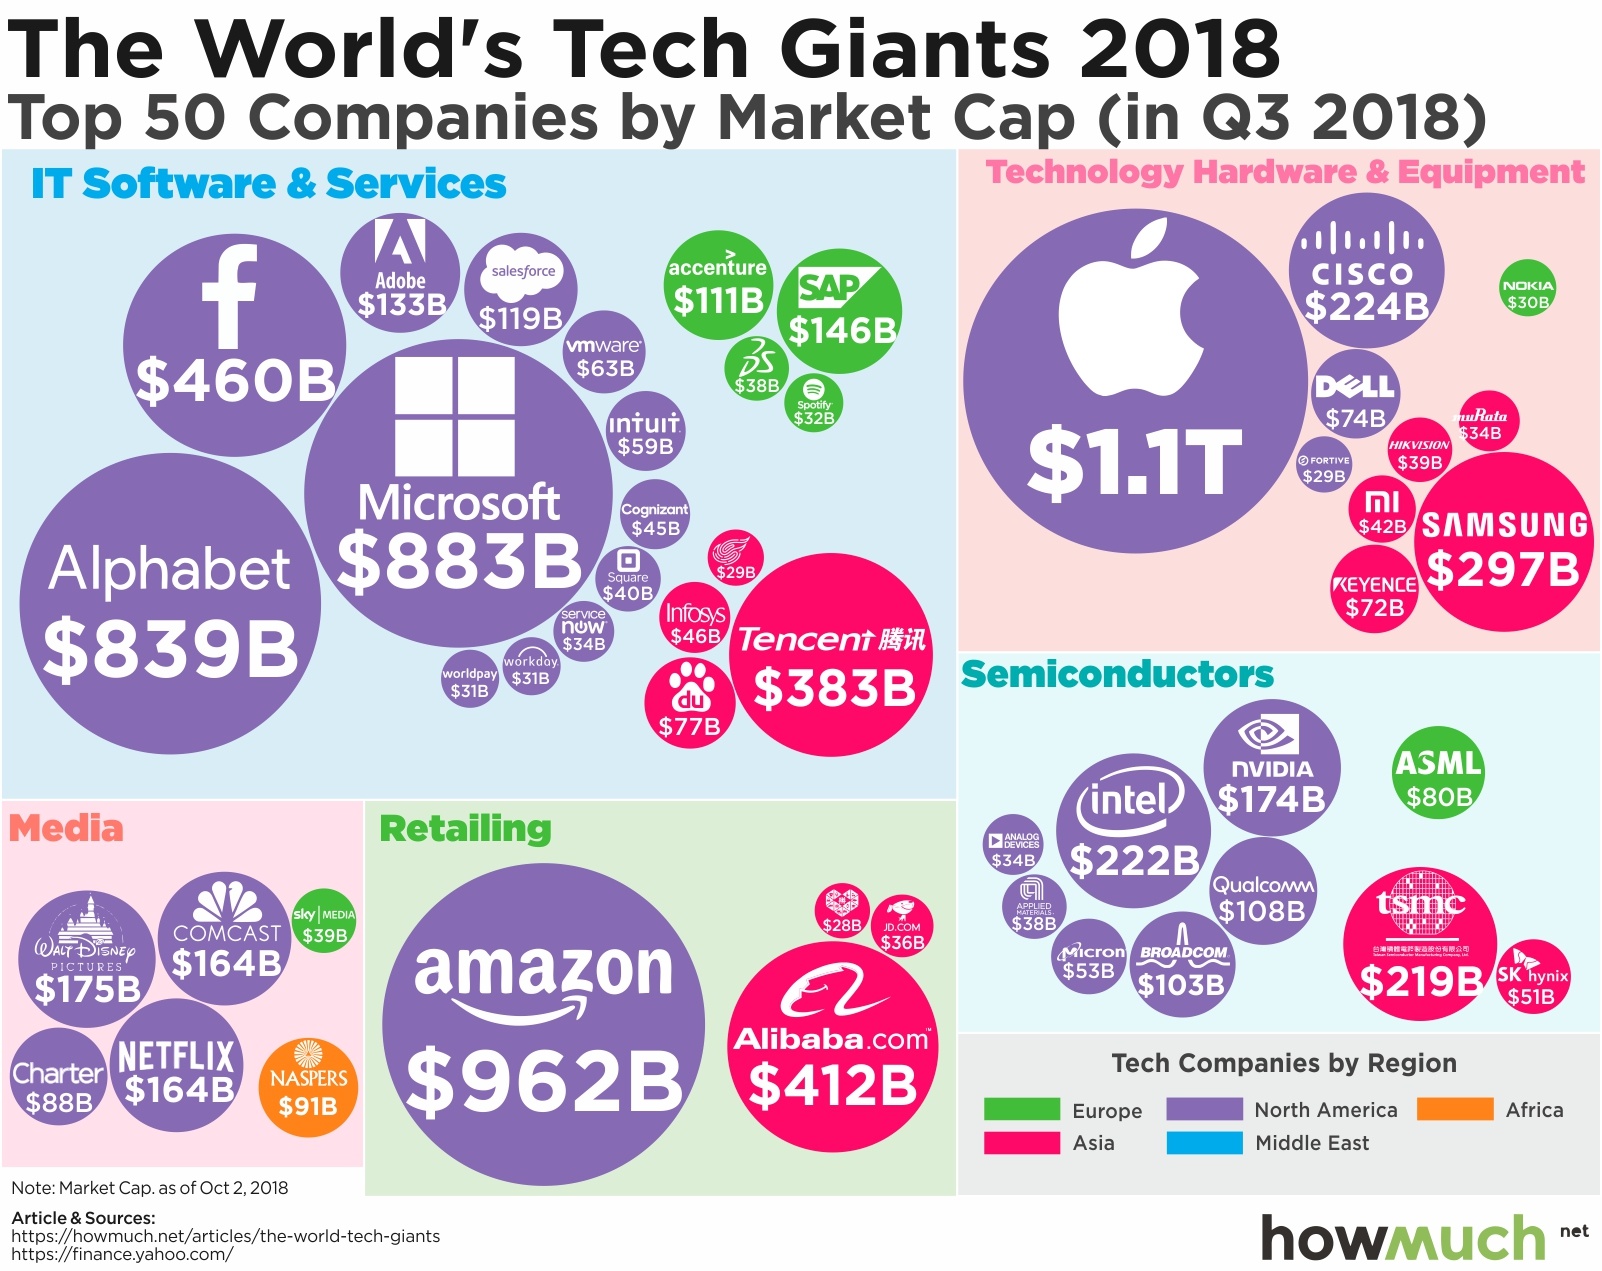
FYI: A public company’s market cap refers to market capitalization, which is a measurement of the value of its current outstanding shares. To calculate the market cap, you need to just multiply the current stock price with the outstanding number of shares. Talking about today’s market condition that would mean a lot of numbers.

To evaluate the top notch tech companies across the globe, Howmuch.net took into consideration the market cap ranking given by Forbes and split it in an unique way. Obviously, the US and China houses some of the wealthiest companies, worth hundreds of billions of dollars.

2

Below we’ve 10 most high-valued tech companies on the planet, according to their market caps as of October 2018:

  • Apple: $1.1T
  • com: $962B
  • Microsoft: $883B
  • Alphabet: $839B
  • Facebook: $460B
  • Alibaba: $412B
  • Tencent Holdings: $383B
  • Samsung Electronics: $297B
  • Cisco Systems: $224B
  • Intel: $222B

(Give credits)

“At first glance, retailing and media appear to be much more evenly distributed than they actually are,” the report indicated. “Consider how Amazon has so dominated the market that its North American competitors are so small, they don’t even make it onto the list of top 50 companies. Amazon is so big, there is literally no other company in sight.”

Key Takeaways:

  • As always, Apple tops the list of tech companies, not only as the biggest tech company but it’s also the eighth largest company in the world according to Forbes’ Global 2000 list. The company saw $247.5 billion in sales, $53 billion in profit, $367.5 billion in assets and a market cap of $927 billion for the past year.
  • The AntiTrust Regulations and growth of 5G wireless can bring forth major changes in the modern tech market, and we are eagerly waiting for such shift in focus.

As parting thoughts, we would like to say that though the current market setup has been quite steady for a while, a surge of change may soon be here. Interestingly, Chinese tech bigwig, Alibaba is mostly likely to expand its scopes and capabilities, while 5G connectivity may appear fetching. Moreover, the speculation says antitrust regulation could disrupt functionalities of some of these companies.

To stay updated about technology-related news and innovations, follow DexLab Analytics. It’s a premier institution famous for state of the art data science courses in Delhi. For more, check out their homepage: an army of data science related courses are on offer.

 
The blog has been sourced from — www.techrepublic.com/article/the-10-most-valuable-tech-companies-in-the-world
 

Interested in a career in Data Analyst?

To learn more about Data Analyst with Advanced excel course – Enrol Now.
To learn more about Data Analyst with R Course – Enrol Now.
To learn more about Big Data Course – Enrol Now.

To learn more about Machine Learning Using Python and Spark – Enrol Now.
To learn more about Data Analyst with SAS Course – Enrol Now.
To learn more about Data Analyst with Apache Spark Course – Enrol Now.
To learn more about Data Analyst with Market Risk Analytics and Modelling Course – Enrol Now.
How Data Analytics Should Be Managed In Your Company, and Who Will Lead It?

How Data Analytics Should Be Managed In Your Company, and Who Will Lead It?

In the last couple of years, data management strategies have revolutionized a lot. Previously, the data management used to come under the purview of the IT department, while data analytics was performed based on business requirements. Today, a more centralized approach is being taken uniting the roles of data management and analytics – thanks to the growing prowess of predictive analytics!

Predictive analytics has brought in a significant change – it leverages data and extracts insights to enhance revenue and customer retention. However, many companies are yet to realize the power of predictive analytics. Unfortunately, data is still siloed in IT, and several departments still depend on basic calculations done by Excel.

But, of course, on a positive note, companies are shifting focus and trying to recognize the budding, robust technology. They are adopting predictive analytics and trying to leverage big data analytics. For that, they are appointing skilled data scientists, who possess the required know-how of statistical techniques and are strong on numbers.

2

Strategizing Analytical Campaigns

An enterprise-wide strategy is the key to accomplish analytical goals and how. Remember, the strategy should be encompassing and incorporate needful laws that need to be followed, like GDPR. This signifies effective data analytics strategies begin from the top.

C-suite is a priority for any company, especially which looks forward to defining data and analytics, but each company also require a designated person, who would act as a link between C-suite and the rest of the company. This is the best way to mitigate the wrong decisions and ineffective strategies that are made in silos within the organization.

Chief Data Officers, Chief Analytics Officers and Chief Technology Officers are some of the most popular new age job designations that have come up. Eminent personalities in these fetching positions play influential roles in strategizing and executing a successful corporate-level data analytics plan. The main objective of them is to provide analytical support to the business units, determine the impact of analytical strategies and ascertain and implement innovative analytical prospects.

Defensive Vs Offensive Data Strategy

To begin, defensive strategy deals with compliance with regulations, prevention of theft and fraud detection, while offensive strategy is about supporting business achievements and strategizing ways to enhance profitability, customer retention and revenue generation.

Generally, companies following a defensive data strategy operate across industries that are heavily regulated (for example, pharmaceuticals, automobile, etc.) – no doubt, they need more control on data. Thus, a well-devised data strategy has to ensure complete data security, optimize the process of data extraction and observe regulatory compliance.

On the other hand, offensive strategy requires more tactical implementation of data. Why? Because they perform in a more customer-oriented industry. Here, the analytics have to be more real-time and their numerical value will depend on how quickly they can arrive at decisions. Hence, it becomes a priority to equip the business units with analytical tools along with data. As a result, self-service BI tools turns out to be a fair deal. They are found useful. Some of the most common self-service BI vendors are Tableau and PowerBI. They are very easy to use and deliver the promises of flexibility, efficacy and user value.  

As final remarks, the sole responsibility of managing data analytics within an organization rests on a skilled team of software engineers, data analysts and data scientists. Only together, they would be able to take the charge of building successful analytical campaigns and secure the future of the company.

For R Predictive Modelling Certification, join DexLab Analytics. It’s a premier data science training platform that offers top of the line intensive courses for all data enthusiasts. For more details, visit their homepage.


The blog has been sourced from dataconomy.com/2018/09/who-should-own-data-analytics-in-your-company-and-why


Interested in a career in Data Analyst?

To learn more about Data Analyst with Advanced excel course – Enrol Now.
To learn more about Data Analyst with R Course – Enrol Now.
To learn more about Big Data Course – Enrol Now.

To learn more about Machine Learning Using Python and Spark – Enrol Now.
To learn more about Data Analyst with SAS Course – Enrol Now.
To learn more about Data Analyst with Apache Spark Course – Enrol Now.
To learn more about Data Analyst with Market Risk Analytics and Modelling Course – Enrol Now.
Facebook and Google Have Teamed Up to Expand the Horizons of Artificial Intelligence

Facebook and Google Have Teamed Up to Expand the Horizons of Artificial Intelligence

Tech unicorns, Google and Facebook have joined hands to enhance AI experience, and take it to the next level.

Last week, the two companies revealed that quite a number of engineers are working to sync Facebook’s open source machine learning PyTorch framework with Google’s TPU, or dubbed Tensor Processing Units – the collaboration is one of its kind, and a first time where technology rivals are working on a joint project in technology.

“Today, we’re pleased to announce that engineers on Google’s TPU team are actively collaborating with core PyTorch developers to connect PyTorch to Cloud TPUs,” said Rajen Sheth, Google Cloud director of product management. “The long-term goal is to enable everyone to enjoy the simplicity and flexibility of PyTorch while benefiting from the performance, scalability, and cost-efficiency of Cloud TPUs.”

Joseph Spisak, Facebook product manager for AI added, “Engineers on Google’s Cloud TPU team are in active collaboration with our PyTorch team to enable support for PyTorch 1.0 models on this custom hardware.”

2

2016 was the year when Google first introduced its TPU to the world at the Annual Developer Conference – that year itself the search engine giant pitched the technology to different companies and researchers to support their advanced machine-learning software projects. Since then, Google has been selling access to its TPUs through its cloud computing business instead of going the conventional way of selling chips personally to customers, like Nvidia.

Over the years, AI technology, like Deep Learning have been widening its scopes and capabilities in association with tech bigwigs like Facebook and Google that have been using the robust technology to develop software applications that automatically perform intricate tasks, such as recognizing images in photos.

Since more and more companies are exploring the budding ML domain for years now, they are able to build their own AI software frameworks, mostly the coding tools that are intended to develop customized machine-learning powered software easily and effectively. Also, these companies are heard to offer incredible AI frameworks for free in open source models – the reason behind such an initiative is to popularize them amongst the coders.

For the last couple of years, Google has been on a drive to develop its TPUs to get the best with TensorFlow. Moreover, the initiative of Google to work with Facebook’s PyTorch indicates its willingness to support more than just its own AI framework. “Data scientists and machine learning engineers have a wide variety of open source tools to choose from today when it comes to developing intelligent systems,” shared Blair Hanley Frank, Principal Analyst, Information Services Group. “This announcement is a critical step to help ensure more people have access to the best hardware and software capabilities to create AI models.”

Besides Facebook and Google, Amazon and Microsoft are also expanding their AI investment through its PyTorch software.

DexLab Analytics offers top of the line machine learning training course for data enthusiasts. Their cutting edge course module on machine learning certification is one of the best in the industry – go check out their offer now!

 
The blog has been sourced from — www.dexlabanalytics.com/blog/streaming-huge-amount-of-data-with-the-best-ever-algorithm
 

Interested in a career in Data Analyst?

To learn more about Data Analyst with Advanced excel course – Enrol Now.
To learn more about Data Analyst with R Course – Enrol Now.
To learn more about Big Data Course – Enrol Now.

To learn more about Machine Learning Using Python and Spark – Enrol Now.
To learn more about Data Analyst with SAS Course – Enrol Now.
To learn more about Data Analyst with Apache Spark Course – Enrol Now.
To learn more about Data Analyst with Market Risk Analytics and Modelling Course – Enrol Now.

Predictive Analytics: The Key to Enhance the Process of Debt Collection

Predictive Analytics: The Key to Enhance the Process of Debt Collection

A wide array of industries has already engaged in some kind of predictive analytics – numerical analysis of debt collection is relatively a recent addition. Financial analysts are now found harnessing the power of predictive analytics to cull better results out for their clients, and measure the effectiveness of their strategies and collections.

Let’s see how predictive analytics is used in debt collection process:

2

Understanding Client Scoring (Risk Assessment)

Since the late 1980’s, FICO score is regarded as the golden standard for determining creditworthiness and loan application. But, however, machine learning, particularly predictive analytics can replace it, and develop an encompassing portrait of a client, taking into effect more than his mere credit history and present debts. It can also include his social media feeds and spending trajectory.

Evaluating Payment Patterns

The survival models evaluate each client’s probability of becoming a potential loss. If the account shows a continuous downward trend, then it should be regarded soon as a potential risk. Predictive analytics can help identify spending patterns, indicating the struggles of each client. A system can be developed which self-triggers whenever any unwanted pattern transpires. It could ask the client if they need any help or if they are going through a financial distress, so that it can help before the situation turns beyond repairs.

For R predictive modeling training courses, visit DexLab Analytics.

Cash Flow Predictions

Businesses are keen to know about future cash flows – what they can expect! Financial institutions are no different. Predictive analytics helps in making more appropriate predictions, especially when it comes to receivables.

Debt collector’s business models are subject to the ability to forecast the success of collection operations, and ascertaining results at the end of each month, before the billing cycle initiates. As a result, the workforce of the company is able to shift their focus from the potential payers to those who would not be able to meet their obligations. This shift in focus helps!

Better Client Relationship

Predictive analytics weave wonders; not only it has the ability to point which clients are the highest risks for your company, but also predict the best time to contact them to reap maximum results. What you need to do is just visit the logs of past conversations.

Challenges

Last, but not the least, all big data models face a common challenge – data cleaning. As it’s a process of wastage in and out, before starting with prediction, company should deal with this problem at first to construct a pipeline, for feeding in the data, clean it and use it for neural network training.

In a concluding statement, predictive analytics is the best bet for debt and revenue collection – it boosts conversion rates at the right time with the right people. If you want to study more about predictive analytics, and its varying uses in different segments of industry, enroll in R Predictive Modelling Certification training at DexLab Analytics. They provide superior knowledge-intensive training to interested individuals with added benefit of placement assistance. For more, visit their website.


The blog has been sourced fromdataconomy.com/2018/09/improving-debt-collection-with-predictive-models


Interested in a career in Data Analyst?

To learn more about Data Analyst with Advanced excel course – Enrol Now.
To learn more about Data Analyst with R Course – Enrol Now.
To learn more about Big Data Course – Enrol Now.

To learn more about Machine Learning Using Python and Spark – Enrol Now.
To learn more about Data Analyst with SAS Course – Enrol Now.
To learn more about Data Analyst with Apache Spark Course – Enrol Now.
To learn more about Data Analyst with Market Risk Analytics and Modelling Course – Enrol Now.
Most Popular Tableau Interview Questions with Answers to Learn Right Now

Most Popular Tableau Interview Questions with Answers to Learn Right Now

Tableau is dominating the business intelligence industry. It’s a powerful and fastest growing data viz tool used to simplify complicated raw data. It helps break the data into easy-to comprehend formats.

In this blog, we’ve compiled down the most popular Tableau Interview questions with their answers. The sample questions are framed by seasoned experts, who have encompassing knowledge on the subject matter – they have taken needed care and effort to help you get the correct answers. This will help you on your endeavor of job hunting!

2

Mention top 5 main products offered by Tableau.

Tableau specializes in these 5 products – Tableau Server, Tableau Desktop, Tableau Reader, Tableau Online and Tableau Public.

Name the latest version of Tableau Desktop.

Tableau Desktop Version 10.5.

Explain data visualization, and the use of Tableau.

Data visualization is an umbrella term referring to a set of well-defined techniques used for data communication through proper presentation and graphics (such as bars, diagrams, lines or points).

Tableau helps analyze data in an on-premise database, a cloud application, a normal database, a data warehouse or an Excel file – create interesting representations of data and share with your colleagues, friends and clients. You can also use Tableau to include other data too, and help keep your data up-to-date regularly.

Define filters. How many types of filters exist in Tableau?

In Tableau, there are several ways to filter and restrict your data – the outcome may be oriented towards improving performance, helping viewer get the right information or for highlighting something critical.

Three types of filters are as follows:

  • Context Filter
  • Quick Filter
  • Datasource Filter

Do you know how to remove all options from a Tableau auto-filter?

  1. Right click filter
  2. Customize
  3. Uncheck show all option

Why Tableau Extract is better over live connection?

Tableau Extract is easy to use, anywhere, anytime. For this, you don’t need any connection and can construct your own visualizations without connecting yourself with any database.

How many tables can you join in Tableau at the most?

Up to 32 tables can be joined in Tableau, but not more than that.

Define dimensions and facts.

To put simply, dimensions denotes text columns, while facts refer to measures, meaning numerical values.

Examples of dimensions – product name, city

Examples of facts – profit or sales

Highlight the difference between heat map and tree map.

Well, a heat map is an ideal method for comparing groups using size and color. Here, you can easily compare two distinct measures. On the other hand, a tree map is one of the most robust visualization, especially for graphically representing hierarchical data. 

For more in-depth knowledge on Tableau and its related applications, we recommend good Tableau training institutes in Delhi. Tableau certification Delhi is gaining a lot of prominence amidst the data analytics circuit. Hope this helps build a fine career for you!


The blog has been sourced fromintellipaat.com/interview-question/tableau-interview-questions


Interested in a career in Data Analyst?

To learn more about Data Analyst with Advanced excel course – Enrol Now.
To learn more about Data Analyst with R Course – Enrol Now.
To learn more about Big Data Course – Enrol Now.

To learn more about Machine Learning Using Python and Spark – Enrol Now.
To learn more about Data Analyst with SAS Course – Enrol Now.
To learn more about Data Analyst with Apache Spark Course – Enrol Now.
To learn more about Data Analyst with Market Risk Analytics and Modelling Course – Enrol Now.

Most Popular Big Data Hadoop Interview Questions 2018 (with answers)

Most Popular Big Data Hadoop Interview Questions 2018 (with answers)

Hadoop is at the bull’s eye of a mushrooming ecosystem of big data technologies – its open source, and widely used for advanced analytics pursuits, such as predictive analytics, machine learning and data mining, amongst others. Hadoop is defined as a powerful open source distributed processing framework that’s ideal for processing of data and storing data for big data applications, running across clustered systems.

Below, we’ve put together a comprehensive list of interview questions with answers on Big Data Hadoop, focusing on the various aspects of the in-demand skill. For more, take up our intensive big data hadoop training in Gurgaon.   

What is the role of big data in enhancing business revenue?

Big data analysis aids businesses in increasing their revenues and hitting notes of success. To explain further, let’s take an example, Walmart, one of the top notch retailers in the world uses big data analytics to increase the sales figure through improved predictive analytics tool, better customized recommendations and new set of products curated observing customer preferences and latest trends. Interestingly, it observed up to 15% increase in online sales for $1 billion in incremental revenue. Like Walmart, LinkedIn, JPMorgan Chase, Facebook, Twitter, Bank of America, Pandora, etc. follow suit.

Mention some companies that use Big Data Hadoop.

  • Yahoo
  • Netflix
  • Adobe
  • Spotify
  • Twitter
  • Amazon
  • Facebook
  • Hulu
  • eBay
  • Rubikloud

Highlight the main components of a Hadoop application.

Hadoop has a wide set of technologies that offers unique advantages for solving crucial challenges. Hadoop core components are given below:

  • Hadoop Common
  • HDFS
  • Hadoop MapReduce
  • YARN
  • Pig
  • Hive
  • HBase
  • Apache Flume, Chukwa, Sqoop
  • Thrift, Avaro
  • Ambari, Zookeeper

What do you mean by Hadoop streaming?

Hadoop streaming is an additional utility function that accompanies Hadoop distribution. Hadoop distribution includes a standard application programming interface, which is used to write Map and Reduce jobs in a number of languages, such as Python, Ruby, Perl, etc. Hadoop streaming is this entire process – here, users can develop and run jobs with any type of shell scripts or executable as the Mappers or Reducers.

Specify the port numbers for NameNode, Task Tracker and Job Tracker.

  • NameNode 50070
  • Job Tracker 50030
  • Task Tracker 50060

What are the four V’S in Big Data?

  • Volume – Scale of data
  • Velocity – Analysis of streaming data
  • Variety – Different forms of data
  • Veracity – Uncertainty of data

2

Distinguish between structured and unstructured data.

Structured data is referred as the data that can be stored in conventional database systems in the form of rows and columns – data, which is stored partially in traditional database systems, is known as semi-structured data – raw or unorganized data is generally termed as unstructured data.

Example of structured data – online purchase transactions

Example of semi-structured data – data in XML records

Example of unstructured data – Facebook & Twitter updates, web logs, reviews

Hope you found these Hadoop interview questions useful; to gain further insights on Big Data Hadoop, please enroll for our big data hadoop training courses – they are adequate and developed considering latest industry demands. 


The blog has been sourced fromwww.dezyre.com/article/top-100-hadoop-interview-questions-and-answers-2018/159


Interested in a career in Data Analyst?

To learn more about Data Analyst with Advanced excel course – Enrol Now.
To learn more about Data Analyst with R Course – Enrol Now.
To learn more about Big Data Course – Enrol Now.

To learn more about Machine Learning Using Python and Spark – Enrol Now.
To learn more about Data Analyst with SAS Course – Enrol Now.
To learn more about Data Analyst with Apache Spark Course – Enrol Now.
To learn more about Data Analyst with Market Risk Analytics and Modelling Course – Enrol Now.

Call us to know more