Dexlab, Author at DexLab Analytics | Big Data Hadoop SAS R Analytics Predictive Modeling & Excel VBA - Page 12 of 80

Enhancing Food Safety with IoT and Big Data Analytics: Here’s how

Enhancing Food Safety with IoT and Big Data Analytics: Here’s how

We’ve all gone through it – sudden publicity regarding a particular food item being ‘’unsafe and hazardous’’ that sends us rummaging through our kitchen to discard those products. But in this age where everything goes through multiple inspections, how do these errors happen?

The truth is tracking the source of contaminated food and isolating compromised items isn’t all that efficient. This is where big data analytics and IoT can play game-changing roles. These two revolutionary techs have disrupted many industries for good, and promise to positively transform the food sector too.

 IoT for Tracing Shipments

IoT in the form of RFID tags and barcodes are popularly used in the food industry to track shipped food products from source till destination, ensuring retailers acquire the ordered products safely and fulfill consumer demand. However, recently advanced IoT sensors are being used to obtain more detailed information about food products being transported all over the world. These sensors can greatly enhance food safety – they have the capability of identifying minute dust particles and keeping track of environmental conditions like temperature. For example, these sensors can be used for monitoring temperature of frozen chicken being shipped between China and U.S., as above-freezing temperatures will jeopardize their safety. Some sensors even relay data in real-time, making sure optimal conditions affirmed by safety guidelines are always maintained.

2

IoT Helping Investigations

Human investigators aren’t always capable of detecting the source of contamination following the discovery of fouled food items. It isn’t humanly possible to locate all the touch points in our modern and highly complex food processes. But IoT technology, with its superior tracking and supervising capabilities, can assist these investigations by spotting the exact point where the contamination occurred.

Addition of Big Data

A side benefit of IoT is the addition of a great deal of data that lay unused in cyberspace. Once all this data is assembled and analyzed, it will help track failure points, identify patterns in food-safety failures and even predict the conditions that cause food spoilage in future.

Assistance for Cultivators

Using big data related to weather and analyzing historical patterns, many tech companies are recognizing potential natural disasters beforehand. This can hugely benefit crop producers. For example, certain environmental conditions can boost the growth of unwanted pests that makes the produce unsafe for consumption. This information can help take necessary preventive measures.

Genetic Indexing

With the help of big data, correlation between bacteria RNA and DNA can be identified, resulting in genetic indexing for particular foods. Firstly, with the help of this information, food inspectors can spot harmful bacteria in food items. After this, IoT can be employed to track down the source. Once the starting point has been identified, more data can be obtained from there about the conditions that foster bacterial growth, allowing such circumstances to be avoided in future.

Improving Storage Safety with IoT and Big Data

Infestation with rats and other unwanted animals is a common problem in food storage facilities. But real-time data coming from IoT sensors combined with historical data on infestations now enables storage units to improve their conditions and protect the environment from such infestations.

Together IoT and Big Data can Promote Better Collaboration

According to WHO estimates, food-borne illnesses affect approximately 600 million people worldwide, out of them around 420,000 people pass away. To improve this condition, everyone working in the food industry must work collaboratively. And the ability of access big data and take help of an advanced technology like IoT will greatly assist this collaboration.

Every industry is going through an overhaul because of big data. In today’s world, big data education offers great power to all professionals. That’s why you must consider the top-grade big data courses in Delhi. Practical-based courses are delivered by industry experts and each student is given individual attention based on his/her level – this is what makes DexLab Analytics a leading Big Data Hadoop institute in Delhi NCR.


Reference: www.forbes.com/sites/andrewarnold/2019/02/20/how-iot-and-big-data-analytics-can-make-our-food-safer/#785e1d3d1d45


Interested in a career in Data Analyst?

To learn more about Data Analyst with Advanced excel course – Enrol Now.
To learn more about Data Analyst with R Course – Enrol Now.
To learn more about Big Data Course – Enrol Now.

To learn more about Machine Learning Using Python and Spark – Enrol Now.
To learn more about Data Analyst with SAS Course – Enrol Now.
To learn more about Data Analyst with Apache Spark Course – Enrol Now.
To learn more about Data Analyst with Market Risk Analytics and Modelling Course – Enrol Now.

Big Data and Its Influence on Netflix

Big Data and Its Influence on Netflix

With resonating hits, like Bird Box and Bandersnatch, Netflix is revolutionizing the entertainment industry – all with the power of big data and predictive analytics.

Big Data Analytics is the heart and soul of Netflix, says the Wall Street Journal. Not only the company relies on big data to optimize its video streaming quality but also to tap into customer entertainment preferences and content viewing pattern. This eventually helps Netflix target its subscribers with content and offers on shows they prefer watching.

2

Committed to Data, Particularly User Data

With nearly 130 million subscribers, Netflix needs to collect, manage and analyze colossal amounts of data – all for the sole purpose of enhancing user experience. Since its inception days of being a mere DVD distributor, Netflix has always been obsessed about user data. Even then, the company had an adequate reservoir of user data and a robust recommendation system. However, it was only after the launch of its incredible streaming service that Netflix took the game of data analytics to an altogether different level. 

In fact, Netflix invested $1 million in a cutting-edge developer company for coming up with an algorithm that increased the accuracy of their already-existing recommendation engine by almost 10%. For this, Netflix can now save $1 billion annually from customer retention.

Netflix Already Knows What You Going to Watch Next

Yes, Netflix is a powerhouse of user behavior information. The content streaming giant knows your viewing habits better than you – courtesy pure statistics, preferably predictive analytics. This is one of the major strengths of Netflix – the way it analyzes data, adjusts algorithms and optimizes video streaming experience is simply incredible.

However, nothing great comes easy. Close monitoring of user viewing habits is essential. Right from how much time each user spends on picking movies to the number of times he/she watches a particular show, each and every data is extremely important. Moreover, conventional calculus helps Netflix in understanding its user behavior trends and necessarily provides them with appropriate customized content.

As closing thoughts, Netflix is a clear-cut answer to how technological advancement has influenced human creativity beyond levels. Powered by big data and predictive analytics, Netflix has surely debunked several lame theories on content preference and customer viewing habits. So, if you are interested in big data Hadoop training in Delhi, this is the time to act upon. With DexLab Analytics by your side, you can definitely give wings to your dreams, specifically data dreams. 

 
The blog has been sourced fromwww.muvi.com/blogs/deciphering-the-unstoppable-netflix-and-the-role-of-big-data.html
 

Interested in a career in Data Analyst?

To learn more about Data Analyst with Advanced excel course – Enrol Now.
To learn more about Data Analyst with R Course – Enrol Now.
To learn more about Big Data Course – Enrol Now.

To learn more about Machine Learning Using Python and Spark – Enrol Now.
To learn more about Data Analyst with SAS Course – Enrol Now.
To learn more about Data Analyst with Apache Spark Course – Enrol Now.
To learn more about Data Analyst with Market Risk Analytics and Modelling Course – Enrol Now.

AI Jobs: What the Future Holds?

AI Jobs: What the Future Holds?

Technological revolutions have always been challenging, especially how they influence and impact working landscapes. They either bring on an unforeseen crisis or prove a boon; however, fortunately, the latter has always been the case, starting from the innovation of steam engines to Turing machine to computers and now machine learning and artificial intelligence.

The crux of the matter lies in persistence, perseverance and patience, needed to make these high-end technologies work in the desired way and transform the resources into meaningful insights tapping the unrealized opportunities. Talking of which, we are here to discuss the growth and expansion of AI-related job scopes in the workplace, which is expected to generate around 58 million new jobs in the next couple of years. Are you ready?

Data Analysts

Internet of Things, Machine Learning, Data Analytics and Image Analysis are the IT technologies of 2019. An exponential increase in the use of these technologies is to be expected. Humongous volumes of data are going to be leveraged in the next few years, but for that, superior handling and management skill is a pre-requisite. Only expert consultants adept at hoarding, interpreting and examining data in a meaningful manner can strategically fulfill business goals and enhance productivity.

Interested in Machine Learning course in India? Reach us at DexLab Analytics.

IT Trainers

With automation and machine learning becoming mainstream, there is going to be a significant rise in the number of IT Trainer jobs. Businesses have to appoint these professionals for the purpose of two-way training, including human intelligence as well as machines. On one side, they will have to train AI devices to grasp a better understanding of human minds, while, on the other hand, the objective will be training employees so as to utilize the power of AI effectively subject to their job responsibilities and subject profiles. Likewise, there is going to be a gleaming need for machine learning developers and AI researchers who are equipped to instill human-like intelligence and intuition into the machines – making them more efficient, more powerful.

Man-Machine Coordinators

Agreed or not, the interaction between automated bots and human brainpower will lead to immense chaos – if not managed properly. Organizations have great hope in this man-machine partnership, and to ensure they work in sync with each other, business will seek experts, who can devise incredible roadmaps to tap newbie opportunities. The objective of this job profile is to design and manage an interaction system through which machines and humans can mutually collaborate and communicate their abilities and intentions.

Data Science Machine Learning Certification

Security Analysts

Security is crucial. The moment the world switched from offline to online, a whole lot of new set of crimes and frauds came into notice. To protect and safeguard confidential information and high-profile business identities, companies are appointing skilled professionals who are well-trained in tracking, protecting and recovering AI systems and devices from malicious cyber intrusions and attacks. Thus, skill and expertise in information security, networking and guaranteeing privacy is well-appreciated.

No wonder, a good number of jobs are going to dissolve with AI, but also, an ocean of new job opportunities will flow in with time. You just have to hone your skills and for that, we have artificial intelligence certification in Delhi NCR. In situations like this, these kinds of in-demand skill-training courses are your best bet.


The blog has been sourced from  www.financialexpress.com/industry/technology/artificial-intelligence-are-you-ready-for-ocean-of-new-jobs-as-many-old-ones-will-vanish/1483437


.

Big Data Enhances Remote IT Support: Here’s How

Big Data Enhances Remote IT Support: Here’s How

Big data is the backbone of modern businesses. All their decisions are data driven. Firstly, information is aggregated from various sources, like customer viewing pattern and purchasing behavior. After this, the data is analyzed and then actionable insights are generated. Nowadays, most companies rely on some type of business intelligence tool. All in all, information collection is increasing exponentially.

However, in many cases the desire for information has gone too far. The recent scandal involving Facebook and Cambridge Analytica stands as an example. It has left people very insecure about their online activities. Fears regarding violation of privacy are rising; people are worried that their data is being monitored constantly and even used without their awareness. Naturally, everyone is pushing for improved data protection. And we’re seeing the results too – General Data Protection Regulation (GDPR) in EU and the toughening of US Data Regulations is only the beginning.

Although data organization and compliance have always been the foundation of IT’s sphere of activity, still businesses are lagging behind in utilizing big data in remote IT support. They have started using big data to enhance their services only very recently.

2

Advantages of data-directed remote IT support

The IT landscape has undergone a drastic change owing to the rapid advancement of technology. The rate at which devices and software packages are multiplying, Desktop Management is turning out to be a nightmarish task. Big data can help IT departments manage this situation better.

Managing complexity and IT compliance

The key reasons behind maximum number of data breaches are user errors and missing patches. Big data is very useful in verifying if endpoints are on conformity with IT policies, which in turn can help prevent such vulnerabilities and keep a check on networks.

Troubleshooting and minimizing time-to-resolution

Data can be utilized to develop a holistic picture of network endpoints, ensuring the helpdesk process is more competent. By offering deeper insight into networks, big data allows technicians to locate root causes behind ongoing issues instead of focusing on recurring symptoms. The direct effect of this is an increase in first-call-resolution. It also helps technicians to better diagnose user problems.

Better end-user experience

Having in-depth knowledge about all the devices of a network means that technicians don’t have to control an end-user’s system to solve the issue. Also, this enables the user to continue working uninterrupted while the technician takes care of the problem from behind-the-scene. Thus, IT can offer a remedy even before the user recognizes there’s a problem. For example, a team engaged in collection of network data may notice that few devices need to be updated, which they can perform remotely.

Better personalization without damaging control

IT teams have always found it difficult to manage provisioning models, like BYOD (bring your own device) and COPE (corporate owned, personally enabled). But with the help of big data, IT teams can divide end users based on their job roles and also support the various provisioning models without compromising with control. Moreover, they constantly receive feedback, allowing them keep to a check on any form of abuse, unwanted activities and any changes in the configuration of a system.

Concluding:

In short, the organization as a whole benefits from data-directed remote support. IT departments can improve on their delivery service as well as enhance end-user experience. It gives users more flexibility, but doesn’t hamper security of IT teams. Hence, in this age of digital revolution, data-driven remote support can be a powerful weapon to improve a company’s performance.

Knowing how to handle big data is the key to success in all fields of work. That being said, candidates seeking excellent Big Data Hadoop training in Gurgaon should get in touch with DexLab Analytics right away! This big data training center in Delhi NCR offer courses with comprehensive syllabus focused on practical training and delivered by professionals with excellent domain experience.

 
Reference: https://channels.theinnovationenterprise.com/articles/how-big-data-is-improving-remote-it-support
 

Interested in a career in Data Analyst?

To learn more about Data Analyst with Advanced excel course – Enrol Now.
To learn more about Data Analyst with R Course – Enrol Now.
To learn more about Big Data Course – Enrol Now.

To learn more about Machine Learning Using Python and Spark – Enrol Now.
To learn more about Data Analyst with SAS Course – Enrol Now.
To learn more about Data Analyst with Apache Spark Course – Enrol Now.
To learn more about Data Analyst with Market Risk Analytics and Modelling Course – Enrol Now.

Big Data and Its Use in the Supply Chain

Big Data and Its Use in the Supply Chain

Data is indispensable, especially for modern business houses. Every day, more and more businesses are embracing digital technology and producing massive piles of data within their supply chain networks. But of course, data without the proper tools is useless; the emergence of big data revolution has made it essential for business honchos to invest in robust technologies that facilitate big data analytics, and for good reasons.

Quality Vs Quantity

The overwhelming volumes of data exceed the ability to analyze that data in a majority of organizations. This is why many supply chains find it difficult to gather and make sense of the voluptuous amount of information available across multiple sources, processes and siloed systems. As a result, they struggle with reduced visibility into the processes and enhanced exposure to cost disruptions and risk.

To tackle such a situation, supply chains need to adopt comprehensive advanced analytics, employing cognitive technologies, which ensure improved visibility throughout their enterprises. An initiative like this will win these enterprises a competitive edge over those who don’t.

2

Predictive Analytics

 A striking combination of AI, location intelligence and machine learning is wreaking havoc in the data analytics industry. It is helping organizations collect, store and analyze huge volumes of data and run cutting edge analytics programs. One of the finest examples is found in drone imagery across seagrass sites.

Thanks to predictive analytics and spatial analysis, professionals can now realize their expected revenue goals and costs from a retail location that is yet to come up. Subject to their business objectives, consultants can even observe and compare numerous potential retail sites, decrypting their expected sales and ascertain the best possible location. Also, location intelligence helps evaluate data, regarding demographics, proximity to other identical stores, traffic patterns and more, and determine the best location of the new proposed site.

The Future of Supply Chain

Talking from a logistic point of view, AI tools are phenomenal – IoT sensors are being ingested with raw data with their aid and then these sensors are combined with location intelligence to formulate new types of services that actually help meet increasing customer demands and expectations. To prove this, we have a whip-smart AI program, which can easily pinpoint the impassable roads by using hundreds and thousands of GPS points traceable from an organization’s pool of delivery vans. As soon as this data is updated, route planners along with the drivers can definitely avoid the immoderate missteps leading to better efficiency and performance of the company.

Moreover, many logistics companies are today better equipped to develop interesting 3D Models highlighting their assets and operations to run better simulations and carry a 360-degree analysis. These kinds of models are of high importance in the domain of supply chains. After all, it is here that you have to deal with the intricate interplay of processes and assets.

Conclusion

 Since the advent of digital transformation, organizations face the growing urge to derive even more from their big data. As a result, they end up investing more on advanced analytics, local intelligence and AI across several supply chain verticals. They make such strategic investments to deliver efficient service across the supply chains, triggering higher productivity and better customer experience.

With a big data training center in Delhi NCR, DexLab Analytics is a premier institution specializing in in-demand skill training courses. Their industry-relevant big data courses are perfect for data enthusiasts.

 
The blog has been sourced from ―  www.forbes.com/sites/yasamankazemi/2019/01/29/ai-big-data-advanced-analytics-in-the-supply-chain/#73294afd244f
 

Interested in a career in Data Analyst?

To learn more about Data Analyst with Advanced excel course – Enrol Now.
To learn more about Data Analyst with R Course – Enrol Now.
To learn more about Big Data Course – Enrol Now.

To learn more about Machine Learning Using Python and Spark – Enrol Now.
To learn more about Data Analyst with SAS Course – Enrol Now.
To learn more about Data Analyst with Apache Spark Course – Enrol Now.
To learn more about Data Analyst with Market Risk Analytics and Modelling Course – Enrol Now.
Big Data to Cure Alzheimer’s Disease

Big Data to Cure Alzheimer’s Disease

Almost 44 million people across the globe suffer from Alzheimer’s disease. The cost of the treatment amounts to approximately one percent of the global GDP. Despite cutting-edge developments in medicine and robust technology upgrades, prior detection of neurodegenerative disorder, such as Alzheimer’s disease remains an upfront challenge. However, a breed of Indian researchers has assayed to apply big data analytics to look for early signs of the Alzheimer’s in the patients.

The whip-smart researchers from the NBRC (National Brain Research Centre), Manesar have come up with a fierce big data analytics framework that will implement non-invasive imaging and other test data to detect diagnostic biomarkers in the early stages of Alzheimer’s.

The Hadoop-powered data framework integrates data from brain scans in the format of non-invasive tests – magnetic resonance spectroscopy (MRS), magnetic resonance imaging (MRI) and neuropsychological test results – by employing machine learning, data mining and statistical modeling algorithms, respectively.

2

The framework is designed to address the big three Vs – Variety, Volume and Velocity. The brain scans conducted using MRS or MRI yields vast amounts of data that is impossible to study manually or analyze data of multiple patients to determine if any pattern is emerging. As a result, machine learning is the key. It boosts the process, says Dr Pravat Kumar Mandal, a chief scientist of the research team.

To know more about the machine learning course in India, follow DexLab Analytics. This premier institute also excels in offering state of the art big data courses in Delhi – take a look at their course itinerary and decide for yourself.

The researchers are found using data about diverse aspects of the brain – neurochemical, structural and behavioural – accumulated through MRS, MRI and neuropsychological mediums. These attributes are ascertained and classified into collectives for clear diagnosis by doctors and pathologists. The latest framework is regarded as a multi-modalities-based decision framework for early detection of Alzheimer’s, clinicians have noted in their research paper published in journal Frontiers in Neurology. The project has been termed BHARAT and has been dealing with the brain scans of Indians.

The new framework integrates unstructured and structured data, processing, storage, and possesses the ability to analyze volumes and volumes of complex data. For that, it leverages the skills of parallel computing, data organization, scalable data processing and distributed storage techniques, besides machine learning. Its multi-modal nature helps in classifying between healthy old patients with mild cognitive impairment and those suffering from Alzheimer’s.

Other such big data tools for early diagnostics are only based on MRI images of patients. Our model incorporates neurochemical-like antioxidant glutathione depletion analysis from brain hippocampal regions. This data is extremely sensitive and specific. This makes our framework close to the disease process and presents a realistic approach,” says Dr Mandal.

As endnotes, the research team comprises of Dr Mandal, Dr Deepika Shukla, Ankita Sharma and Tripti Goel, and the research is supported by the adept Ministry of Department of Science and Technology. The forecast predicts the number of patients diagnosed with Alzheimer is expected to cross 115 million-mark by 2050. Soon, this degenerative neurological disease will pose a huge burden on the economies of various countries; hence it’s of paramount importance to address the issue now and in the best way possible.


The blog has been sourced from www.thehindubusinessline.com/news/science/big-data-may-help-get-new-clues-to-alzheimers/article26111803.ece


Interested in a career in Data Analyst?

To learn more about Data Analyst with Advanced excel course – Enrol Now.
To learn more about Data Analyst with R Course – Enrol Now.
To learn more about Big Data Course – Enrol Now.

To learn more about Machine Learning Using Python and Spark – Enrol Now.
To learn more about Data Analyst with SAS Course – Enrol Now.
To learn more about Data Analyst with Apache Spark Course – Enrol Now.
To learn more about Data Analyst with Market Risk Analytics and Modelling Course – Enrol Now.
A Beginner’s Guide to Deep Learning: Exploring the Basics

A Beginner’s Guide to Deep Learning: Exploring the Basics

Over the last couple of years, no other part of data science has made progress like Deep Learning has. From self-driving cars to scientific research, deep learning has been the game-changer in almost every innovation made. Day by day, its influence on our way of life is getting stronger!

Deep learning is a vast and complex field having numerous sections. It takes several months of consistent effort to master the basics before delving deeper into the subject. And a thorough understanding of fundamental concepts of calculus and algebra is essential for getting started with deep learning education.

This article discusses the basics of deep learning for newbies.

Machine Leaning Basics

One must be thorough with the basics of machine learning, which includes reinforced, supervised and unsupervised learning, before starting off your deep learning education. Statistical techniques, like linear regression and logistic regression, are greatly needed in this field.

Deep Learning Introduction

First of all, you need to know the various deep learning frameworks. Deep Learning algorithms draw inspiration from artificial neural networks. While there are many free online courses, a professional course from a reputed deep learning training institute is the ideal starting point for beginners. Additionally, you can follow relevant eBooks, like the Neural Networks and Deep Learning PDF by Michael Nielson.

Understanding Neural Networks

Neural networks have a layered outlay and their functioning resembles the neurons of human brain. Neural networks are made up of an input layer, an output layer and a hidden layer, and produce output after receiving an input – just like human mind works. You need to be familiar with techniques of handling and pre-processing data, regularization methods, data augmentation, hyperparameter technique, etc. These functions of artificial neural network are widely employed in deep learning, helping tasks like image and speech recognition.

Data Science Machine Learning Certification

Convolution Neural Network Basics

An important role in deep learning is played by Convolution Neural Network, which is profusely used in object detections, facial recognition, image recognition and classifications, etc. In deep learning, CNN models work by passing the input image through a string of convoluted layers before classifying it with probabilistic values.

Knowing Sequence Models

If you want to go deeper into deep learning, it is crucial to know how to develop models such as Recurrent Neural Networks (RNNs), and make use of alternatives, like Long Short Term Memory (LSTMs) and Gated Recurrent Unit (GRU). Working with audio applications and music synthesis becomes easier when you understand these models.

Unsupervised Deep Learning

A complex topic, but learning it helps crack otherwise unsolvable problems. Problems that remain unclear even after applying supervised learning methods like biasing can be explained with unsupervised deep learning. One popular algorithm of unsupervised deep learning is Autoencoder neural network.

Know Natural Language Processing

NPL deals with understanding human speech and has many benefits.  With the help of computational algorithms, NPL analyzes and represents human language. It can also be employed in dialogue generation, machine translation, etc.

Deep Reinforcement Learning

Deep reinforcement learning has immense potential in deep learning. Reinforcement learning algorithms united with deep learning created AlphaGo, which was successful in defeating the strongest Go players!

Theory isn’t enough; you must implement your deep learning knowledge. And to do that properly, you must be able to use Python.

There’s no need to panic if Python looks like Hebrew at the moment! DexLab Analytics is here to offer expert guidance by skilled industry experts. We offer comprehensive and industry-driven deep learning certification in Gurgaon. You can also check our popular Python certification courses.

 
Reference: https://www.analyticsindiamag.com/the-best-resources-for-learning-deep-learning-for-beginners/


.

Know All about Usage-Driven Grouping of Programming Languages Used in Data Science

Know All about Usage-Driven Grouping of Programming Languages Used in Data Science

Programming skills are indispensable for data science professionals. The main job of machine learning engineers and data scientists is drawing insights from data, and their expertise in programming languages enable them to do this crucial task properly. Research has shown that professionals of the data science field typically work with three languages simultaneously. So, which ones are the most popular? Are some languages more likely to be used together?

Recent studies explain that certain programming languages are used jointly besides other programming languages that are used independently. With the survey data collected from Kaggle’s 2018 Machine Learning and Data Science study, usage patterns of over 18,000 data science experts working with 16 programming languages were analyzed. The research revealed that these languages can actually be categorized into smaller sets, resulting in 5 main groupings. The nature of the groupings is indicative of specific roles or applications that individual groups support, like analytics, front-end work and general-purpose tasks.

2

Principal Component Analysis for Dimension Reduction

In this article, we will explain how Bob E. Hayes, PhD holder, scientist, blogger and data science writer has used principal component analysis, a type of data reduction method, to categorize 16 different programming languages. Herein, the relationship among various languages is inspected before putting them in particular groups. Basically, principal component analysis looks into statistical associations like covariance within a large collection of variables, and then justifies these correlations with the help of a few variables, called components.

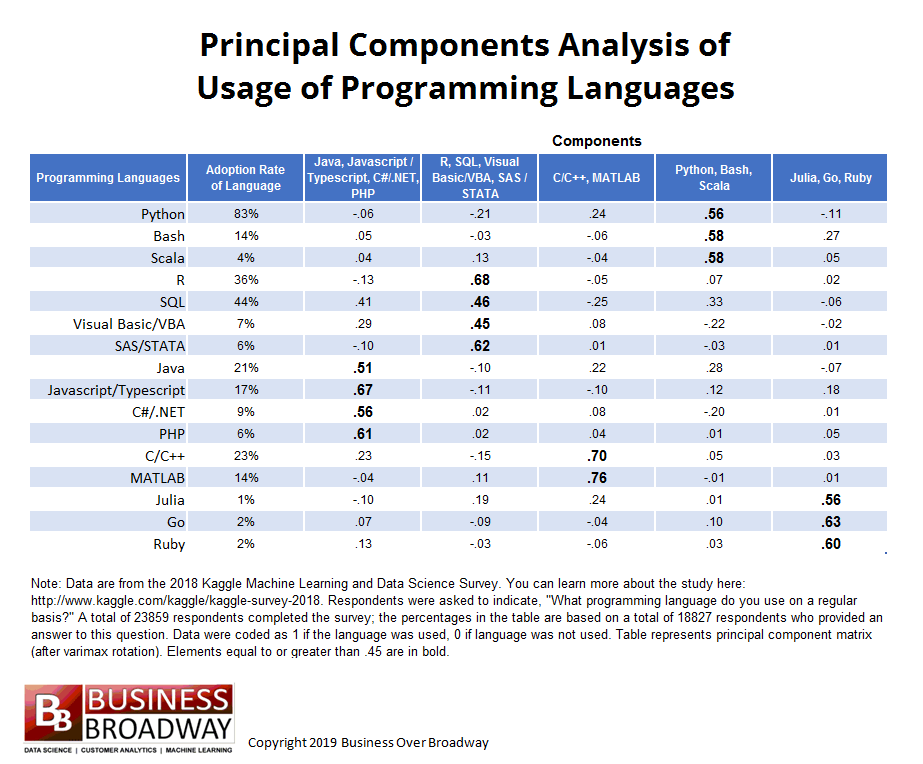
Principal component matrix presents the results of this analysis. The matrix is an nXm table, where:

n= total no. of original variables, which in this case are the number of programming languages

m= number of main components

The strength of relationship between each language and underlying components is represented by the elements of the matrix. Overall, the principal component analysis of programming language usage gives us two important insights:

  • How many underlying components (groupings of programming languages) describe the preliminary set of languages
  • The languages that go best with each programming language grouping

Result of Principal Component Analysis:

The nature of this analysis is exploratory, meaning no pre-defined structure was imposed on the data. The result was primarily driven by the type of relationship shared by the 16 languages. The aim was to explain the relationships with as less components as possible. In addition, few rules of thumb were used to establish the number of components. One was to find the number of eigen values with value greater than 1 – that number determines the number of components. Another method is to identify the breaking point in the scree plot, which is a plot of the 16 eigen values.

businessoverbroadway.com


5-factor solution was chosen to describe the relationships. This is owing to two reasons – firstly, 5 eigen values were greater than one and secondly, the scree plot showed a breaking point around 6th eigen value.

Following are two key interpretations from the principal component matrix:

  • Values greater than equal to .45 have been made bold
  • The headings of different components are named on the basis of tools that loaded highly on that component. For example, component 4 has been labeled as Python, Bash, Scala because these languages loaded highest on this component, implying respondents are likely to use Bash and Scala if they work with Python. Other 4 components were labeled in a similar manner.

Groupings of Programming Languages

The given data set is appropriately described by 5 tool grouping. Below are given 5 groupings, including the particular languages that fall within the group, meaning they are likely to be used together.

  1. Java, Javascript/Typescript, C#/.NET, PHP
  2. R, SQL, Visual Basic/VBA, SAS/STATA
  3. C/C++, MATLAB
  4. Python, Bash, Scala
  5. Julia, Go, Ruby

One programming language didn’t properly load into any of the components: SQL. However, SQL is used moderately with three programming languages, namely Java (component 1), R (component 2) and Python (component 4).

It is further understood that the groupings are determined by the functionality of different languages in the group. General-purpose programming languages, Python, Scala and Bash, got grouped under a single component, whereas languages used for analytical studies, like R and the other languages under comp. 2, got grouped together. Web applications and front-end work are supported by Java and other tools under component 1.

Conclusion:

Data science enthusiasts can succeed better in their projects and boost their chances of landing specific jobs by choosing correct languages that are suited for the job role they want. Being skilled in a single programming language doesn’t cut it in today’s competitive industry. Seasoned data professionals use a set of languages for their projects. Hence, the result of the principal component analysis implies that it’s wise for data pros to skill up in a few related programming languages rather than a single language, and focus on a specific part of data science.

For more help with your data science learning, get in touch with DexLab Analytics, a leading data analyst training institute in Delhi. Also check our Machine learning courses in Delhi to be trained in the essential and latest skills in the field.

 
Reference: http://customerthink.com/usage-driven-groupings-of-data-science-and-machine-learning-programming-languages
 

Interested in a career in Data Analyst?

To learn more about Data Analyst with Advanced excel course – Enrol Now.
To learn more about Data Analyst with R Course – Enrol Now.
To learn more about Big Data Course – Enrol Now.

To learn more about Machine Learning Using Python and Spark – Enrol Now.
To learn more about Data Analyst with SAS Course – Enrol Now.
To learn more about Data Analyst with Apache Spark Course – Enrol Now.
To learn more about Data Analyst with Market Risk Analytics and Modelling Course – Enrol Now.
General Python Guide 2019: Learning Data Analytics with Python

General Python Guide 2019: Learning Data Analytics with Python

Python and data analytics are possibly three of the most commonly heard words these days. In today’s burgeoning tech scene, being skillful in these two subjects can prove very profitable. Over the years, we have seen the importance of Python education in the field of data science skyrocketing.

So here we present a general guide to help start off your Python learning:

Reasons to Choose Python:

  • Popularity

With over 40% data scientists preferring Python, it is clearly one of the most widely used tools in data analysis. It has risen in popularity above SAS and SQL, only lagging behind R.

  • General Purpose Language

There might be many other great tools in the market for analyzing data, like SAS and R, but Python is the only trustworthy general-purpose language valid across a number of application domains.

2

Step 1: Setup Python Environment

Setting up Python environment is uncomplicated, but a primary step. Downloading the free Anaconda Python package is recommended. Besides core Python language, it includes all the essential libraries, such as Pandas, SciPy, NumPy and IPython, and graphical installer also. Post installation, a package containing several programs is launched, most important one being iPython also known as Jupyter notebook. After launching the notebook, the terminal opens and a notebook is started in the browser. This browser works as the coding platform and there’s no need for internet connection even.

Step 2: Knowing Python Fundamentals

Getting familiar with the basics of Python can happen online. Active participation in free online courses, where video tutorials, practice exercises are plentiful, can help you grasp the fundamentals quickly. However, if you are seeking expert guidance, you must explore our Python data science courses.

Step 3: Know Key Python Packages used for Data Analysis

Since it is a general purpose language, Python’s utility stretches beyond data science. But there are plentiful Python libraries useful in data functionalities.

Numpy – essential for scientific computing

Matplotib – handy for visualization and plotting

Pandas – used in data operations

Skikit-learn – library meant to help with data mining and machine learning activities

StatsModels – applied for statistical analysis and modeling

Scipy-SciPy – the Numpy extension of Python; it is a set of math functions and algorithms

Theano – package defining multi-dimensional arrays.

Step 4: Load Sample Data for Practice

Working with sample datasets is a great way of getting familiar with a programming language. Through this kind of practice, candidates can try out different methods, apply novel techniques and also pinpoint areas of strength and in need of improvement.

Python library StatModels contains preloaded datasets for practice. Users can also download dataset from CSV files or other sources on web.

Step 5: Data Operations

Data administration is a key skill that helps extract information from raw data. Majority of times, we get access to crude data that cannot be analyzed straightaway; it needs to be manipulated before analyzing. Python has several tools for formatting, manipulating and cleaning data before it is examined.

Step 6: Efficient Data Visualization

Visuals are very valuable for investigative data analysis and also explaining results lucidly. The common Python library used for visualization is Matplotlib.

Step 7: Data Analytics

Formatting data and designing graphs and plots are important in data analysis. But the foundation of analytics is in statistical modeling, data mining and machine learning algorithms. Having libraries like StatsModels and Scikit-learn, Python provides all necessary tools essential for performing core analyzing functions.

Concluding

As mentioned before, the key to learning data analytics with Python is practicing with imported data sets. So without delay, start experimenting with old operations and new techniques on data sets.

For more useful blogs on data science, follow DexLab Analytics – we help you stay updated with all the latest happenings in the data world! Also, check our excellent Python courses in Delhi NCR.


Interested in a career in Data Analyst?

To learn more about Data Analyst with Advanced excel course – Enrol Now.
To learn more about Data Analyst with R Course – Enrol Now.
To learn more about Big Data Course – Enrol Now.

To learn more about Machine Learning Using Python and Spark – Enrol Now.
To learn more about Data Analyst with SAS Course – Enrol Now.
To learn more about Data Analyst with Apache Spark Course – Enrol Now.
To learn more about Data Analyst with Market Risk Analytics and Modelling Course – Enrol Now.
Call us to know more